BaffahBTC
Professional Crypto Trader 📊 | Technical Analysis 📈 | Price Action 🎯 | Risk Management ⚖️
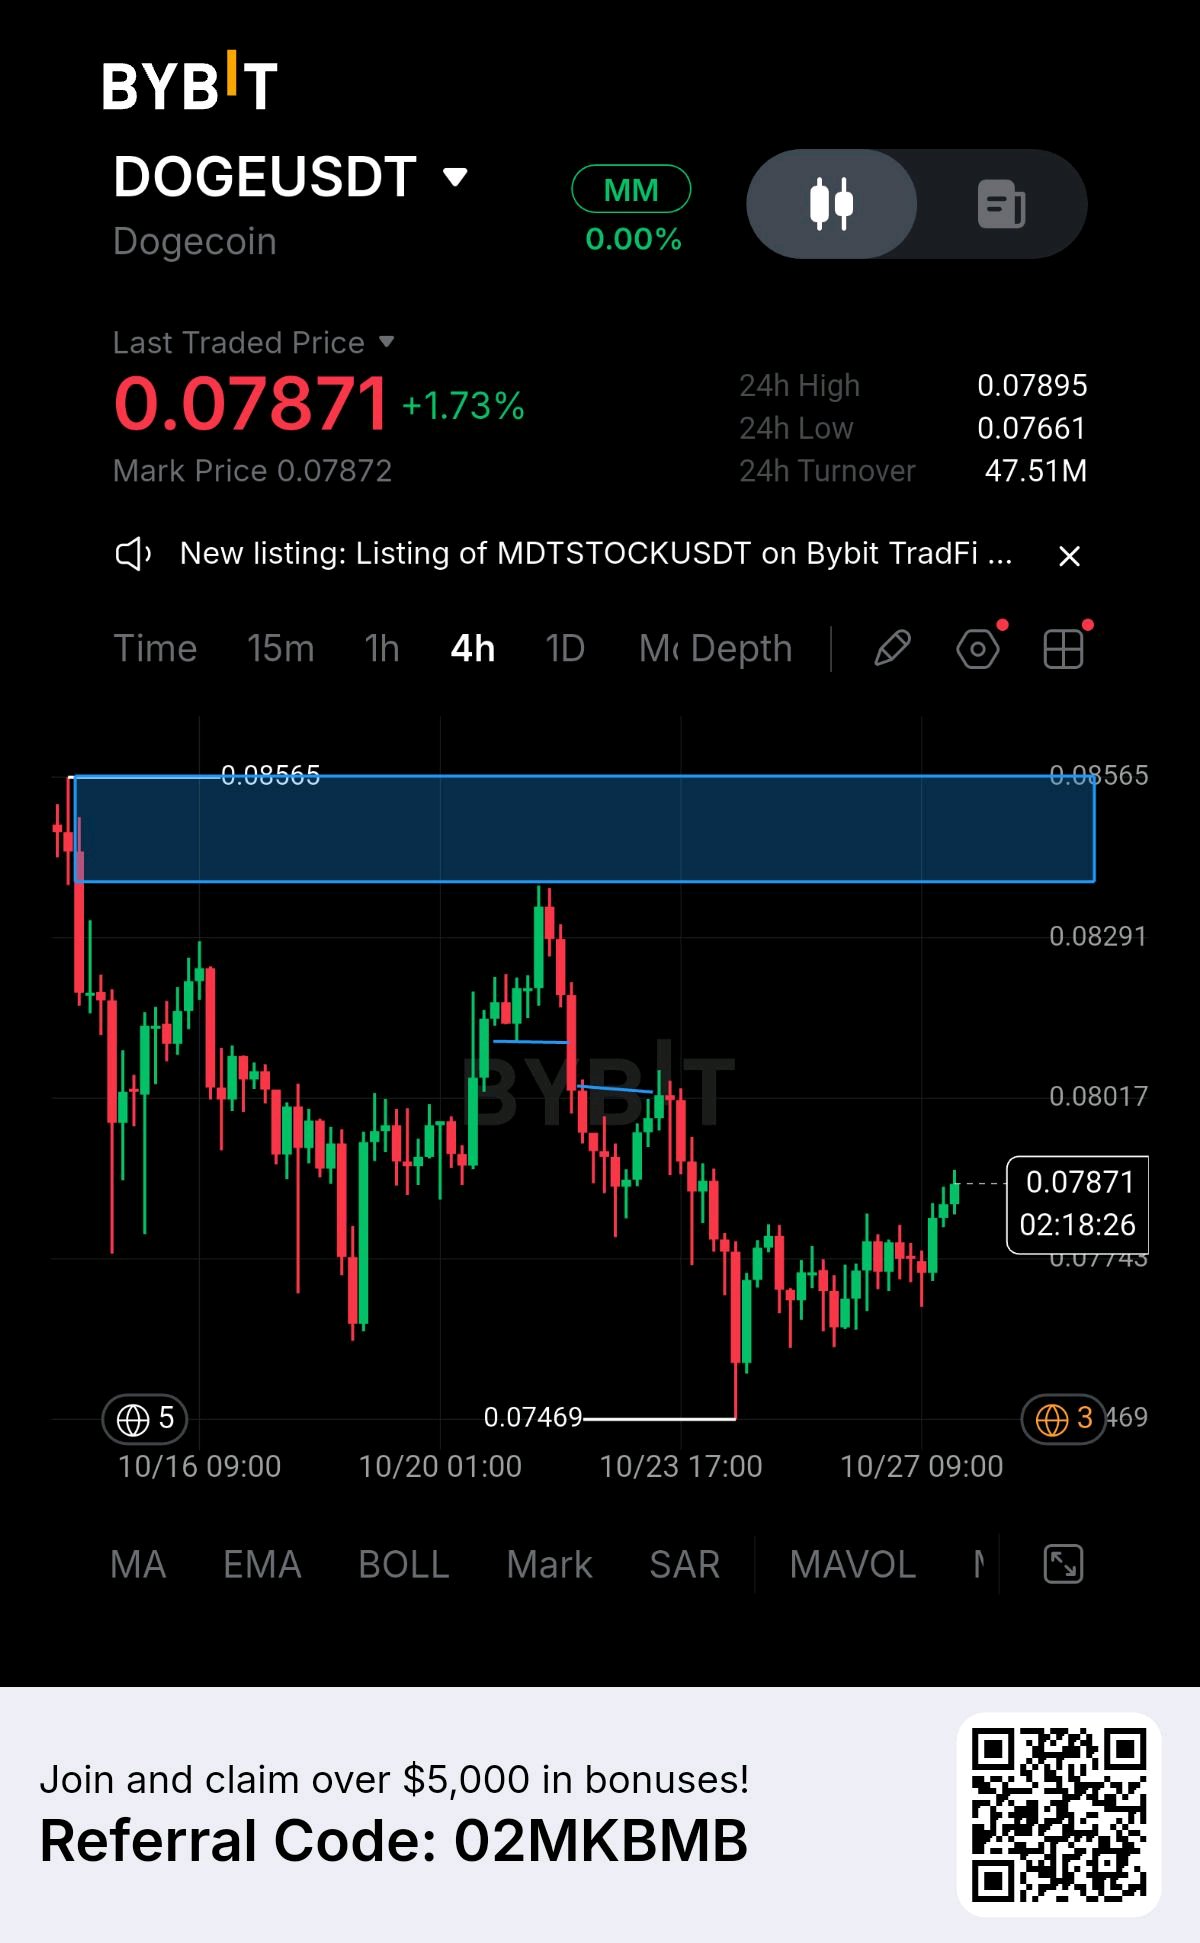
$DOGE LONG-TERM ACCUMULATION ZONE STILL IN FOCUS.
$DOGEUSDT is trading ~$0.077, approaching a key support zone around $0.072–$0.047 on my weekly chart. The previous breakdown invalidated the earlier bullish structure. Now, this zone is critical: holding it could support A HL formation and a potential trend reversal. Macro targets on my chart: $0.60 → $2 DOGE needs to reclaim resistance $0.119 and confirm bullish structure before the next major leg. Will Dogecoin hold its accumulation zone? #ByXIMPACT #IMPACTbyTrade #MyByXTake
Potential Recovery Before Further Downside
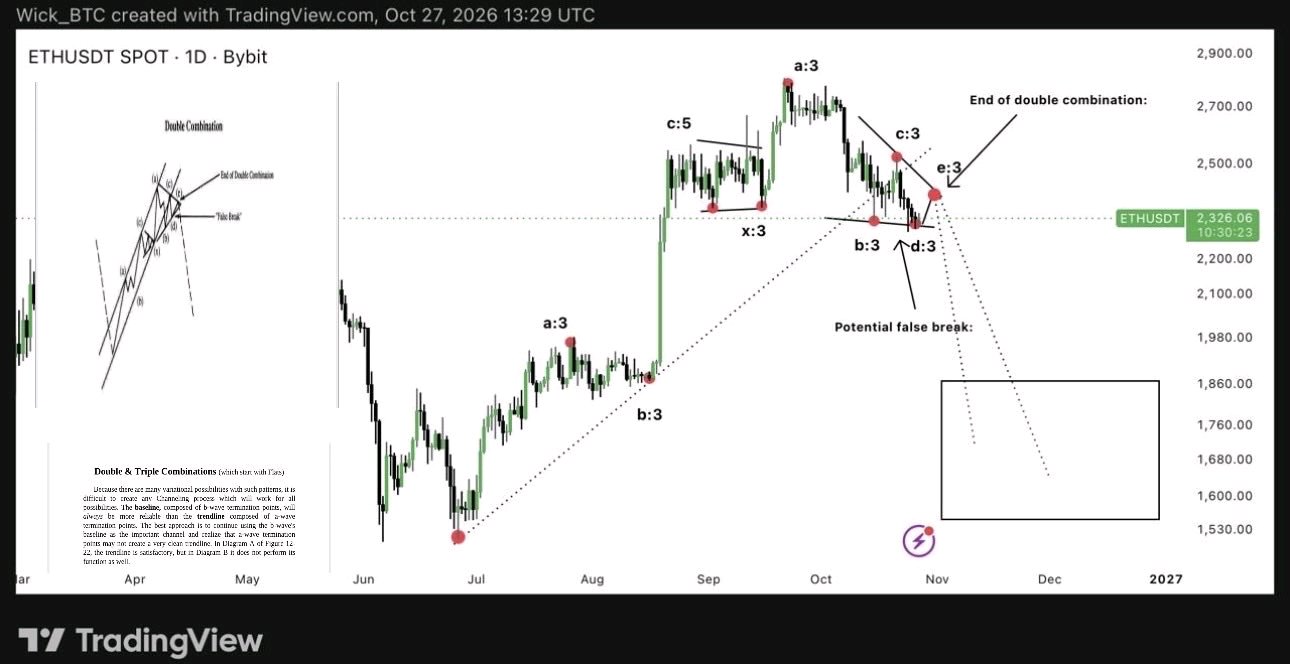
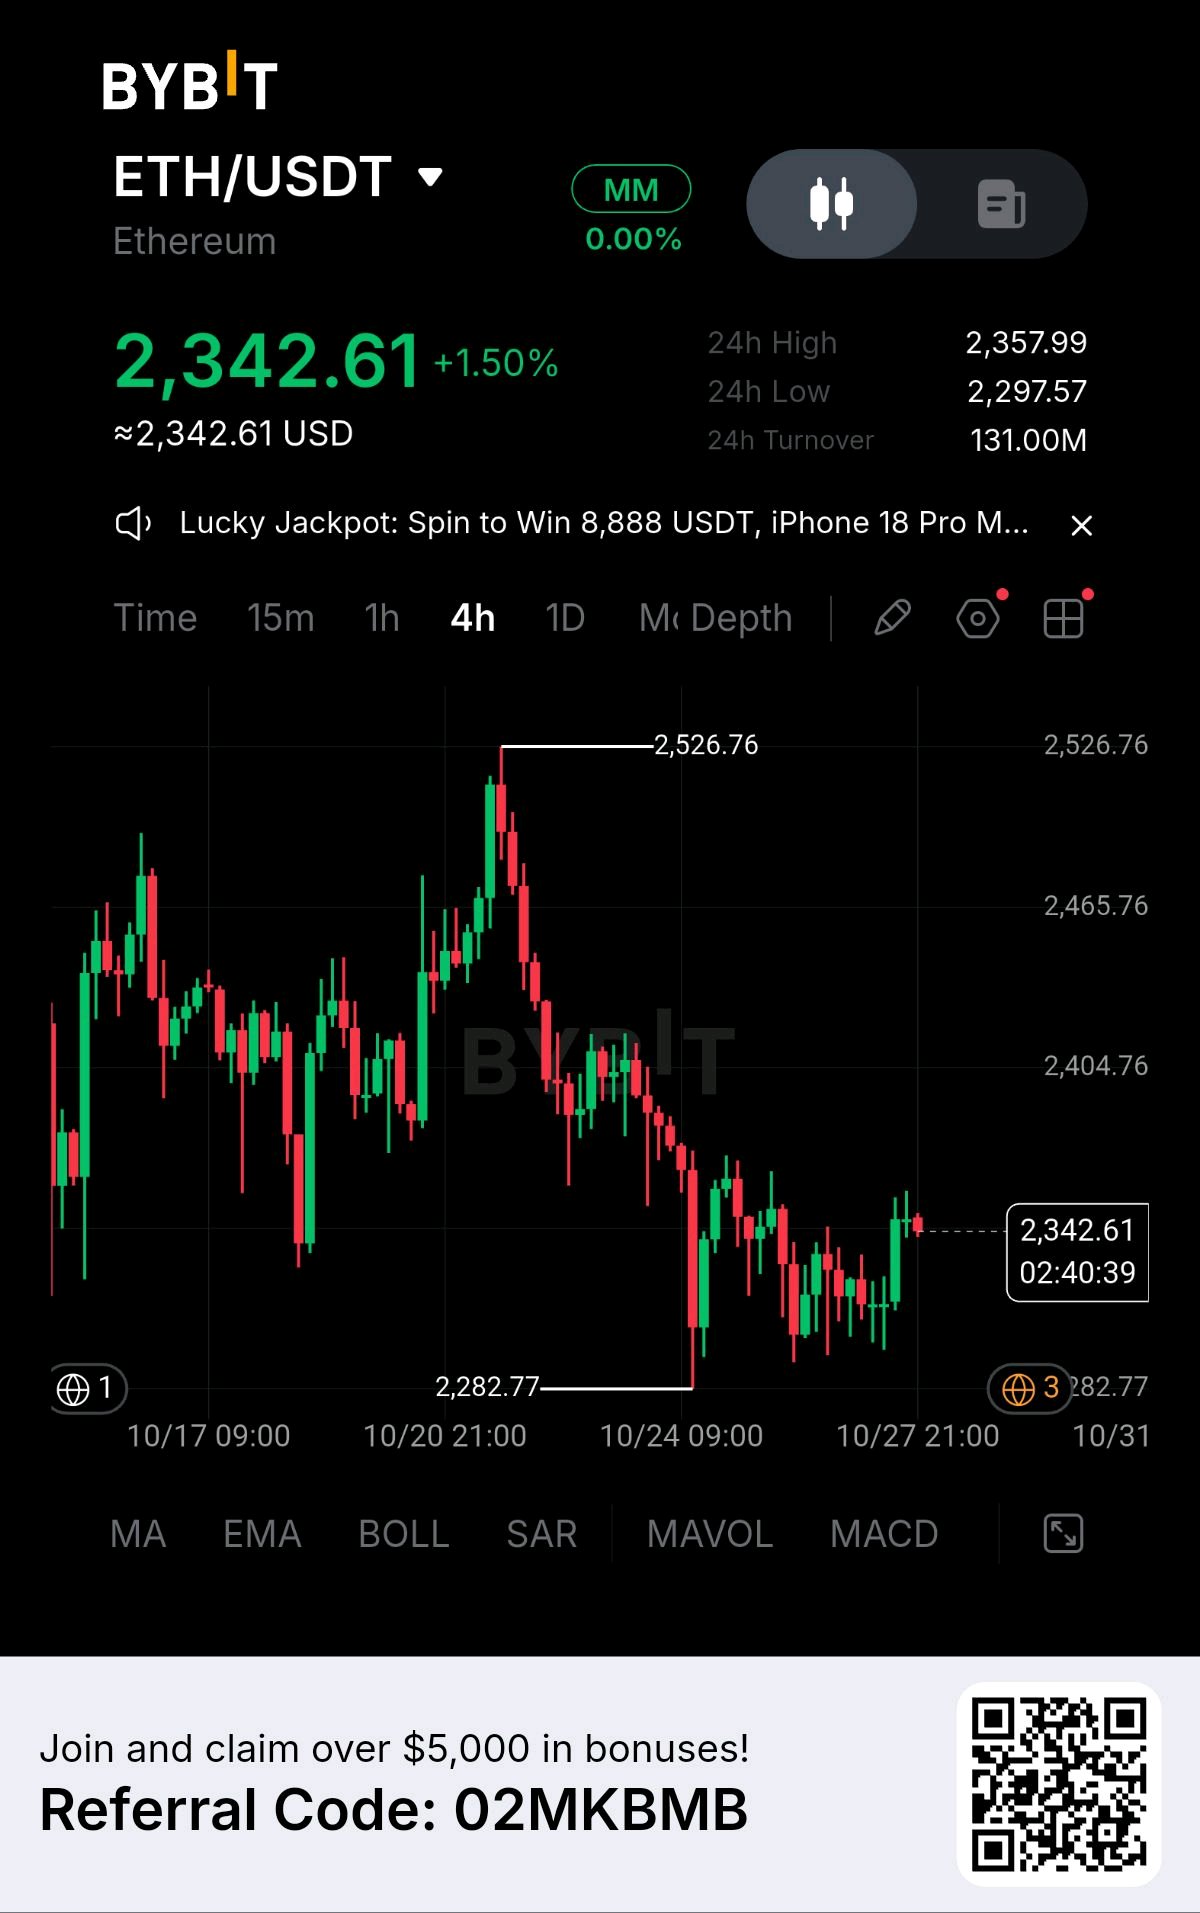
My $ETHUSDT 1D Analysis: Ethereum appears to be developing a broader corrective structure similar to Bitcoin. From my Elliott Wave and NeoWave perspective, the current price action could represent a Double Combination correction. The structure suggests that the initial corrective phase developed into an extended pattern, followed by an X-wave that appears to have formed a contracting triangle connecting the two corrective structures. The final triangle may now be developing, with Waves A, B, and C potentially complete and Wave D approaching completion. Key Structural Observation The B-wave baseline remains an important reference for monitoring this formation. ETH has already broken below this baseline, briefly recovered above it during Wave C, and subsequently declined again as Wave D developed. This price behavior keeps the possibility of a final Wave E recovery in consideration, although the wave count remains provisional until further price confirmation. What Comes Next? My primary scenario is a potential recovery toward the $2,400 region. If this move develops, it could represent Wave E and complete the broader corrective combination before another significant bearish move begins. However, the recovery is not guaranteed. Failure to complete the triangle as expected, continued weakness, or a decisive breakdown could invalidate this interpretation and expose ETH to further downside. My Market Outlook I am watching ETH for a possible final recovery toward $2,400 while keeping the broader bearish scenario in mind. The key is to distinguish a corrective bounce from a genuine bullish trend reversal. If the structure completes as anticipated, the next major move could be to the downside, potentially aligning with the broader bearish outlook for Bitcoin. This remains a technical scenario, not a confirmed prediction. Price action and market structure must validate the count. #ByXIMPACT #WSOT2026 #AnthropicS1Filing #IMPACTbyTrade
🚀 $MNT: Fundamentals Meet Key Support
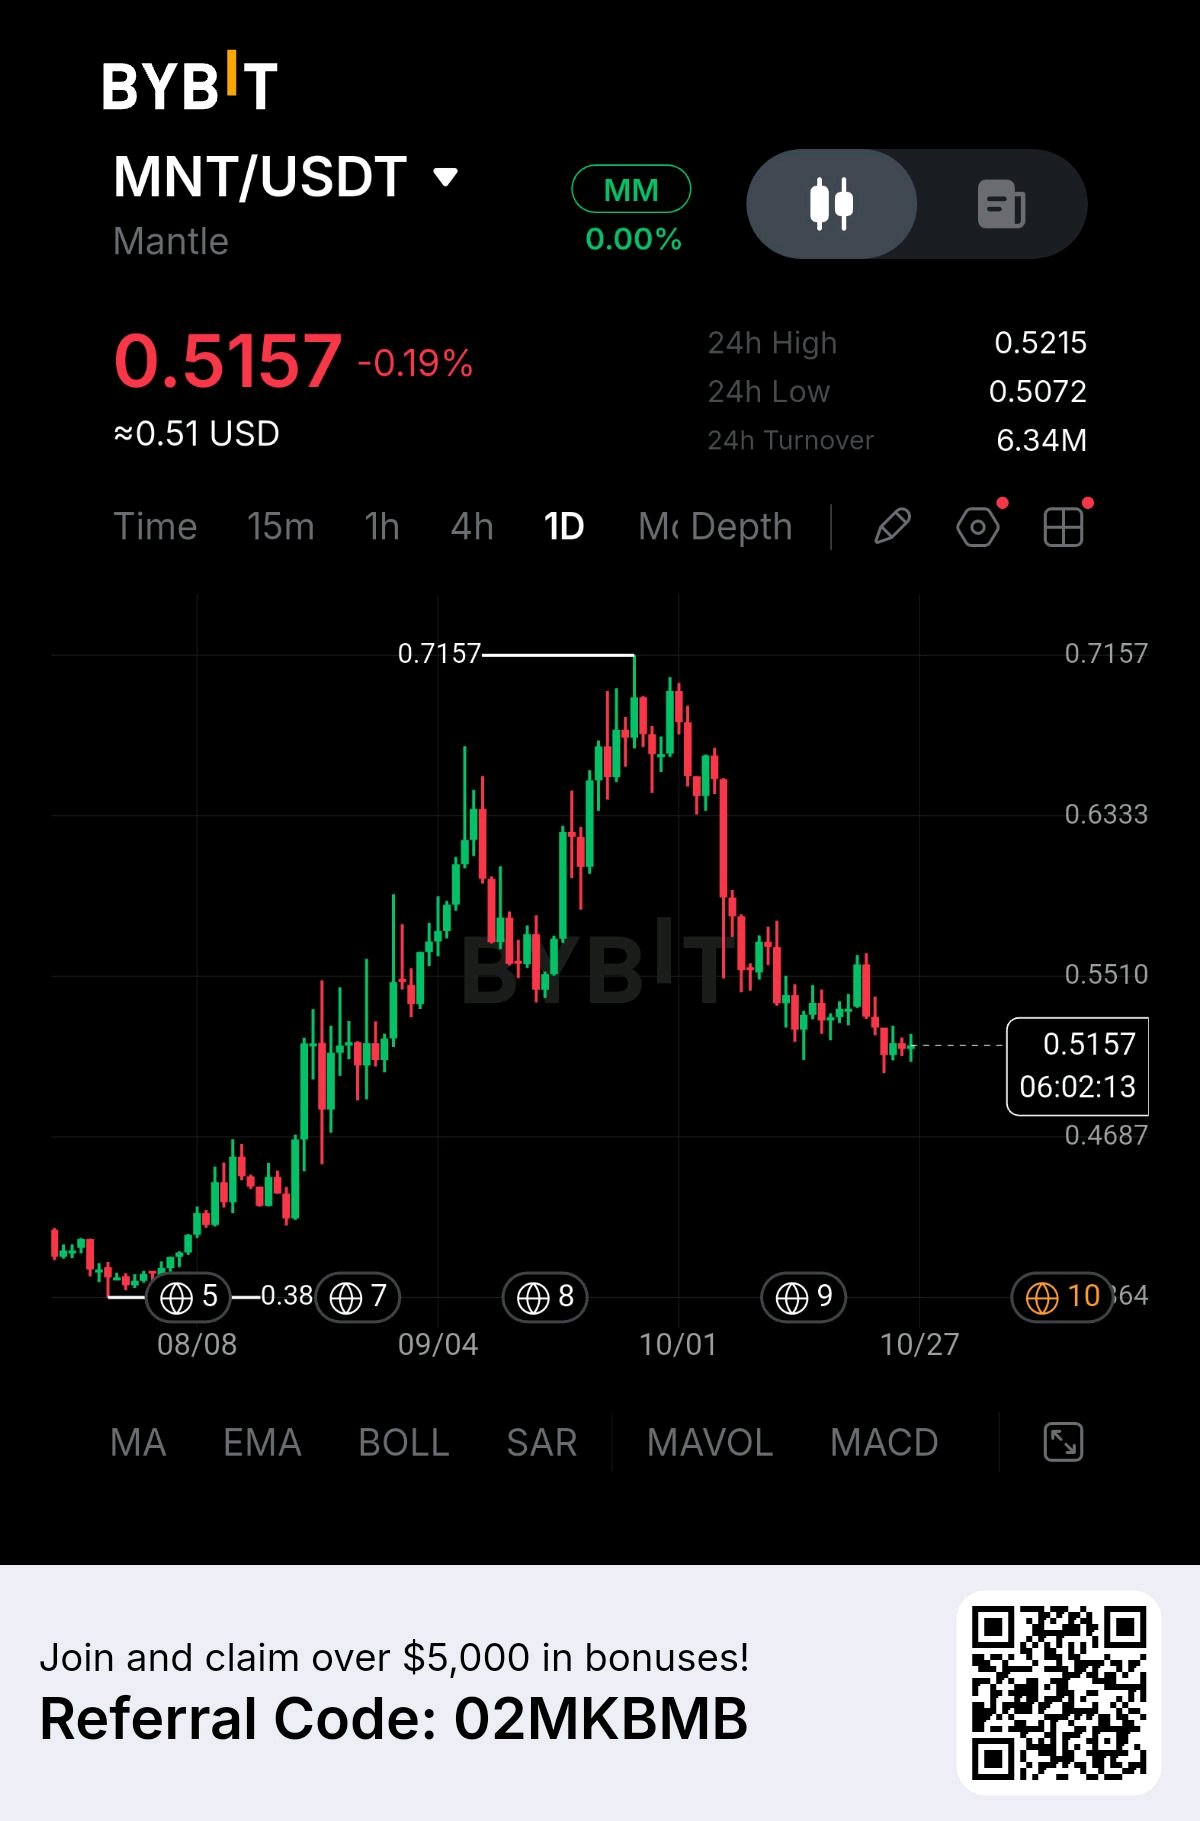
$MNTUSDT is more than another altcoin. Its Ethereum Layer 2 infrastructure, expanding DeFi ecosystem, and focus on scalable on-chain finance make $MNT a project worth watching as the market searches for its next major opportunity. 📊 1. TECHNICAL ANALYSIS — DAILY CHART Current price: $0.5157 After rejecting the $0.7157 high, $MNT entered a corrective phase. Price is now consolidating around a key demand area where the next directional move could become clearer. 🔹 Support: $0.4687–$0.5072 🔹 First resistance: $0.5510 🔹 Major resistance: $0.6333 🔹 Previous high: $0.7157 🔥 A daily breakout above $0.5510 with strong volume could signal improving bullish momentum, potentially opening the way toward $0.6333 and $0.7157. However, losing the $0.50 area could expose the market to further downside. 🌐 2. FUNDAMENTAL STRENGTH ⚙️ Modular architecture: Mantle uses a modular design to support scalable Ethereum transactions. 💎 Token utility: $MNT serves as the network's gas token and plays a role in ecosystem governance. 🏦 DeFi expansion: The Mantle ecosystem includes lending, liquid staking through mETH, and other on-chain financial applications. 🌍 Real-world assets: RWA integrations offer opportunities to connect traditional financial assets with blockchain infrastructure. 🔗 Ethereum ecosystem: Mantle benefits from Ethereum's established developer and user ecosystem while competing in the growing Layer 2 market. 💰 3. INFLOWS, OUTFLOWS & NETWORK ACTIVITY Inflows: Monitor capital entering Mantle's DeFi protocols and ecosystem. Outflows: Watch withdrawals from DeFi protocols and changes in bridged assets, which can indicate shifts in investor confidence. Network: Rising active addresses, transaction counts, and ecosystem usage could strengthen the fundamental outlook if accompanied by sustainable demand for $MNT. These metrics need to be verified against current on-chain data before drawing firm conclusions. 📈 4. WHAT COULD TRIGGER THE NEXT MOVE? The bullish scenario depends on three factors: ✅ Holding the $0.50 support region. ✅ Reclaiming $0.5510 with increasing volume. ✅ Improving liquidity, network activity, and broader crypto-market sentiment. If these conditions align, $MNT could attempt a recovery toward higher resistance levels. ⚠️ KEY RISKS A strong project does not guarantee a rising token price. Competition among Layer 2 networks, token supply dynamics, weak altcoin sentiment, and declining network activity could undermine the bullish thesis. 🚀 FINAL OUTLOOK $MNT combines a meaningful Ethereum scaling narrative with a developing DeFi ecosystem. The fundamentals make it worth monitoring, while the $0.50 support area and $0.5510 resistance level provide important technical reference points. A confirmed breakout could open the door to a stronger recovery. Until then, patience and confirmation matter more than speculation. #ByXIMPACT #AnthropicS1Filing #IMPACTbyTrade #MidtermsMarketWatch #MyByXTake
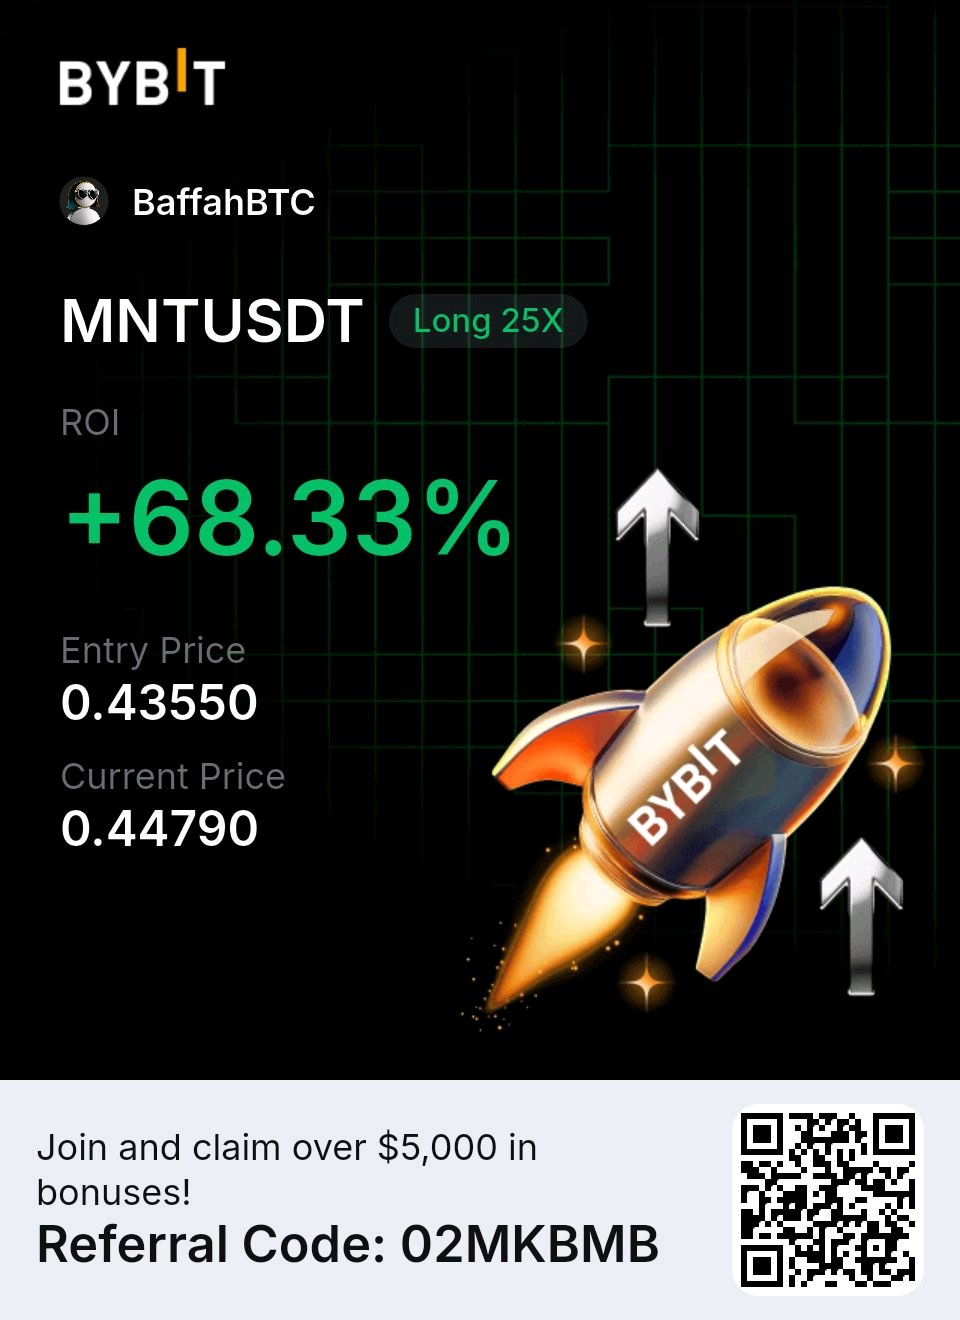
ALMOST TO MY TARGET GUYS
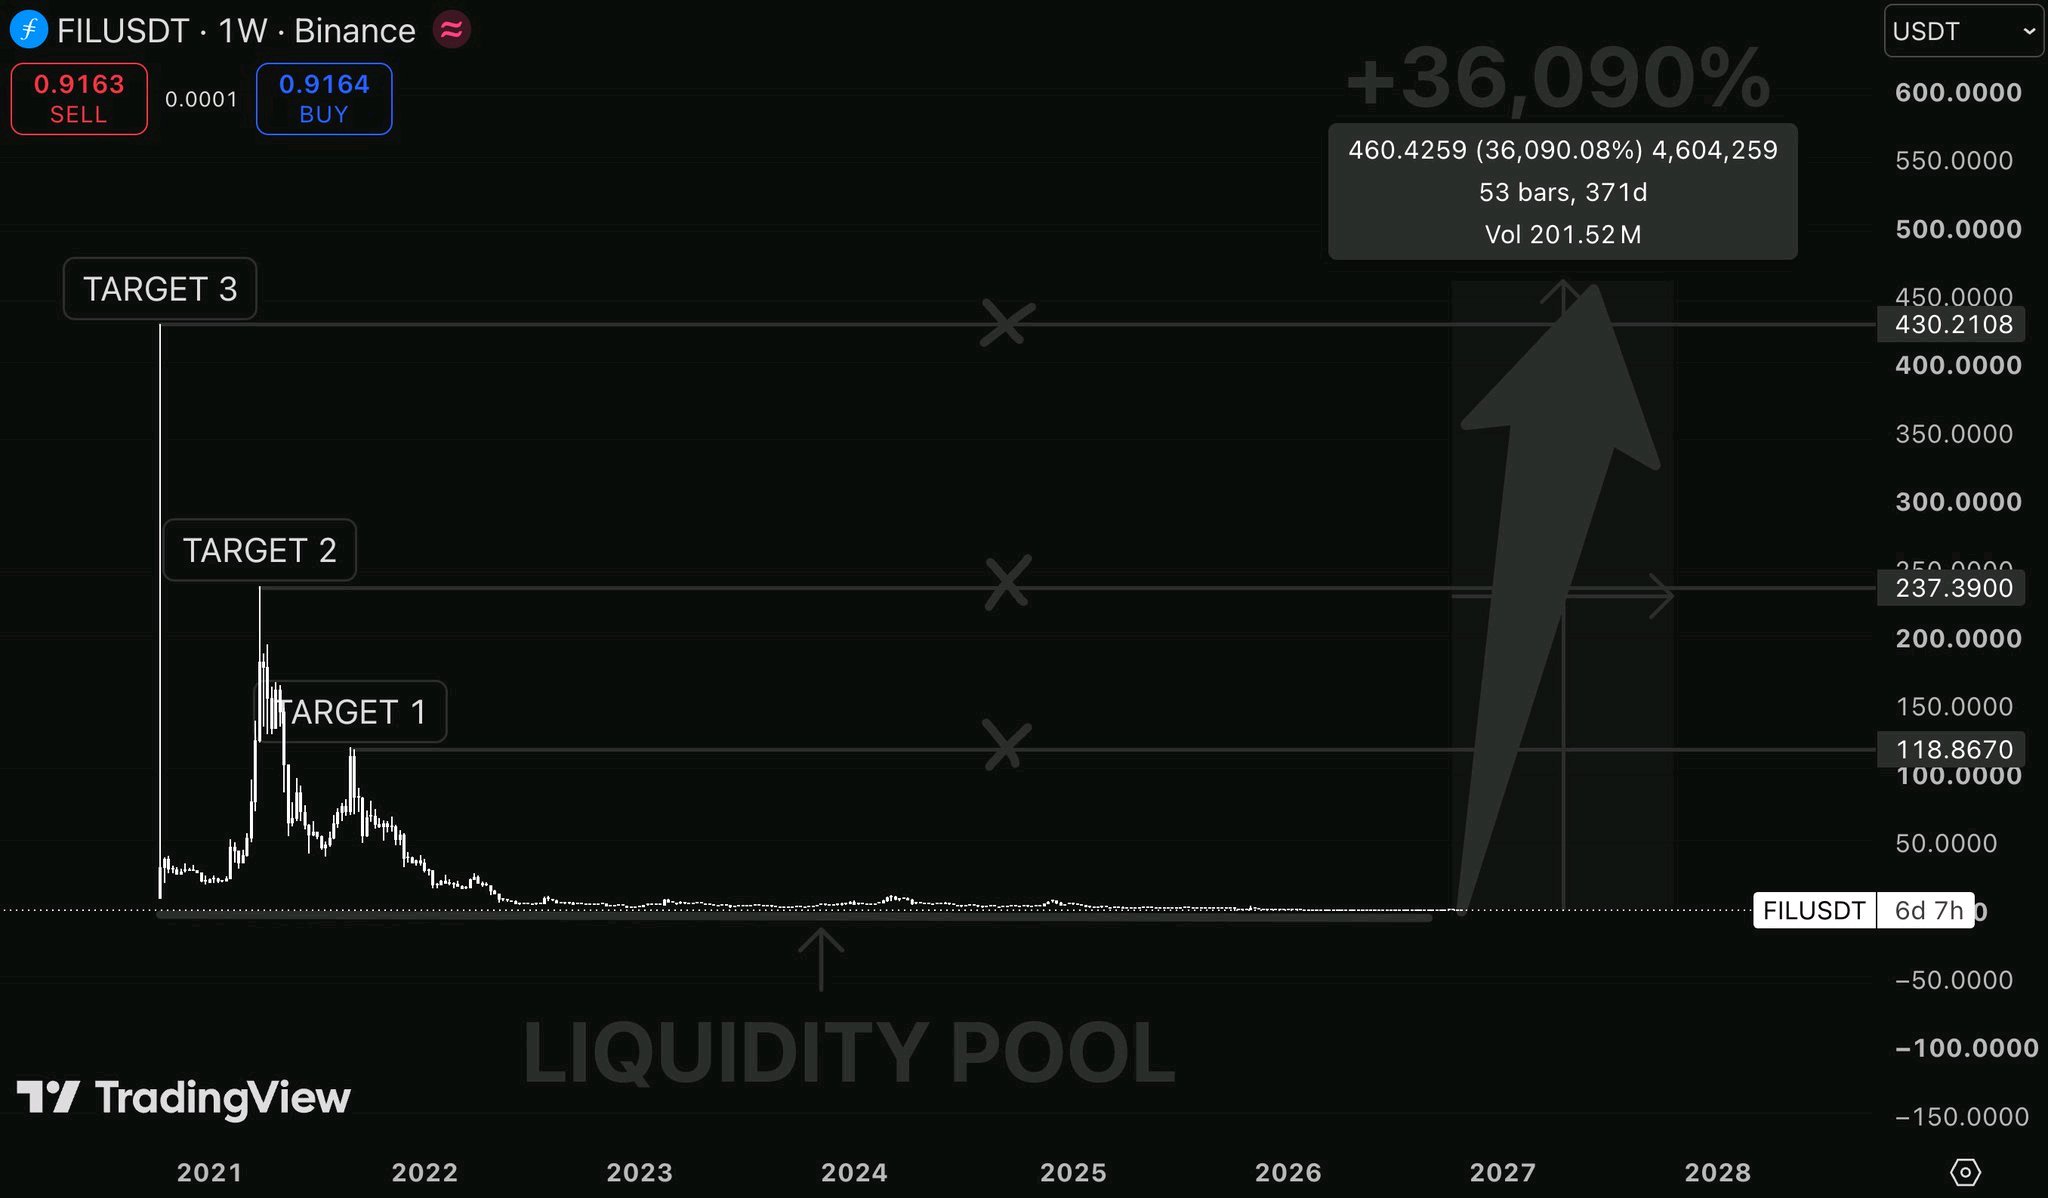
Almost everyone who bought $FIL over the past 5 years is underwater. But here's what interests me. The weekly chart shows price sitting near its historical lows after years of relentless selling. My long-term targets: $118.86 $237.39 $430.21 Yes, the full scenario implies over 36,000% upside. Sounds insane. And frankly, it would require an extraordinary comeback, not just a normal bull market. I'm not saying $FIL will hit those numbers. Old highs don't guarantee future demand. But this is exactly the kind of chart I want on my radar when sentiment is completely dead. Would you risk buying $FIL below $1? #ByXIMPACT #WSOT2026 #AnthropicS1Filing #IMPACTbyTrade #MyByXTake $ETHUSDT
$BTC is still in the pre-FOMC consolidation.
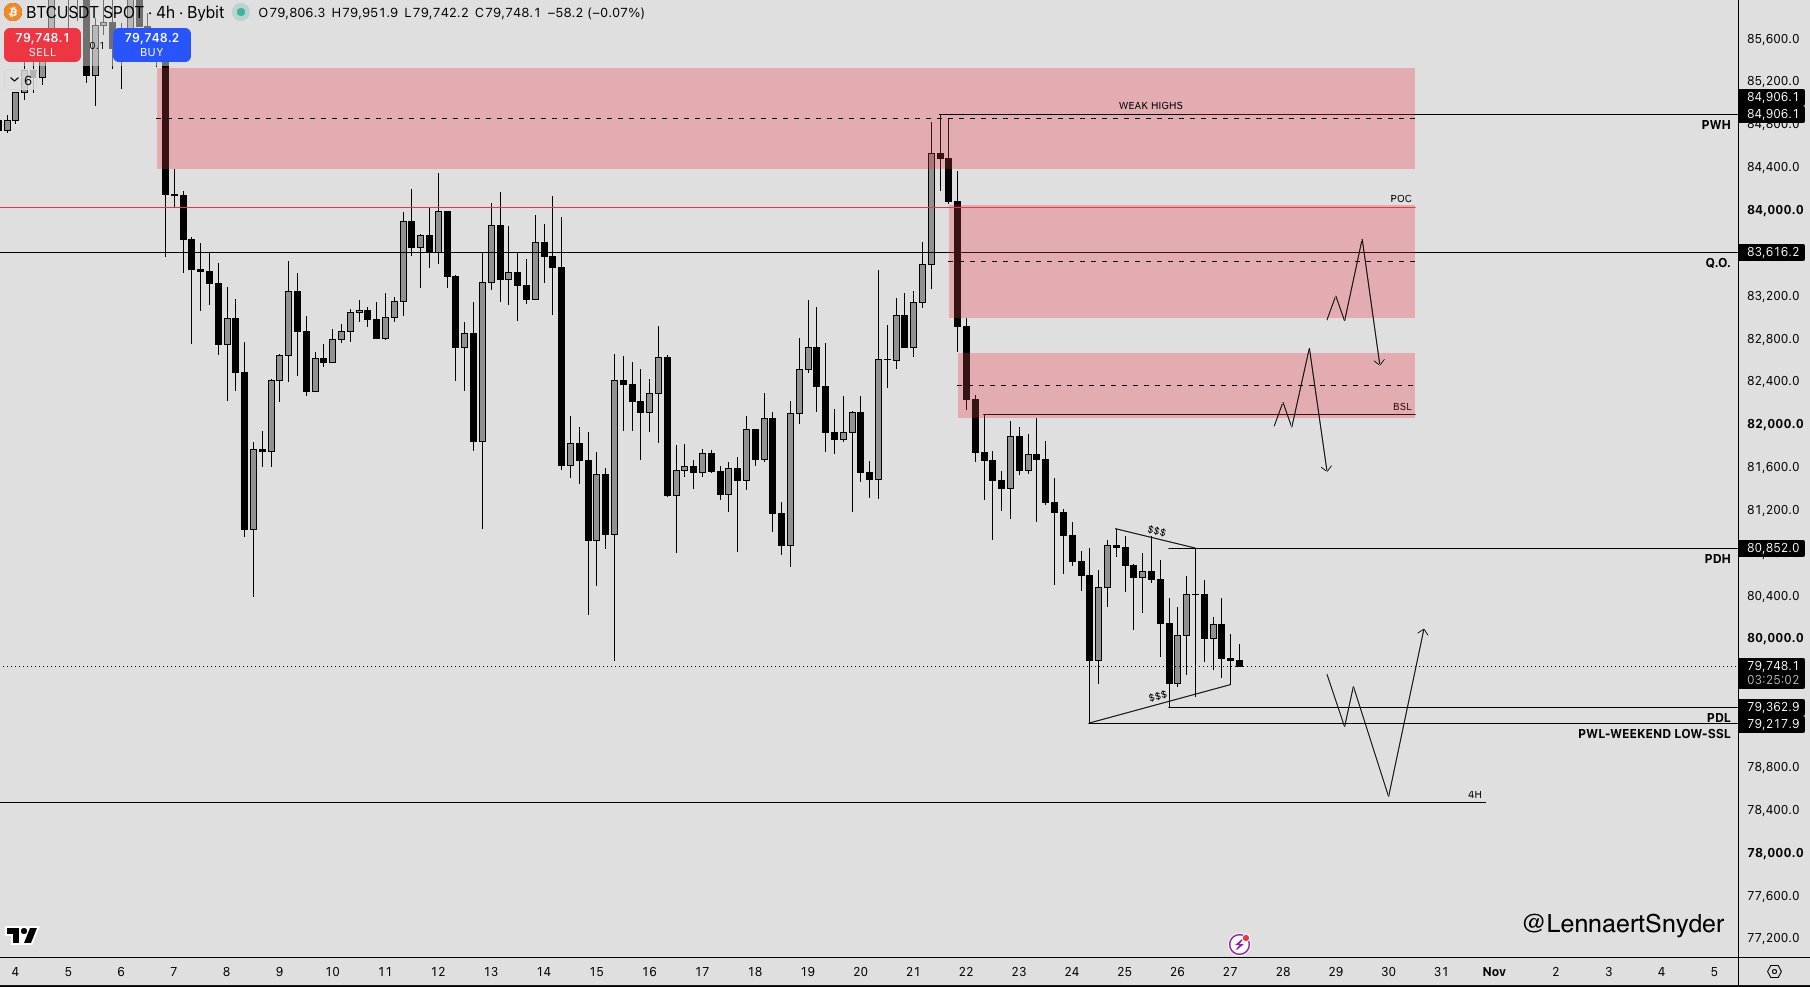
Like I mentioned yesterday, the chances are likely we're staying in a tight consolidation until after FOMC tomorrow. $BTCUSDT is engineering liquidity on both sides here, these are exactly the circumstances that traps/induces impatient traders. No need to burn your fingers in bad conditions, the plan remains the same and I'll wait patiently. If we sweep the low, I like the region between 78.3K-79K for longs after the trigger, targeting 82K BSL. If the market reprices higher, my POI's for shorts after the trigger are the same as yesterday. Note that if we sweep the lows first and then reprice to the upside, the shorts will be counter-trend hedges. Longs also after triggers only because an unexpected FOMC-release can cause BTC to tank further to the downside. Alerts are set, sitting on hands or now. #AnthropicS1Filing #IMPACTbyTrade #ByXIMPACT #WSOT2026
📉 $AAVE HTF UPDATE: A COMPLEX CORRECTION IN PLAY?
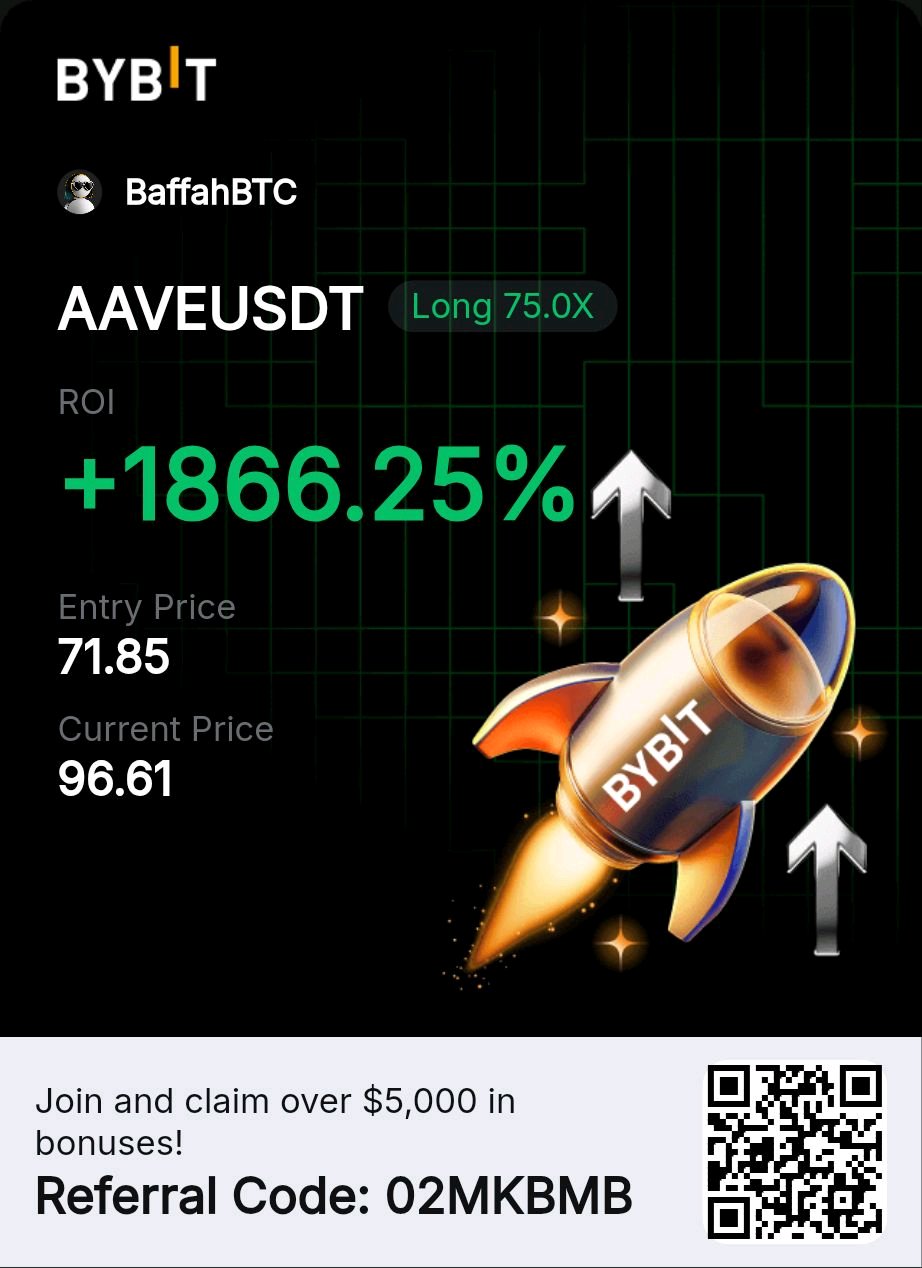
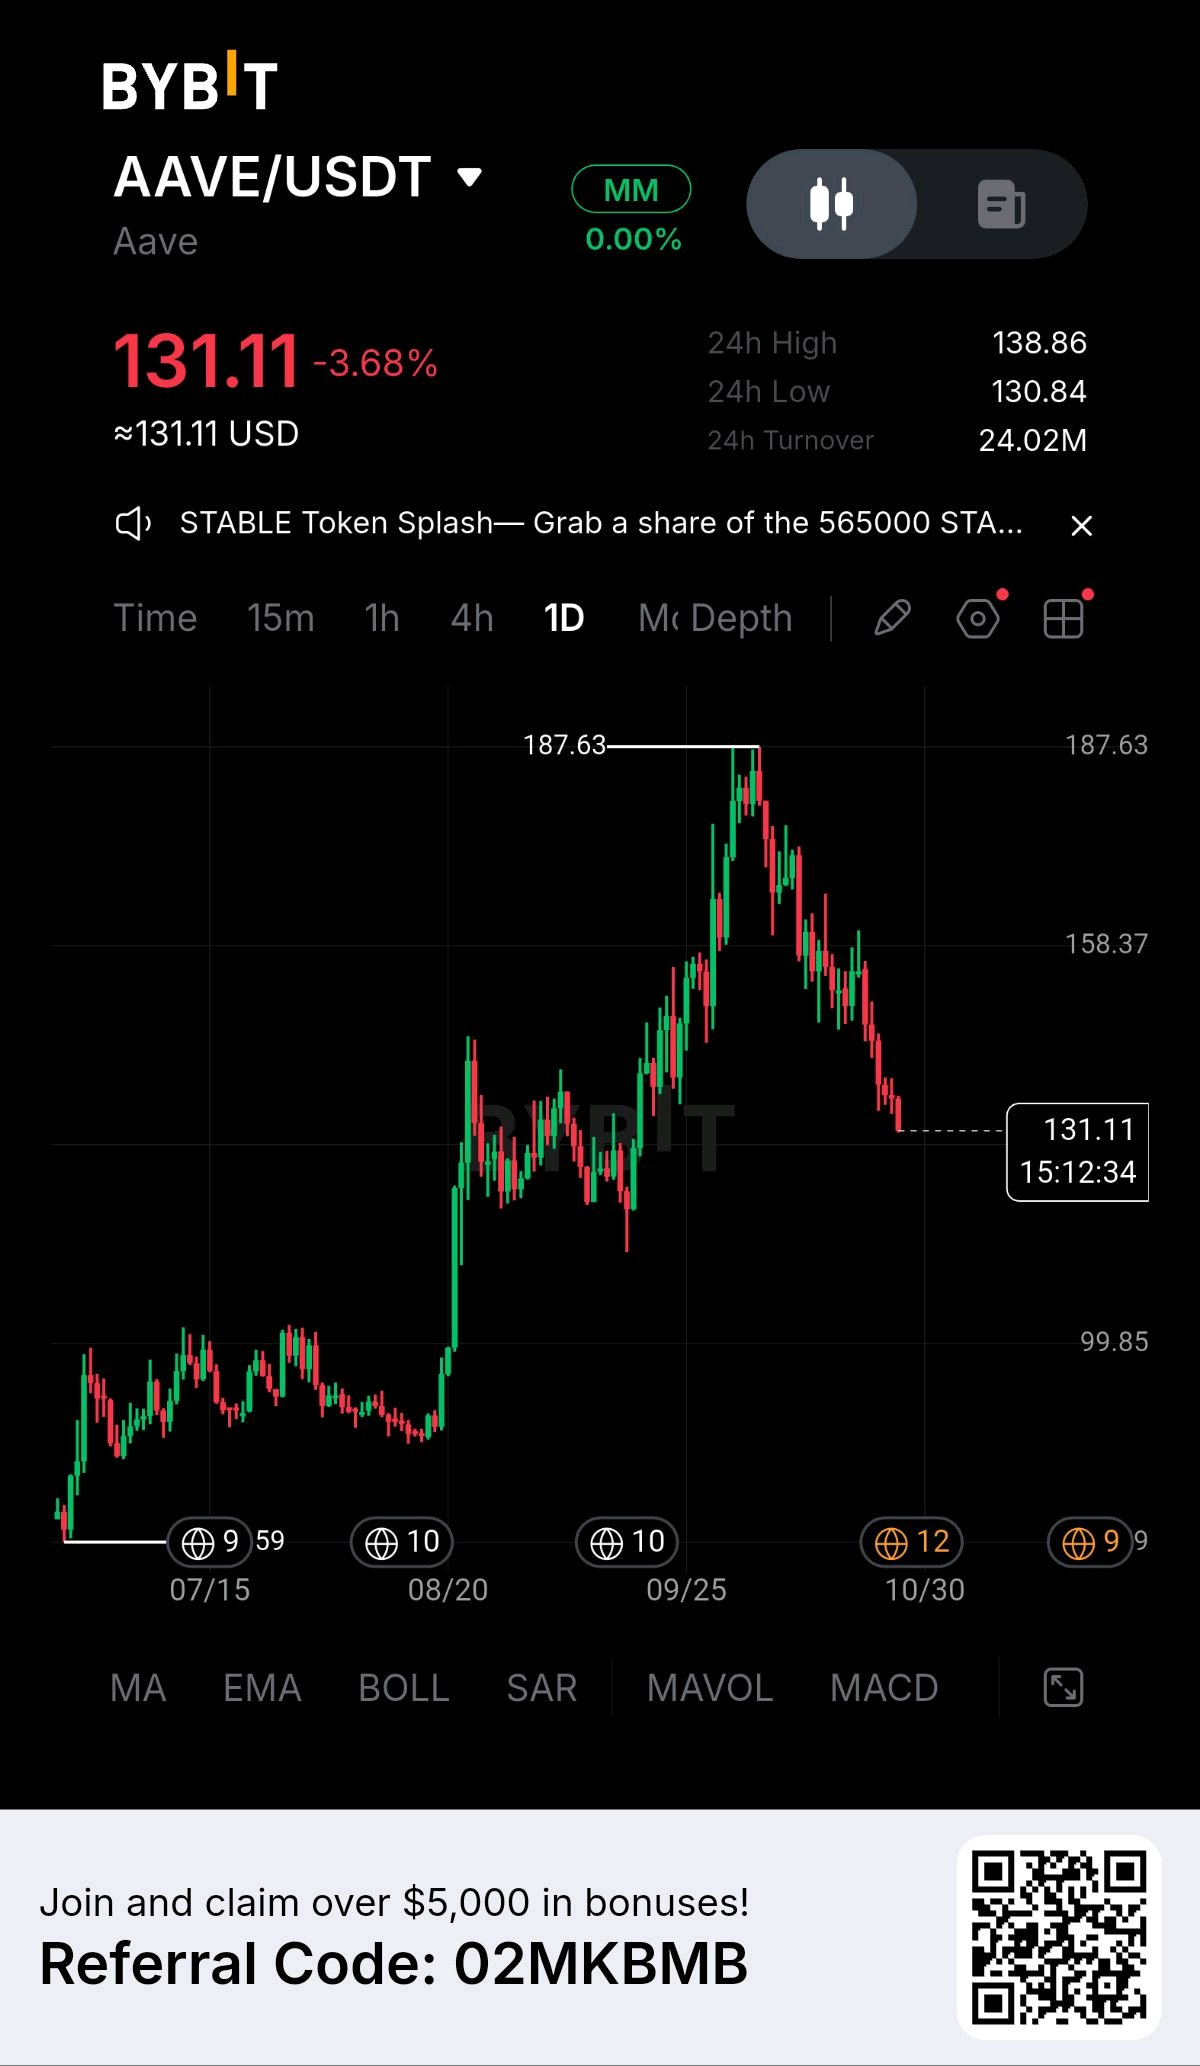
$AAVEUSDT higher-timeframe structure appears to be developing into a Double Combination, with its 2026 price action showing similarities to the 2022 corrective structure. The main difference is time: the current formation is taking considerably longer to develop, supporting the possibility of an extended bearish phase. 🔍 1. ELONGATED FLAT The first phase involves an extended flat correction, with similarities visible in both the 2022 and 2026 structures. 🔺 2. POTENTIAL TRIANGLE Following the flat, the structure may develop into a triangle. If this interpretation holds, completing the triangle could mark the final stage of the correction. 🎯 PROJECTED BOTTOM ZONE: $24–35 If the 2022 analogue remains relevant, AAVE could continue consolidating before reaching its projected bottom zone over the coming months. 📊 3. WHY NOT A STANDARD IMPULSE? The proposed five-wave impulse count presents several NeoWave inconsistencies: ▪️ Wave 2 retraces too deeply into Wave 1. ▪️ Wave C appears too simple relative to Wave A. ▪️ The proposed Wave 3 extension does not meet the cited guideline. These factors make a complex corrective structure worth considering. 🚨 FINAL OUTLOOK The 2022 comparison provides a potential roadmap, not a guaranteed repeat. I'm watching for confirmation of the triangle formation and its eventual resolution. If the pattern develops as expected, the $24–35 zone could become a major area of interest for a potential long-term bottom. #ByXIMPACT #WSOT2026 #AnthropicS1Filing #MyByXTake
🚀 $GOOGLX: GOOGLE'S AI AND CLOUD GROWTH STORY
Alphabet, Google's parent company, remains a major force in digital advertising, cloud computing, and artificial intelligence. Its expanding technology ecosystem provides several potential drivers for long-term growth. 🏢 1. FUNDAMENTAL STRENGTH 🔎 Google Search: A major advertising revenue engine supported by a global user base. ▶️ YouTube: Advertising and subscriptions create additional recurring revenue opportunities. ☁️ Google Cloud: Enterprise demand for cloud infrastructure and AI services offers significant growth potential. 🤖 Artificial Intelligence: Gemini and AI integration across Google's products could improve competitiveness and unlock new revenue streams. 📈 2. KEY GROWTH CATALYSTS ✅ AI monetization and innovation. ✅ Google Cloud expansion. ✅ Strong advertising demand. ✅ Growth across subscriptions and digital services. ✅ Continued investment in technology and infrastructure. 💰 3. INFLOWS, OUTFLOWS & NETWORK Inflows: Demand for tokenized Alphabet exposure may encourage additional token issuance. Outflows: Redemptions can reduce circulating token supply. Network: Blockchain infrastructure enables transfers through supported networks, subject to platform availability. Unlike traditional crypto projects, $GOOGLXUSDT derives its investment thesis primarily from Alphabet's underlying share performance rather than staking rewards or token scarcity. 🌐 4. ADOPTION & UTILITY Tokenized equities connect traditional financial assets with blockchain technology, potentially offering fractional exposure and easier digital transfers. ⚠️ 5. RISKS TO WATCH 🔻 AI competition and rising infrastructure costs. 🔻 Antitrust and regulatory pressure. 🔻 Advertising-market weakness. 🔻 Valuation risks and potential stock-market corrections. 🔻 Token issuer, custody, and liquidity risks. 🚀 FINAL OUTLOOK Alphabet's combination of AI, advertising, cloud computing, and a global technology ecosystem provides a compelling fundamental growth story. The key question is whether AI investments and cloud expansion can translate into sustained revenue growth and stronger profitability. Strong ecosystem. Expanding AI opportunities. Long-term growth potential. #ByXIMPACT #WSOT2026 #AnthropicS1Filing #MyByXTake #IMPACTbyTrade

🚀🐶 $BABYDOGE: THE NEXT EXPLOSIVE MOVE IS LOADING!
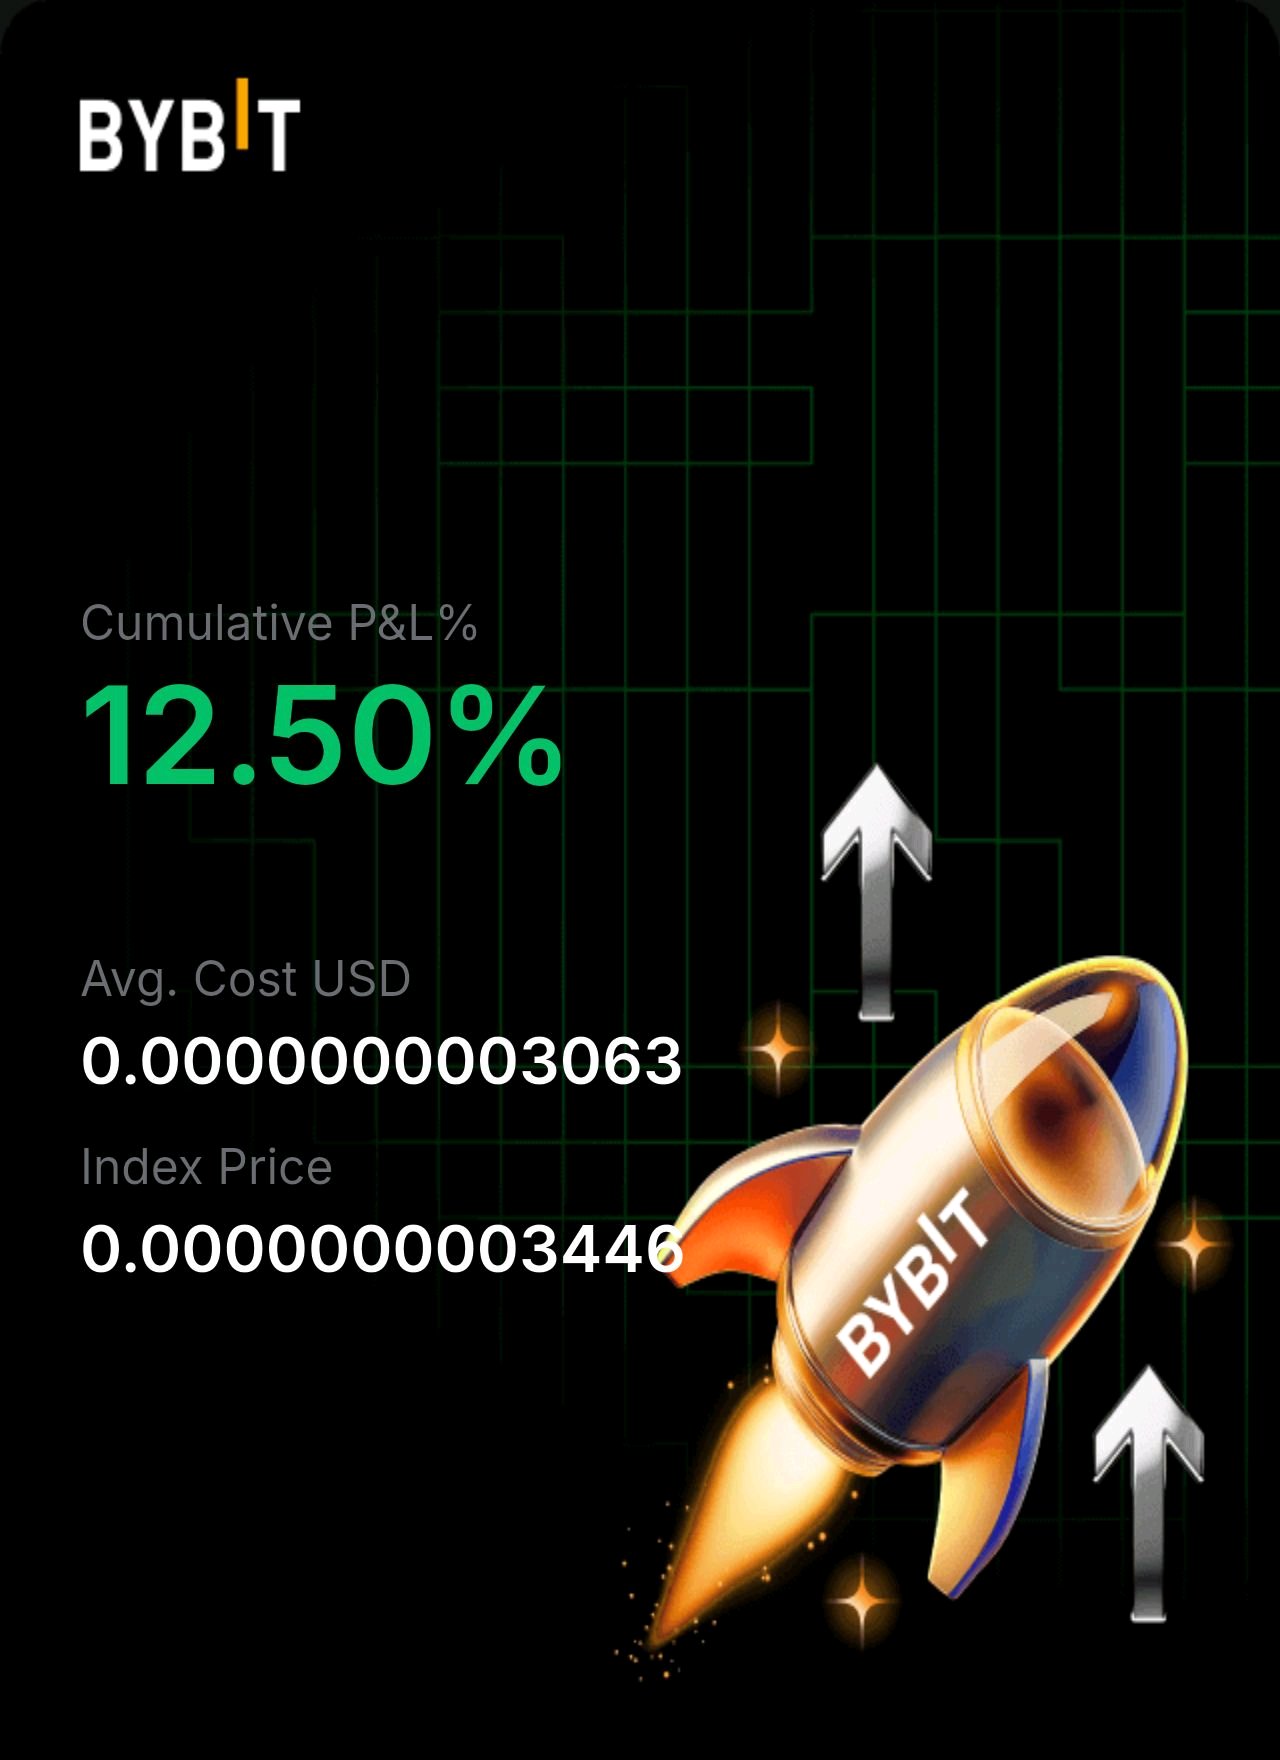
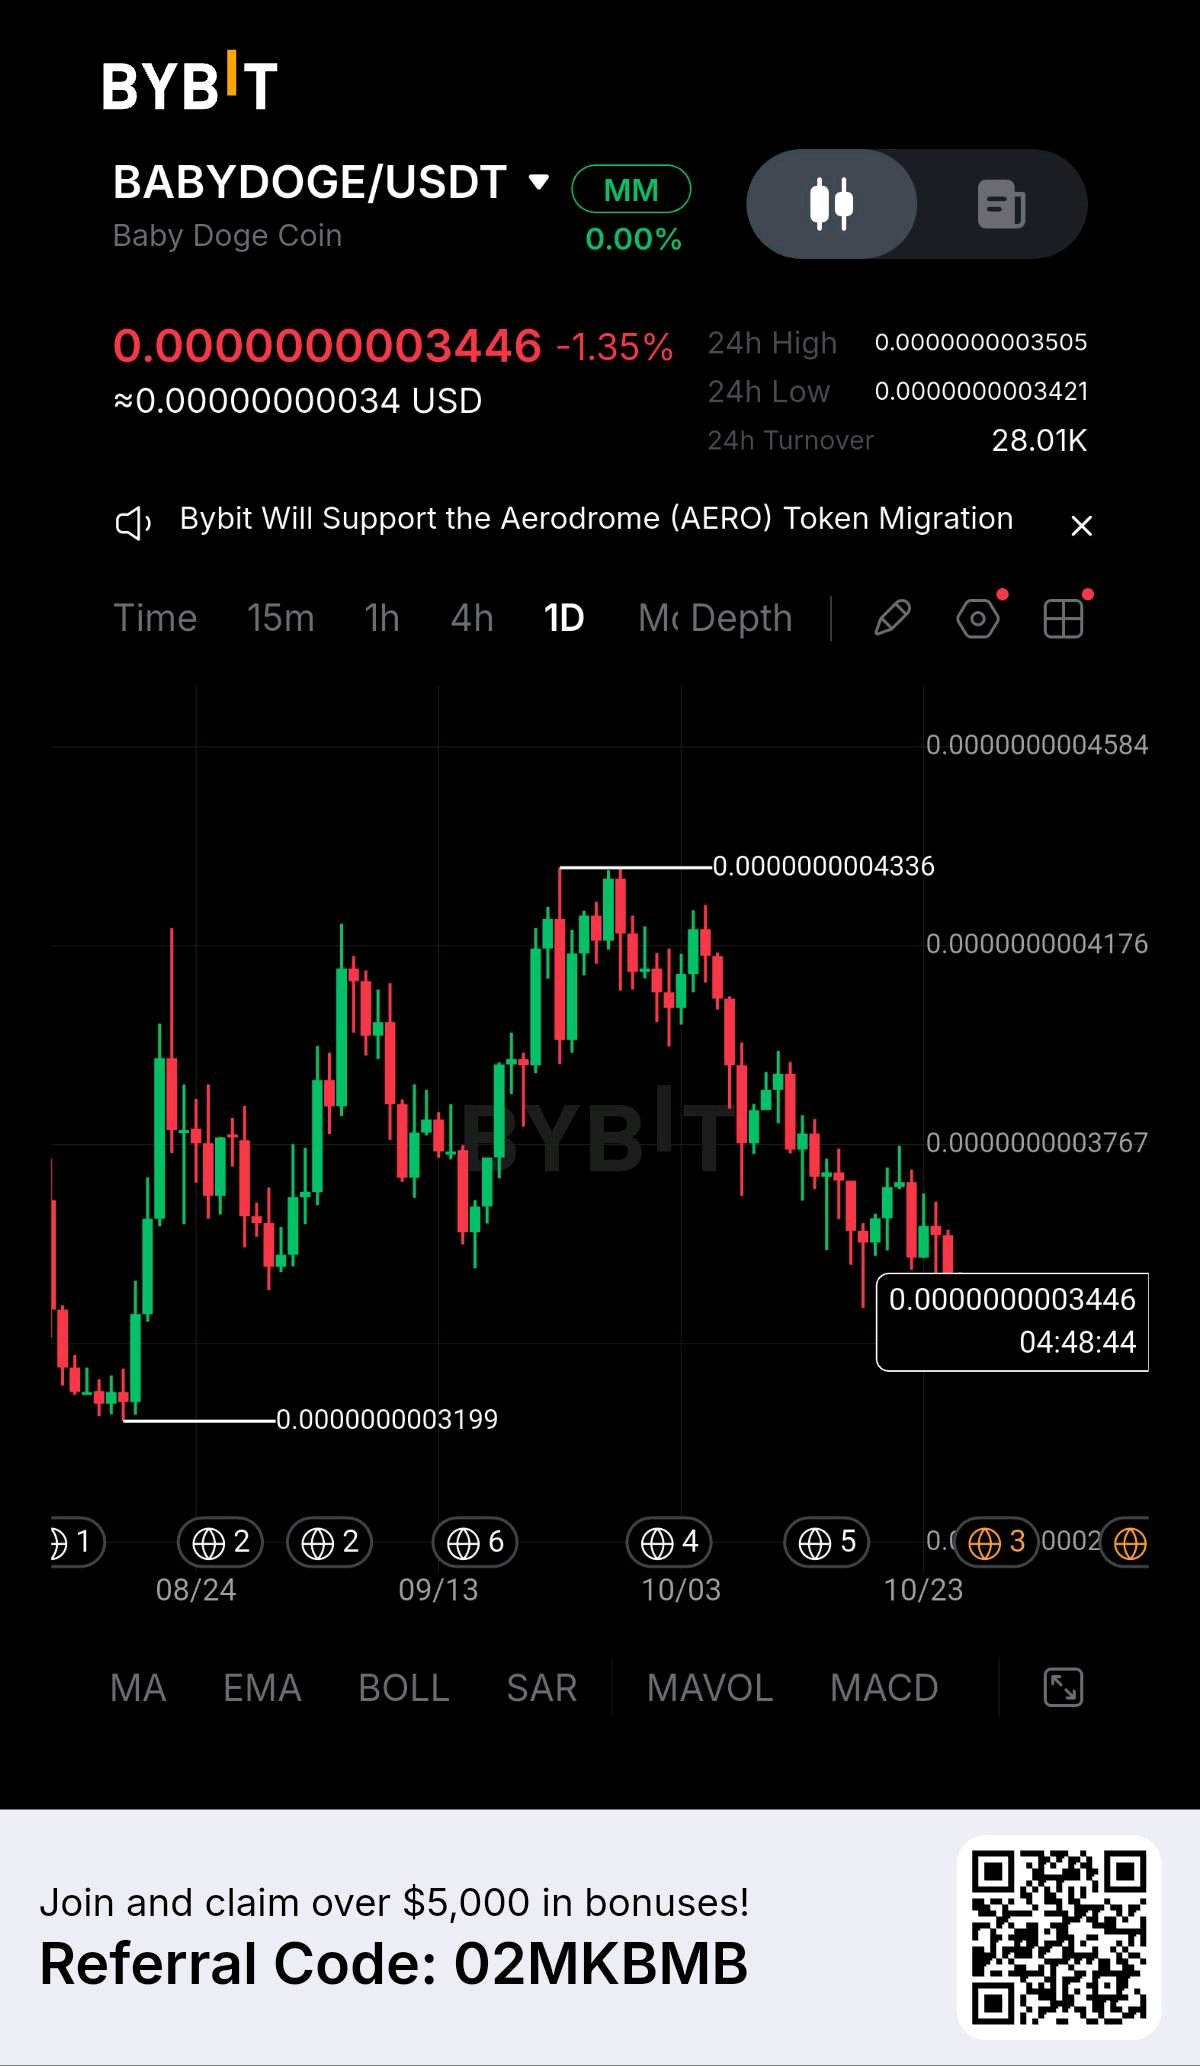
The setup is getting interesting, and I'm watching $BABYDOGEUSDT with a bullish outlook. I'm already sitting on 12.50% cumulative profit, but my focus remains on the larger opportunity ahead. 📈🔥 This is about more than a few green candles. It's about price structure, liquidity, market sentiment, and the catalysts that could drive the next major move. 📊 1. TECHNICAL ANALYSIS: KEY LEVELS TO WATCH Current price: $0.00000000003446 $BABYDOGE has pulled back from its recent high near $0.00000000004336, bringing price back toward an important support area. 🔹 Support zone: $0.00000000003200–$0.00000000003420 🔹 First resistance: $0.00000000003770 🔹 Major resistance: $0.00000000004170–$0.00000000004336 My bullish scenario is straightforward: ✅ Buyers defend support. ✅ Price reclaims $0.00000000003770. ✅ Trading volume expands as momentum strengthens. ✅ A breakout above $0.00000000004336 opens the door to a potential continuation move. A confirmed breakout would strengthen the bullish structure and could attract additional momentum traders. 🔥 2. FUNDAMENTAL CATALYSTS: WHY I'M WATCHING $BABYDOGE The next major meme-coin rally could be driven by several factors: 💰 Liquidity inflows: Fresh capital entering the crypto market can increase demand for speculative assets. ₿ Bitcoin's market direction: A sustained Bitcoin recovery could improve sentiment across the altcoin and meme-coin sectors. 🐶 Community strength: $BABYDOGE's community and brand recognition can help sustain attention during favorable market conditions. 🌐 Network and ecosystem activity: Increasing transactions, active users, and ecosystem participation would strengthen the fundamental case if supported by verifiable data. 📈 Market momentum: A high-volume breakout could attract new buyers and accelerate price discovery. These catalysts provide a framework for the bullish thesis. The key is whether actual market data confirms improving demand. 💎 3. MY POSITION AND MARKET OUTLOOK I'm already in +12.50% cumulative P&L, and I'm tracking the next potential expansion rather than focusing only on the short-term pullback. The current price structure presents important levels for bulls to reclaim. If buying pressure returns and resistance breaks convincingly, #ByXIMPACT could enter another strong upward phase. My focus is on confirmation, momentum, and managing the position professionally. ⚠️ RISK MANAGEMENT A loss of the $0.00000000003200 support area would weaken the current bullish scenario. I will continue monitoring price action, trading volume, liquidity flows, and broader market conditions. No setup is guaranteed, and protecting capital remains essential. 🚀 FINAL THOUGHT I'm already in profit, but I'm still watching $BABYDOGE for a potentially much larger move. The next breakout attempt could be decisive. If technical confirmation aligns with improving market sentiment and stronger demand, the upside opportunity could become significant. The levels are clear. The catalysts are worth watching. Now, the market must confirm the move. 🐶🔥 What's your take on $BABYDOGE? Are we preparing for a major recovery? #WSOT2026 #AnthropicS1Filing #IMPACTbyTrade #MyByXTake
🚀 SPACEXTHREE GROWTH ENGINES, ONE ECOSYSTEM
$SPCXXUSDT is evolving beyond rocket launches into a broader technology ecosystem combining space transportation, satellite connectivity, and AI infrastructure. Its long-term investment thesis rests on three major growth engines. 🏢 1. BUSINESS MODEL & COMPETITIVE ADVANTAGE 🚀 Space Transportation: Falcon 9 reusability helps reduce launch costs and improve efficiency, while Starship could unlock larger payloads and new commercial opportunities. 🛰️ Starlink: Satellite internet generates recurring subscription revenue from consumers, businesses, and government customers, potentially providing a more predictable revenue stream. 🤖 AI Infrastructure: Expansion into AI computing and related services creates additional growth opportunities, although it requires substantial capital investment. 💰 2. FINANCIAL PERFORMANCE The supplied Q3 2026 figures report: • Revenue: $14.6 billion • Revenue growth: 161% YoY • Net income: $4.4 billion • Adjusted EBITDA: $8.8 billion • Adjusted EBITDA growth: 306% If verified, these figures would indicate substantial growth and strong reported profitability. However, free cash flow, capital expenditure, and earnings sustainability remain essential metrics. 🛰️ 3. STARLINK: THE RECURRING REVENUE ENGINE The supplied figures indicate 13.6 million consumer subscribers, $5.248 billion in connectivity revenue, and $2.367 billion in connectivity operating income. Continued subscriber growth, enterprise adoption, and network expansion could strengthen Starlink's position. Investors should monitor subscriber growth, operating margins, and infrastructure costs. 🚀 4. STARSHIP & AI: FUTURE CATALYSTS Starship could expand satellite deployment capacity and enable more ambitious space missions. Meanwhile, AI infrastructure offers exposure to growing computing demand. Both opportunities depend on successful execution, commercial adoption, and sustainable returns on investment. 🌐 5. NETWORK & ECOSYSTEM SpaceX's businesses can reinforce one another: rockets support satellite deployment, Starlink generates recurring revenue, and AI infrastructure introduces another potential growth avenue. This integration could strengthen efficiency and competitive positioning. ⚠️ 6. KEY RISKS 🔻 Heavy capital expenditure. 🔻 Technical setbacks and regulatory challenges. 🔻 Competition across connectivity, launch services, and AI. 🔻 Rising costs and uncertain future returns. 🔻 Overvaluation despite strong business growth. 🎯 FINAL VERDICT: BULLISH GROWTH THESIS 🚀 SpaceX combines reusable launch technology, recurring Starlink revenue, and potential AI expansion. These businesses offer significant long-term opportunities, but execution and financial discipline will determine whether that potential translates into sustainable shareholder value. My outlook: Bullish on the long-term business potential, but valuation remains critical. ⚠️ Verification note: The supplied Q3 2026 financial figures and $SPCX ticker have not been independently verified. Confirm official filings, listing status, and valuation before making investment decisions. #ByXIMPACT #WSOT2026 #AnthropicS1Filing #IMPACTbyTrade


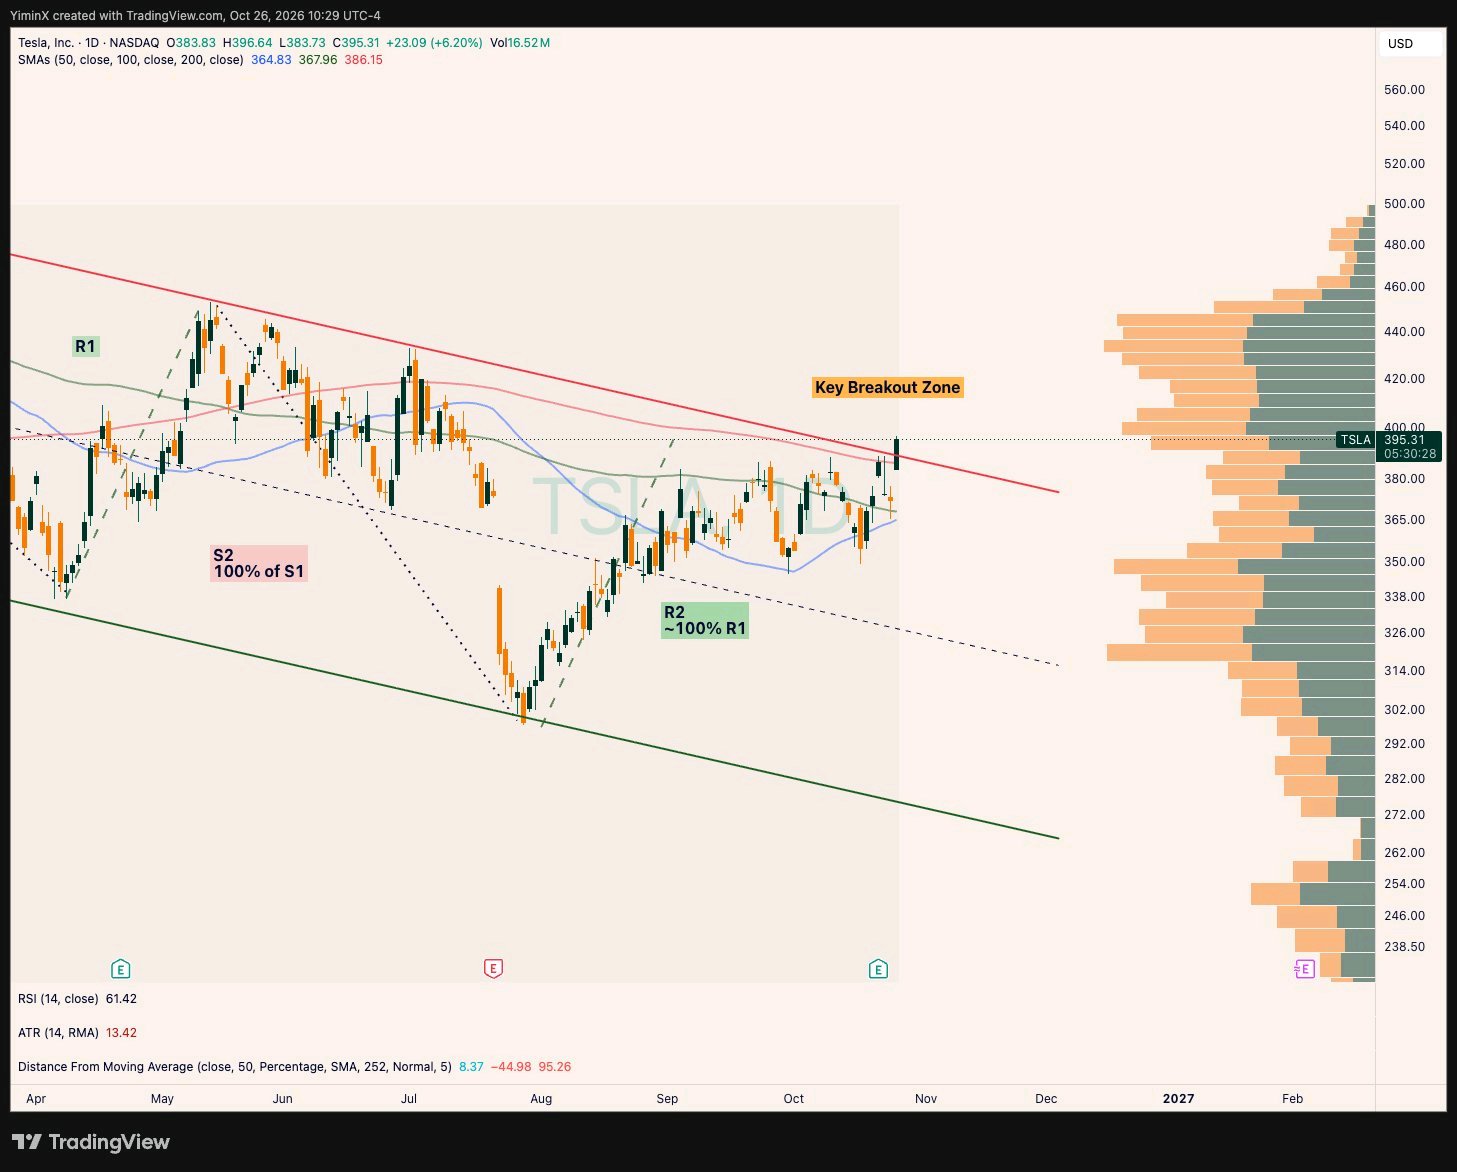
🚀 $TSLA: BREAKOUT MOMENTUM — $450 IN SIGHT?
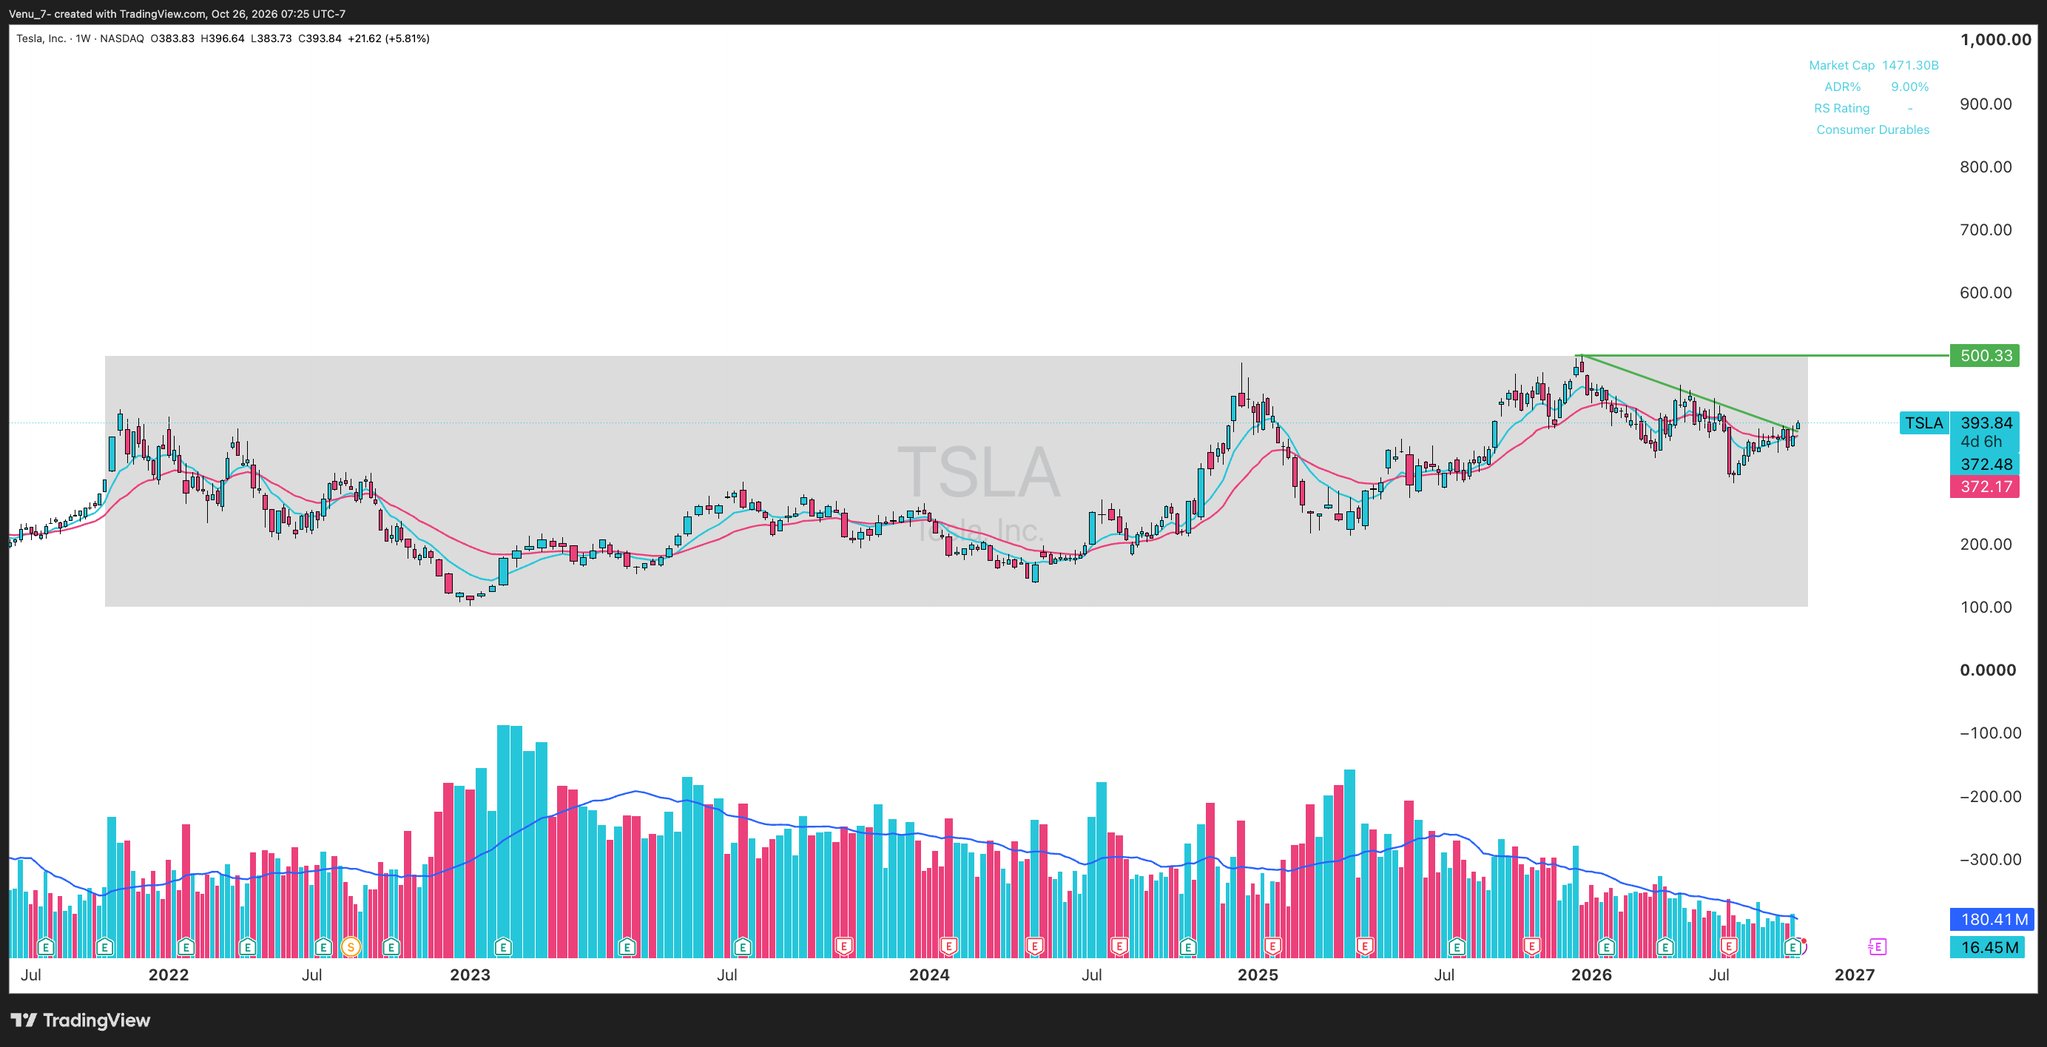
Tesla ($TSLAXUSDT ) is showing impressive relative strength, rallying approximately 6% as it breaks above its multi-month downtrend and reclaims the 200-day Simple Moving Average (SMA). 📊 TECHNICAL OUTLOOK $TSLA has pushed above its descending price-channel resistance, potentially signaling a shift in market structure from bearish to bullish. However, the next major challenge lies within the $400–$450 resistance zone, where a dense volume profile could trigger significant selling pressure and volatility. A sustained breakout above this region, supported by strong volume and continued buying interest, could open the door to further upside toward year-end. 🔥 FUNDAMENTAL CATALYSTS • FSD Monetization: Expanding recurring revenue opportunities through autonomous-driving software. • Robotaxi Expansion: Progress toward autonomous ride-hailing could reshape Tesla's long-term growth outlook. • Energy Storage: Growing demand for battery storage solutions offers another potential revenue driver. • SpaceX Merger Speculation: Market speculation surrounding a potential Tesla–SpaceX combination could influence sentiment, although no confirmed merger should be assumed. 🎯 MY MARKET OUTLOOK Tesla's technical recovery is encouraging, especially given its relative strength during a broader market correction. If the breakout holds and buyers successfully absorb selling pressure between $400 and $450, a year-end move through this resistance zone remains a plausible scenario. ⚠️ KEY RISKS: A failed breakout, weakening market conditions, or rejection at resistance could send the stock back toward lower support levels. FSD adoption, Robotaxi execution, and energy growth also depend on real-world results, regulation, and profitability. Bottom line: $TSLA is regaining bullish momentum, but confirmation above resistance is the key. The next move depends on whether buyers can turn this technical breakout into sustained upside. #ByXIMPACT #WSOT2026 #MyByXTake #IMPACTbyTrade
MICHAEL SAYLOR ON MOVE
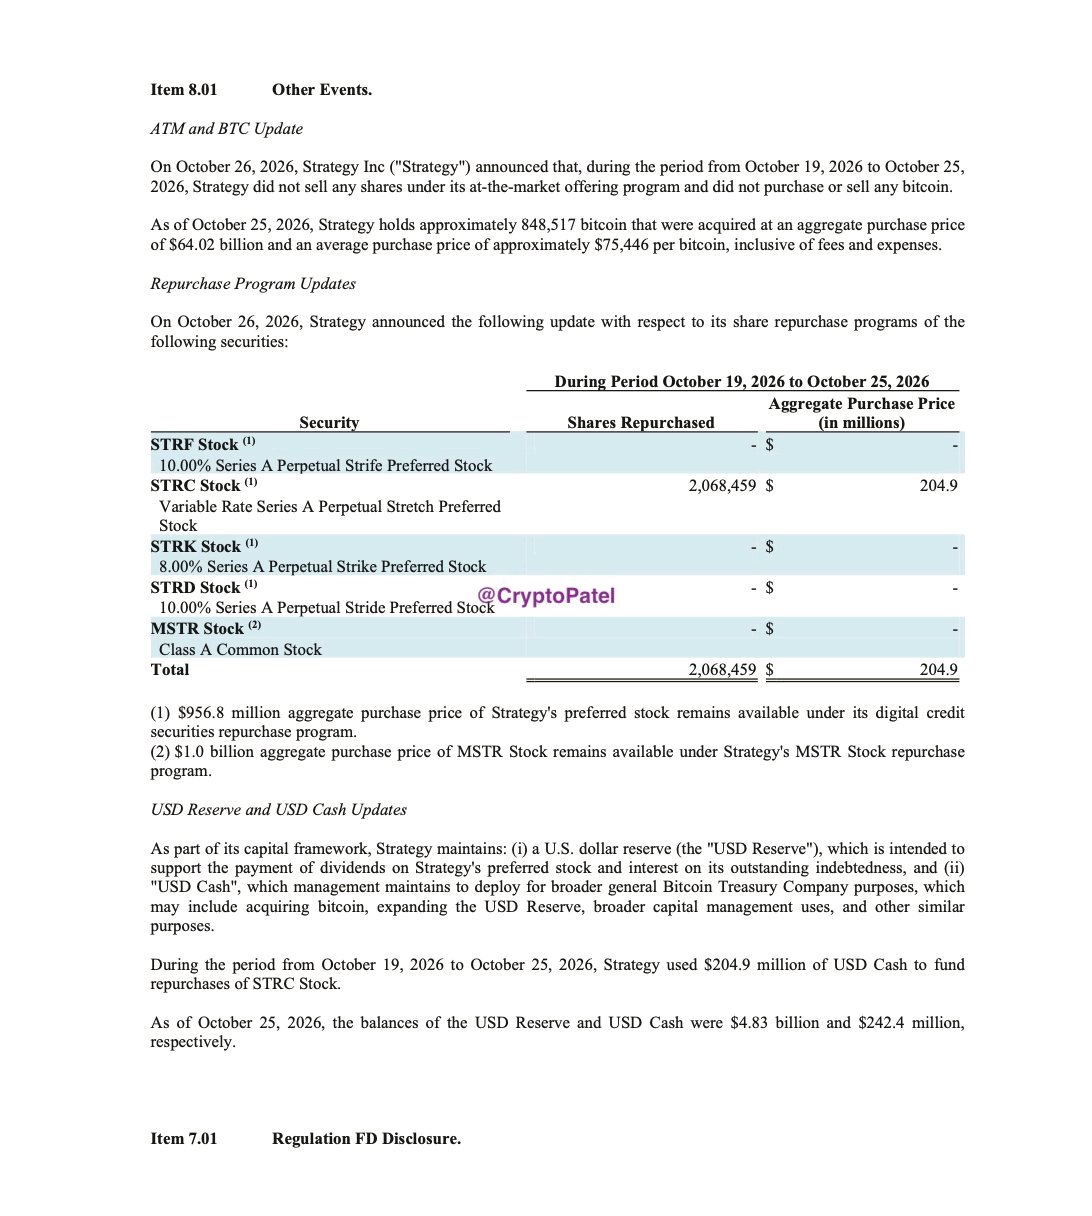
MICHAEL SAYLOR BOUGHT BACK $205M OF $STRC BUT ZERO NEW BITCOIN. Strategy made no $BTCUSDT purchases or sales during October 19–25. Instead, it repurchased 2.07M shares of its $STRC preferred stock for $204.9M. $MSTR BTC holdings: 848,517 BTC Total BTC cost basis: $64.02B USD reserve + cash: ~$5.07B This isn’t an exit from Bitcoin. It’s a capital-allocation shift for one week. Would you rather see Strategy buy more BTC or strengthen its preferred-stock structure? #ByXIMPACT #IMPACTbyTrade #MyByXTake

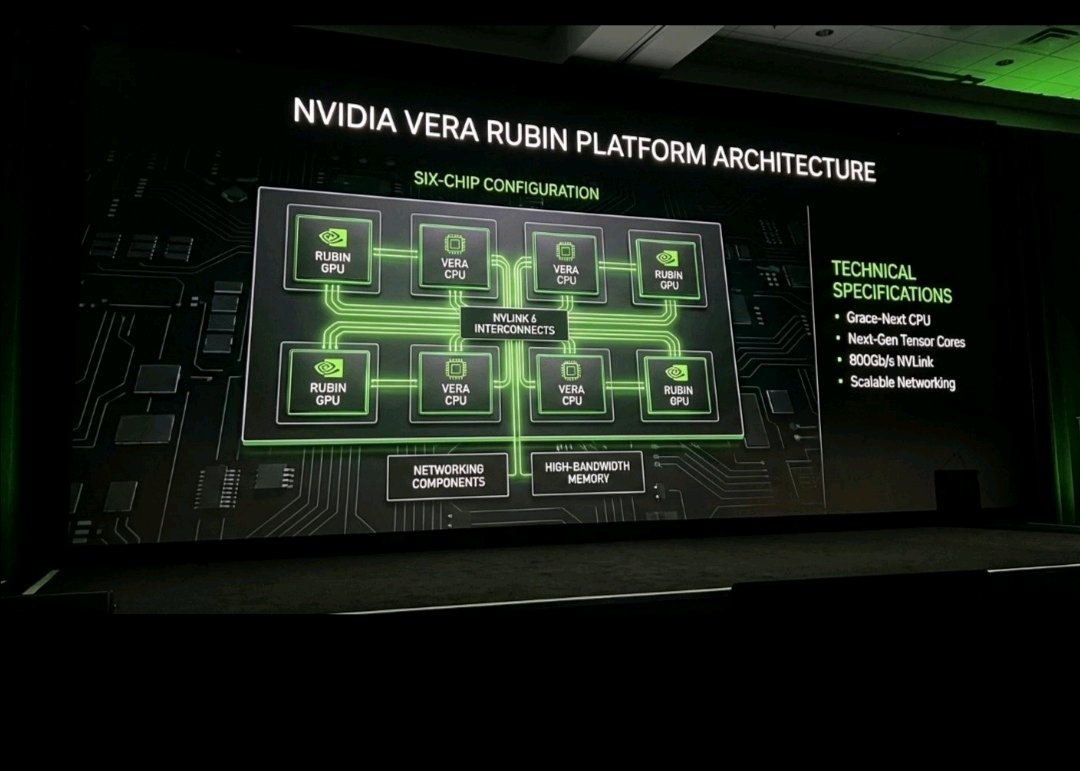
📊 $NVDA: AI DOMINANCE, GROWTH & WHAT'S NEXT?
$NVDAXUSDT continues to strengthen its position at the center of the global AI revolution. But beyond the hype, what do the fundamentals tell us? 👇 💰 1. FINANCIAL PERFORMANCE NVIDIA's latest reported quarterly results showed $96.22B in revenue, representing 106% year-over-year growth. Data center revenue reached $89B, up 117% year over year. These figures highlight strong demand for AI computing infrastructure and NVIDIA's ability to convert that demand into substantial revenue and earnings. 🤖 2. AI DEMAND & GROWTH The expansion of generative AI, cloud computing, and AI-powered applications continues to create opportunities for NVIDIA's GPUs and integrated computing systems. Future growth will depend on sustained customer spending and successful product execution. 🌐 3. NETWORK & ECOSYSTEM NVIDIA's competitive advantage goes beyond chips. Its CUDA software ecosystem, high-speed networking, and integrated AI platforms create value for developers and data-center operators. This combination strengthens customer relationships and makes NVIDIA a major player in the AI infrastructure market. 🚀 4. FUTURE CATALYSTS ▪️ Continued AI infrastructure investment ▪️ Expansion of AI inference workloads ▪️ New computing platforms and product upgrades ▪️ Growing enterprise AI adoption ▪️ Continued demand for advanced networking solutions ⚠️ 5. RISKS TO WATCH Despite its impressive performance, faces valuation pressure, growing competition, potential export restrictions, and the possibility of slower AI spending. Strong earnings do not automatically mean the stock is cheap. Expectations and entry price still matter. 🐂 FUNDAMENTAL OUTLOOK: BULLISH NVIDIA's revenue growth, profitability, and AI ecosystem support a positive long-term business outlook. However, its share-price performance will depend on future earnings, market expectations, and valuation. 📌 MY TAKE: I'm watching for continued fundamental strength, but I won't ignore valuation or downside risk. The goal is to identify sustainable growth—not blindly chase the AI hype. 💬 Do you believe NVIDIA can maintain its AI dominance, or will competition eventually challenge its growths? #AnthropicS1Filing #ByXIMPACT #IMPACTbyTrade
📉 $CORE: Holding Through the Downtrend
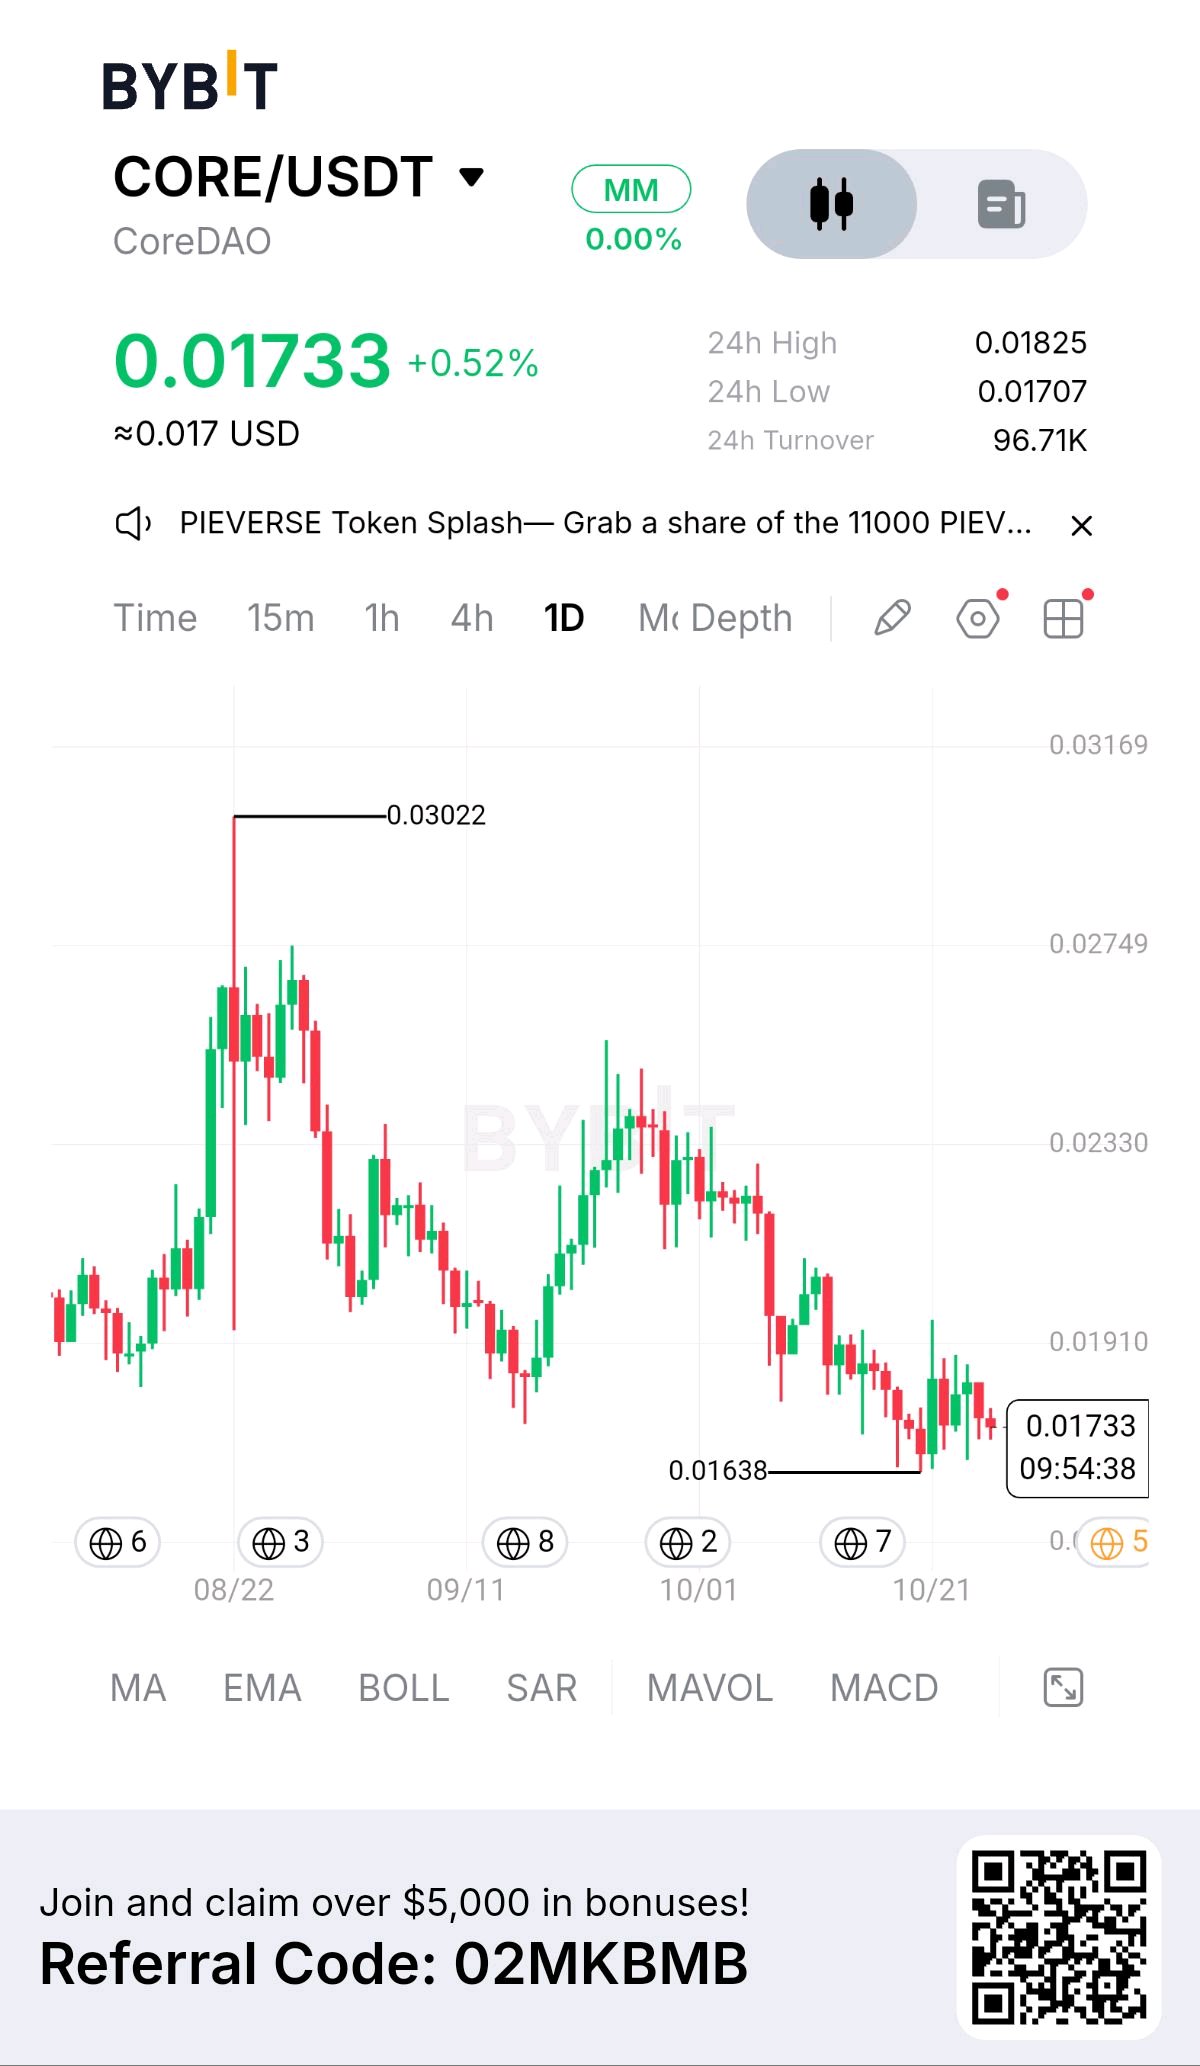
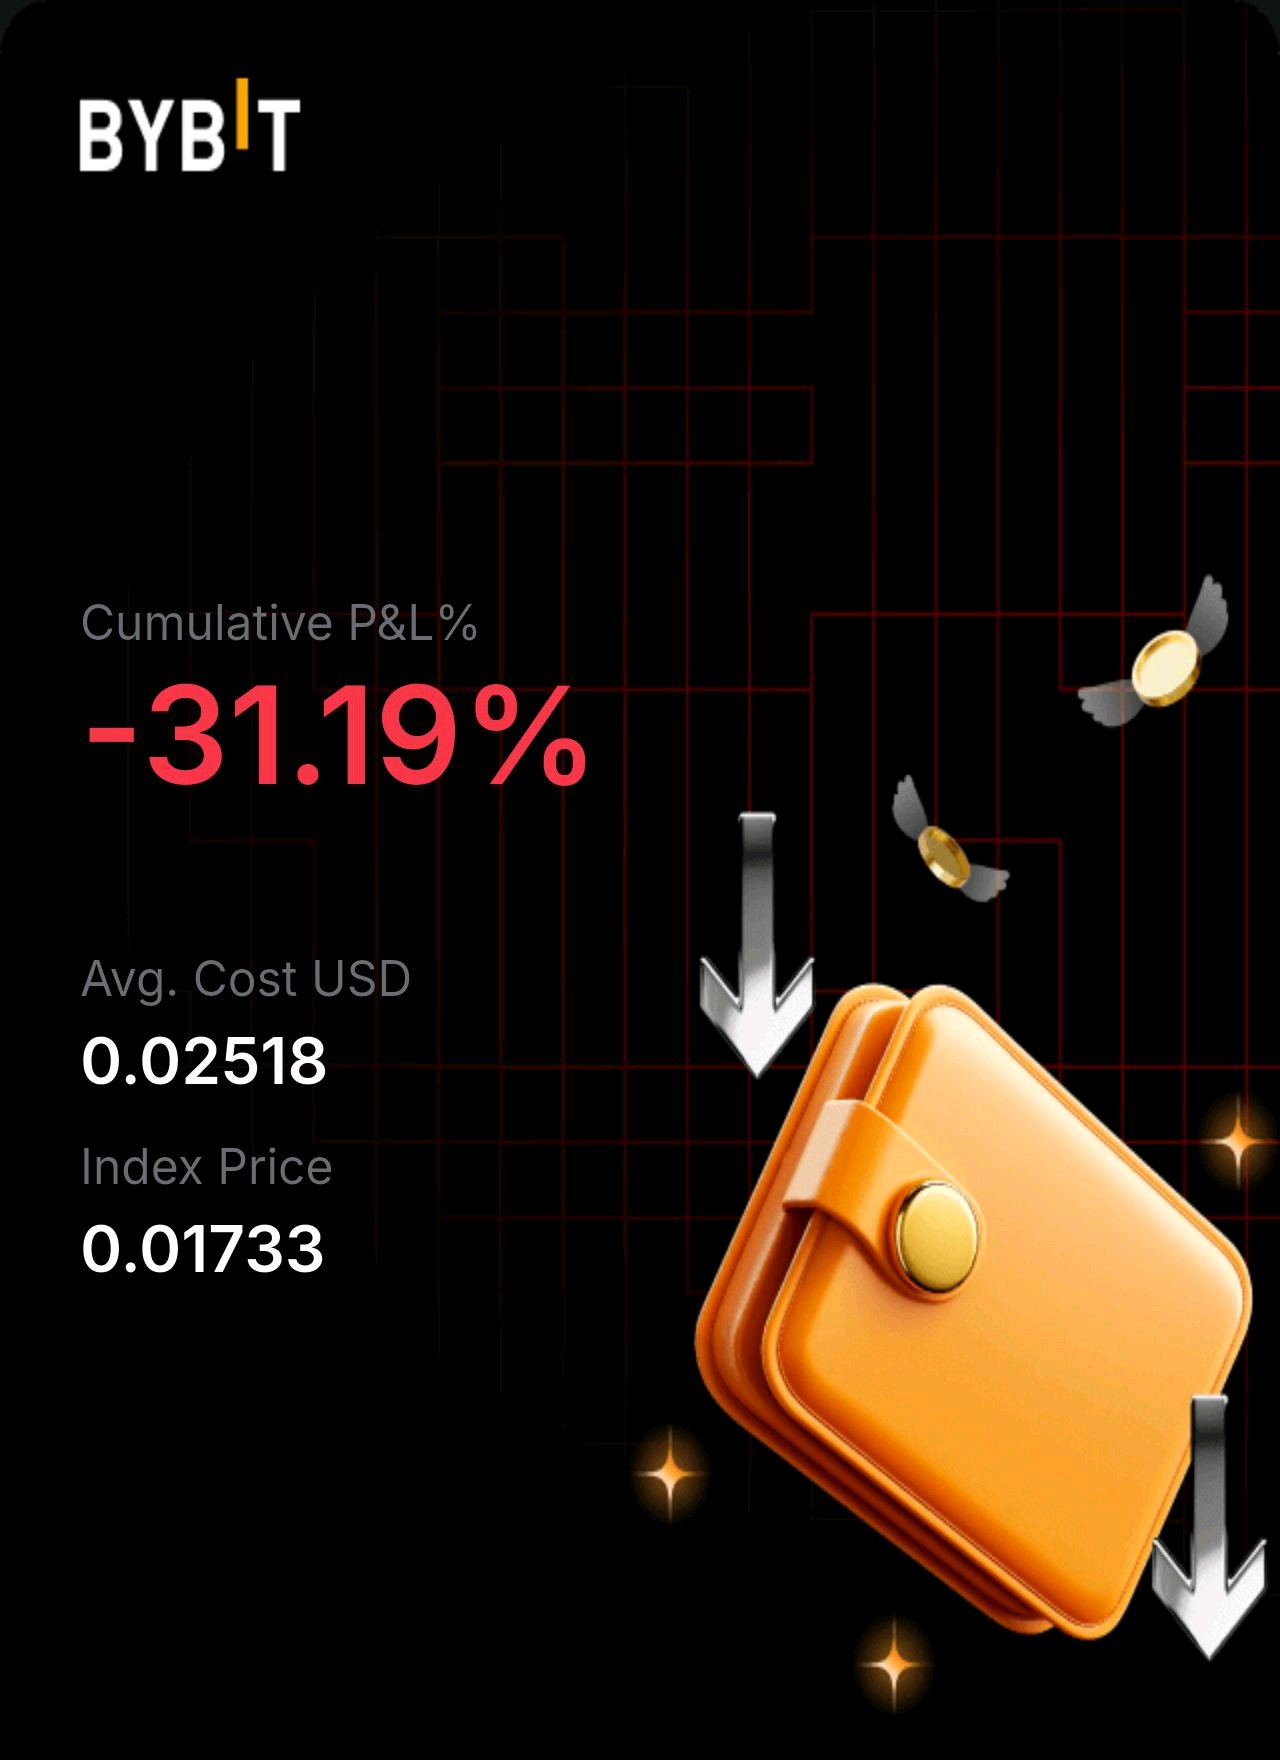
My journey with $COREUSDT has been a test of patience and risk management. I've been holding for a while, with an average entry price of $0.02518. At the current price of $0.01733, my cumulative P&L stands at -31.19%. I'm still watching for a recovery, but I'm combining technical structure with fundamental factors rather than relying on hope alone. 📊 1. TECHNICAL ANALYSIS 🔻 Market Structure: On the daily chart, has been printing a series of lower highs and lower lows, indicating that sellers have maintained control. The recent price action near $0.01638 suggests a potential support zone, but support is not confirmed until buyers demonstrate strength. 🟢 Key Support: $0.01638 A sustained hold above this area could create an opportunity for consolidation and a possible rebound. However, a decisive daily close below it could expose the price to further downside. 🔴 Resistance Zones: • $0.01825 — immediate resistance near the recent 24-hour high. • $0.01910 — an important nearby chart level. • $0.02330 — a stronger resistance zone that buyers would need to challenge if momentum improves. 📈 Bullish Confirmation: I'm watching for a higher low, a break above recent swing highs, stronger buying volume, and a successful retest of broken resistance. Without these signals, any bounce could simply be a temporary relief rally. ⚠️ Bearish Scenario: If it loses $0.01638 with strong selling volume, the current support structure could fail. In that case, protecting capital becomes more important than remaining emotionally attached to an entry price. 🧩 2. FUNDAMENTAL ANALYSIS Core DAO is associated with the Core blockchain ecosystem, which focuses on Bitcoin-aligned security and EVM-compatible smart-contract functionality. The long-term investment case depends on more than price action. Important factors to monitor include: 🔹 Network Adoption: Growth in active users, transactions, developers, and applications could indicate increasing ecosystem activity. 🔹 Bitcoin Integration: Core's Bitcoin-related staking and security model is an important part of its ecosystem thesis. Actual adoption and sustainable participation matter more than the narrative alone. 🔹 Ecosystem Growth: DeFi activity, new applications, partnerships, and meaningful integrations could strengthen demand for the network. 🔹 Token Utility: Sustainable demand depends partly on how CORE is used for network participation, staking, and other protocol functions. 🔹 Tokenomics and Supply: Unlock schedules, circulating supply, emissions, and potential selling pressure deserve close attention. Growing network activity does not automatically translate into higher token prices. 🔹 Capital Flows: I'm also watching exchange inflows and outflows. Rising exchange inflows can increase potential sell-side supply, while sustained outflows may indicate accumulation—but neither signal is conclusive on its own. 📉 3. MY POSITION AND RECOVERY PLAN Average entry: $0.02518 Current reference price: $0.01733 Unrealized P&L: -31.19% For the price to return from $0.01733 to $0.02518, it would need to rise approximately 45.3%, assuming these prices remain the relevant comparison and excluding fees. That is a significant recovery requirement, so I'm not treating a return to my entry price as guaranteed. My approach is to monitor support, volume, market structure, Bitcoin's direction, and fundamental developments before making further decisions. I also want to avoid adding more capital simply to lower my average entry. 🎯 MY FINAL OUTLOOK I'm still holding #ByXIMPACT and remain hopeful, but I'm realistic about the risks. The daily chart currently reflects a broader downtrend, and the $0.01638 area is an important level to watch. A convincing recovery would require buyers to regain control and the ecosystem to demonstrate sustainable progress. Until then, patience must go hand in hand with risk management. Sometimes the biggest lesson isn't how quickly we recover a loss, but how much better we become at managing the next decision. 💬 CORE HOLDERS: Are you accumulating at these levels, waiting for a confirmed reversal, or reconsidering your position? #WSOT2026 #AnthropicS1Filing #MyByXTake
the story becomes much clearer.
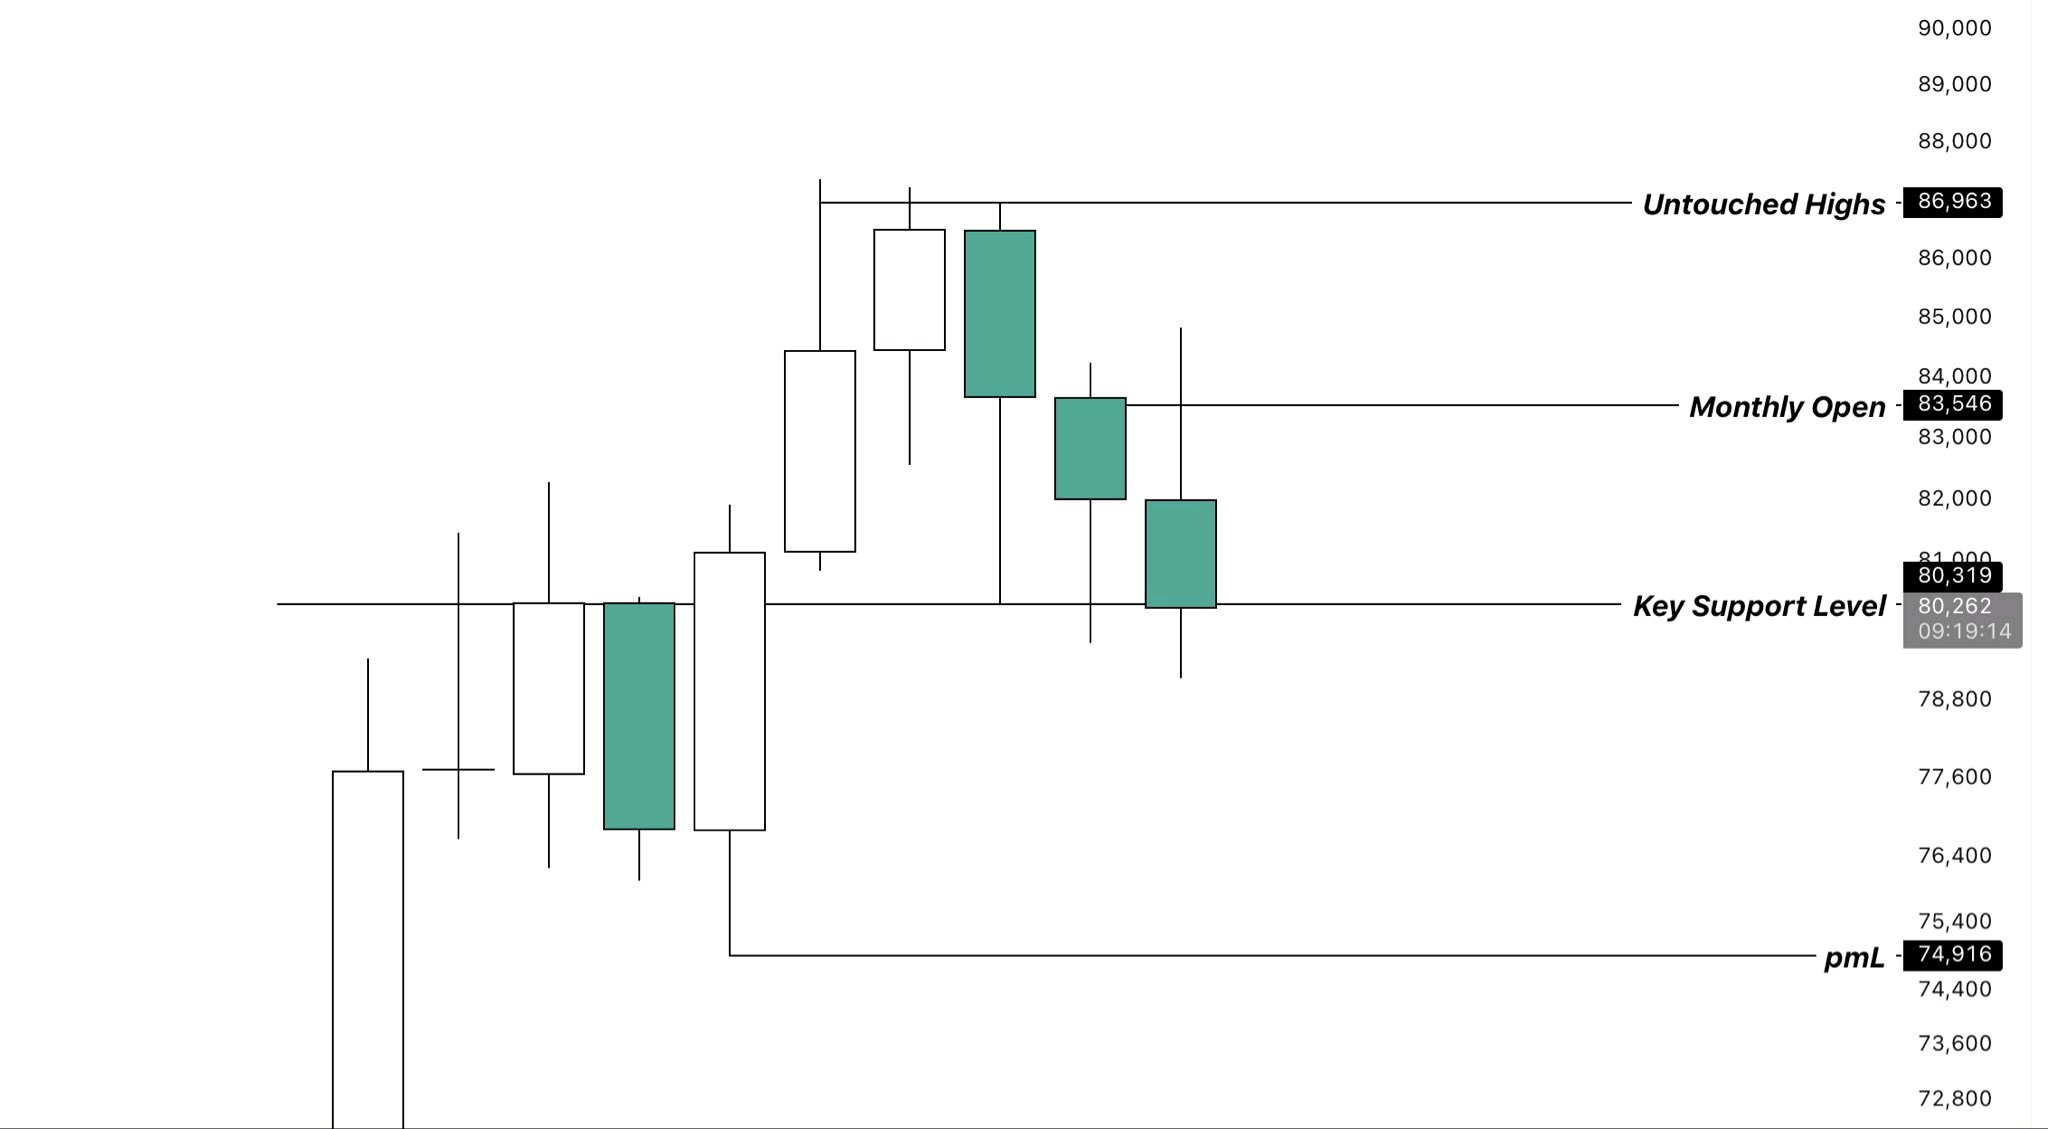
$BTCUSDT Price first rejected the yearly open region around $87k, leaving behind a few unswept highs. Since then, price has sold off into the $80k region, where we have found support and seen multiple sweeps of the lows. For a move back towards those unswept highs, price now needs to reclaim our mid range S/R level at $82.9k-$83.5k. If, on the other hand, we lose our key support level, a deeper pullback towards the highly anticipated lows around $75k becomes possible. #ByXIMPACT #MyByXTake #FOMCRateDecision
🔥 213,000 people liquidated 800 million,
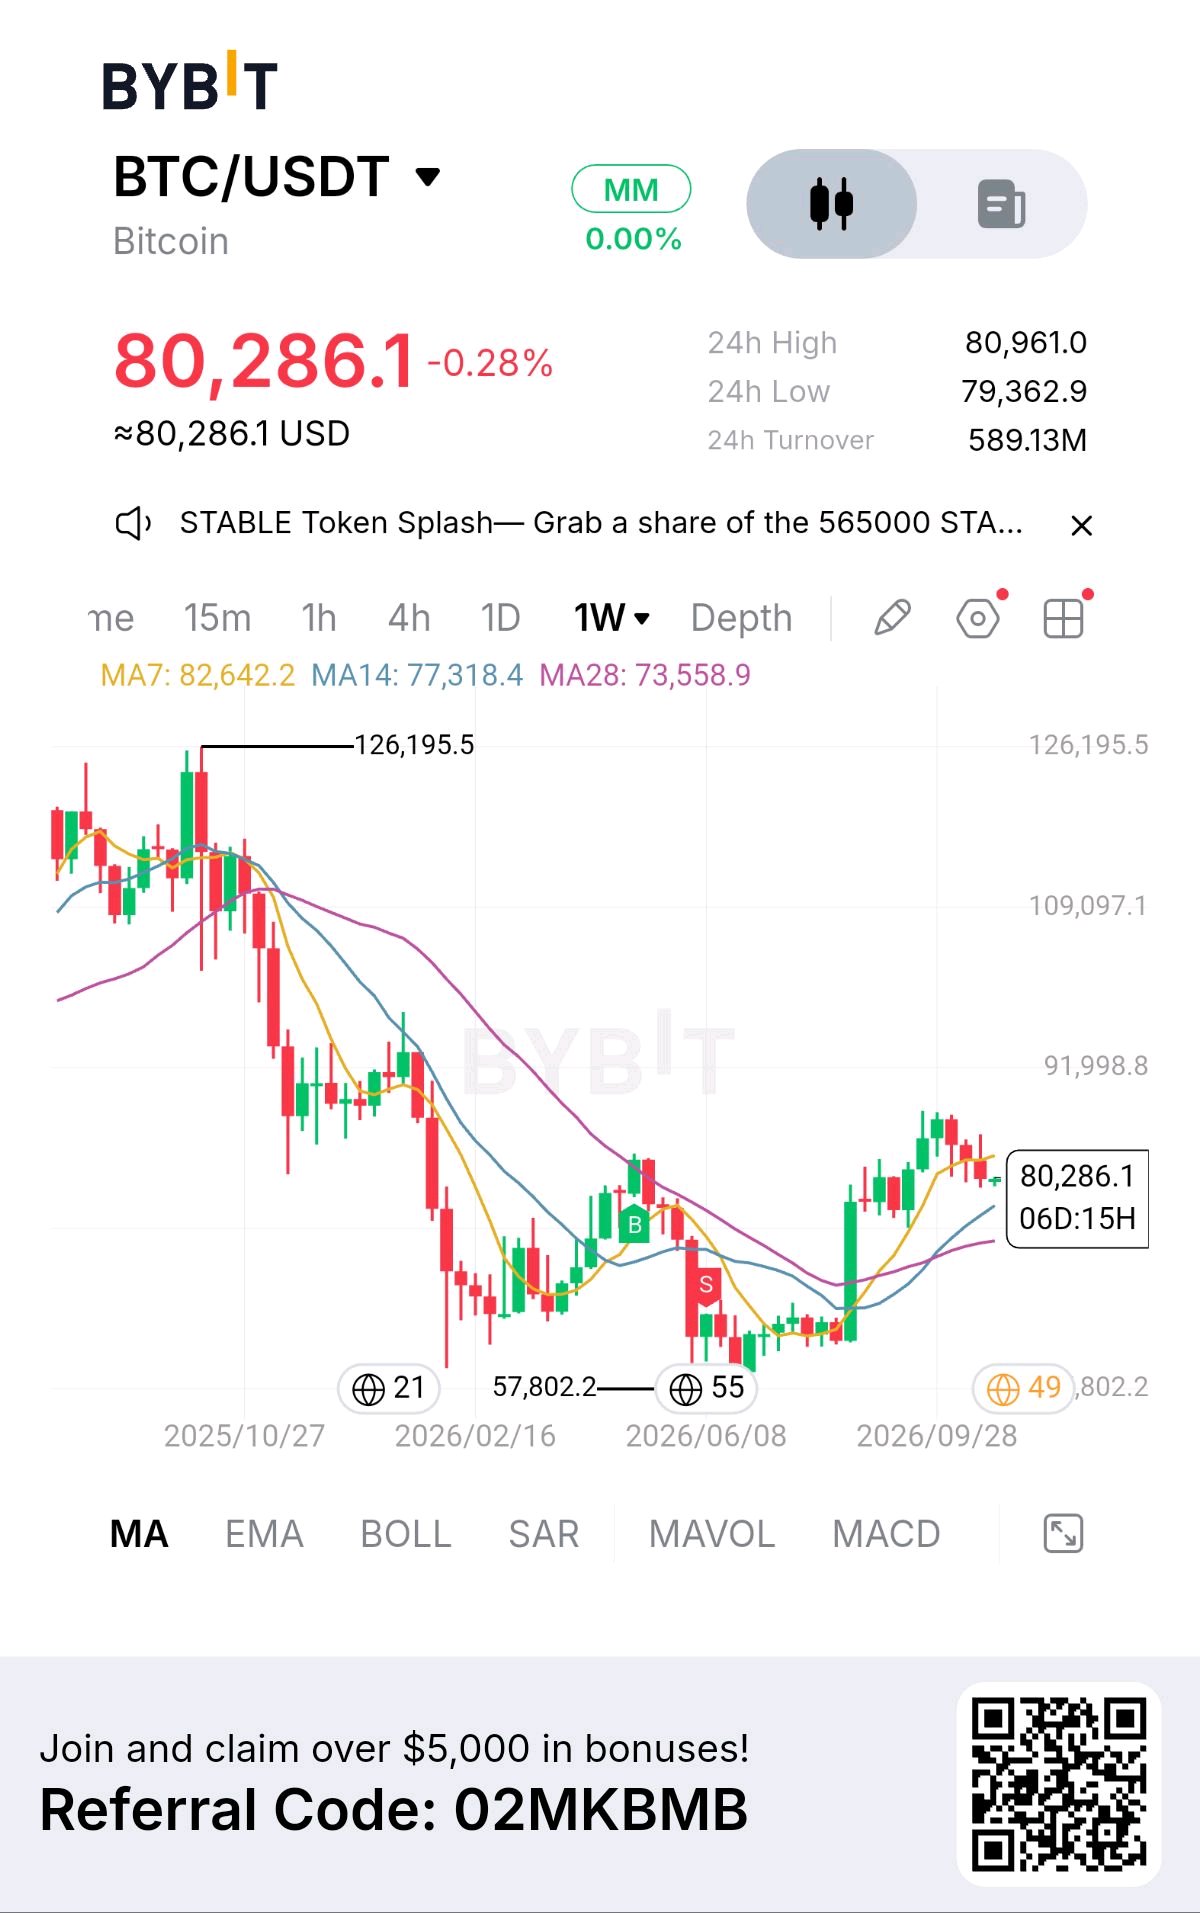
a whale opened a long position of 37.8 million on ZEC! In the past 24 hours, about 800 million USD was liquidated across the entire network, with$BTCUSDT liquidations totaling 235 million, over 213,000 people forcibly closed, most of them long positions. BTC once dropped to 79,277,$ETHUSDT fell below 2300, and SOL dropped below 100. On October 22, the spot Bitcoin ETF saw a single-day net outflow of 635.6 million, the largest since June, with a two-day cumulative outflow of 774 million, offsetting more than 70% of the previous 1.07 billion net inflow. But at the same time, on-chain data shows two 10x long positions totaling 29,798 ZEC were opened within 15 hours, with a nominal value of about 37.57 million USD. Since the launch of the Grayscale spot ETF, ZEC has still surged by 2,076% cumulatively. Retail investors are being liquidated, ETFs are withdrawing, whales are going long. These three things happening simultaneously indicate that the current market has no "consensus direction," only funds at different time dimensions are battling each other. Every candlestick you chase is gambling against an opponent on another cycle. #ByXIMPACT #MidtermsMarketWatch #FOMCRateDecision

ETHEREUM: The Settlement Layer Behind the On-Chain Economy ⚡ $ETHUSDT is no longer simply a blockchain competing for users. It is increasingly positioning itself as a global settlement and financial infrastructure layer for DeFi, stablecoins, tokenized assets, payments and Layer-2 networks. And the fundamentals are increasingly centered around one question: Can Ethereum become the base infrastructure for a large percentage of the world's on-chain economy? Here are the key fundamentals: • ~120M+ ETH — total supply • ~30% — ETH supply currently staked • ~95% — Ethereum transactions processed through L2s • ETH — native asset used for gas and network security • EIP-1559 — burns part of transaction fees • Millions — ETH holders participating in the ecosystem • 2026 — continued focus on scaling, blobs and UX The most important fundamental isn't simply Ethereum's transaction count. It is the economic role ETH plays throughout the network. ETH is required to pay transaction fees, is used to secure Ethereum through staking, and functions as the primary native asset across a massive ecosystem of decentralized applications. That creates a fundamental relationship: More Ethereum activity → greater demand for blockspace → more ETH required for settlement and fees. But Ethereum's architecture has changed significantly. Instead of requiring every transaction to occur directly on Layer-1, Ethereum is increasingly using Layer-2 networks to execute transactions while Ethereum provides settlement and data availability. This has dramatically improved scalability. Ethereum's scaling roadmap has focused heavily on increasing blob capacity, allowing rollups to publish data more efficiently and reducing their transaction costs. That creates another fundamental chain: More L2 adoption → more rollup activity → greater demand for Ethereum data availability → stronger role for Ethereum as the settlement layer. And the potential market is enormous. Stablecoins are increasingly used for payments and settlement. DeFi protocols use Ethereum infrastructure for lending, trading and collateral. Tokenization brings traditional assets such as funds, securities and real-world assets onto blockchain rails. The fundamental chain becomes: Stablecoins → DeFi → Tokenization → L2s → Ethereum settlement → ETH. ETH also has an important supply mechanism. Under EIP-1559, a portion of transaction fees is burned permanently. At periods of high network activity, ETH burned can become large enough to offset newly issued ETH, creating periods of reduced or even negative net supply growth. However, this is where the fundamental analysis becomes more nuanced. Ethereum's scaling strategy has also reduced Layer-1 fees dramatically. That's excellent for users and adoption, but it can reduce the amount of ETH burned. So Ethereum faces a unique trade-off: Lower fees → more adoption but potentially: Lower fees → less fee burn → weaker direct monetary value capture. This is one of the most important questions surrounding ETH today. Ethereum can generate enormous economic activity without every dollar of that activity necessarily translating directly into ETH value. The network therefore needs both adoption and sustainable value capture. There are also competitive risks. Solana and other high-performance blockchains are competing for users, developers, stablecoins and DeFi liquidity. Ethereum's multi-layer ecosystem can also introduce additional complexity for users and liquidity. So the fundamental thesis isn't: “Ethereum is popular, therefore ETH will rise.” The deeper thesis is: Ethereum → L2 scaling → stablecoins → DeFi → tokenization → global on-chain settlement. ETH is attempting to become the economic and security asset underneath an increasingly tokenized financial system. L1 → L2s → Stablecoins → DeFi → RWA → Settlement → ETH The real question now is: If Ethereum becomes the settlement infrastructure for a massive global on-chain economy, can ETH capture enough of that economic value to remain one of the most important assets in crypto? 👀 $ETH #ByXIMPACT #GridTrading #EarnOnEveryWave #MRVLEarnings

BITCOIN: Scarcity Is Becoming a Global Monetary Infrastructure Cycle ₿ $BTCUSDT is no longer simply a speculative cryptocurrency. It is increasingly becoming a digital monetary asset and settlement network, supported by a fixed supply, decentralized security, growing institutional access and an increasingly mature financial market around it. And the underlying fundamentals continue to evolve. Here are the key numbers: • 21M BTC — maximum supply • ~20M BTC — already mined • 3.125 BTC — current block subsidy • ~10 minutes — average block time • ~2028 — next expected halving • 14.5M+ BTC — estimated long-term-holder supply • $61.4B — BlackRock IBIT net assets as of Aug. 31, 2026 The most important fundamental is Bitcoin's monetary policy. There is no company deciding to increase the supply when demand rises. Bitcoin's issuance is embedded in its protocol, with the block subsidy cut approximately every four years. The 2024 halving reduced new issuance from 6.25 BTC to 3.125 BTC per block, with another reduction expected around 2028. That creates a simple but powerful fundamental relationship: Fixed maximum supply → declining issuance → increasingly scarce new supply. But scarcity alone isn't enough. Demand is the other side of the equation. And Bitcoin's demand infrastructure has changed significantly. Spot ETFs have created a regulated bridge between traditional capital markets and Bitcoin. BlackRock's IBIT alone held approximately $61.4B in net assets as of August 31, 2026, with more than 734,000 BTC held at the end of Q2 according to its SEC filing. This matters because institutional investors can now gain Bitcoin exposure through familiar financial infrastructure rather than needing to directly manage wallets and private keys. The fundamental chain becomes: Institutional access → larger investor base → greater capital flows → deeper liquidity → stronger Bitcoin demand. Bitcoin's second major fundamental is network security. The Bitcoin blockchain is secured through proof-of-work mining. Miners spend real-world energy and computing resources to validate transactions and protect the network. There is no central company operating the Bitcoin ledger. Instead: Miners → secure blocks → network remains decentralized → Bitcoin maintains its monetary infrastructure. And Bitcoin's long-term-holder supply adds another important dimension. Recent on-chain estimates put long-term-holder balances above 14.5M BTC, representing more than 73% of circulating supply. While these coins are not permanently locked, their concentration among long-term holders can reduce the amount of BTC actively available for immediate selling. That creates another potential supply-demand dynamic: More long-term holding → less liquid supply → greater sensitivity to new demand. The broader fundamental chain is therefore: Fixed supply → declining issuance → institutional adoption → long-term accumulation → growing financial infrastructure → greater competition for available BTC. But there are important risks. Bitcoin remains highly volatile and its fixed supply does not guarantee appreciation. Institutional ETF flows can reverse. Regulatory conditions can change. Macro liquidity can weaken. And after each halving, miners receive fewer BTC per block, making Bitcoin's long-term security increasingly dependent on the value of transaction fees and the market value of BTC. There is also growing competition from other digital assets and traditional stores of value. So the fundamental thesis isn't: “BTC will keep going up.” The deeper thesis is: Fixed supply → declining issuance → institutional access → growing adoption → increasingly scarce liquid supply. Bitcoin is evolving from an experimental digital currency into a globally accessible monetary and settlement network. 21M BTC → Scarcity → Security → Institutional Access → Global Monetary Asset The real question now is: If Bitcoin's supply remains permanently capped while institutional access and global demand continue expanding, how much capital could eventually compete for the remaining liquid BTC? 👀₿ $BTC #ByXIMPACT #GridTrading #EarnOnEveryWave

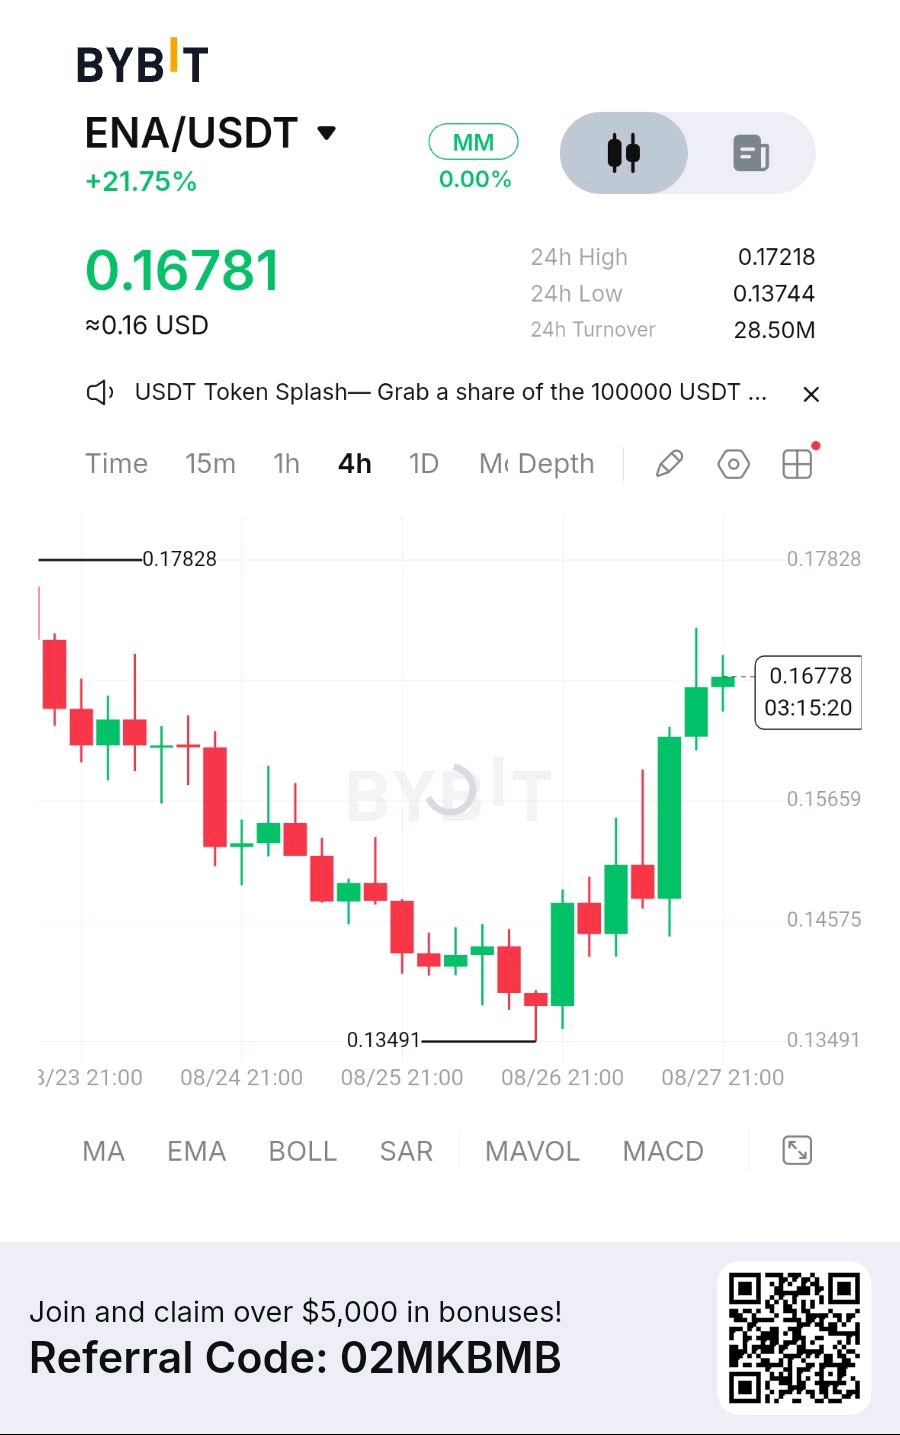
🚨 $ENA IS SHOWING SERIOUS STRENGTH — BUT THE NEXT MOVE MATTERS! 🔥 $ENAUSDT is currently trading around $0.1678, up roughly 21.75% in 24 hours, after making an impressive move from the $0.1349 area to a recent high near $0.1783. The structure remains clearly bullish, with buyers maintaining control and price continuing to trade within an ascending channel. However, after such an aggressive move, ENA is now entering a zone where profit-taking and a short-term pullback would not be surprising. The immediate level I’m watching is $0.1678. As long as ENA holds this area, the bullish structure remains intact and buyers could attempt another push toward the recent high at $0.1783. A clean breakout above $0.1722, ideally accompanied by strong volume, would strengthen the continuation setup and could open the way toward $0.185–$0.190. 🚀 But there’s another side to this setup. ⚠️ ENA has already gained more than 20% in a single day, meaning the market is becoming increasingly vulnerable to profit-taking. If the $0.1678 support fails, momentum could cool rapidly, with $0.1566 becoming the next important support zone. A deeper correction could potentially take price toward $0.1458, particularly if the broader altcoin market also starts losing momentum. Volume is another important factor. ENA has recorded roughly 28.5M USDT in 24-hour turnover, showing that the move has meaningful liquidity behind it. The recent strength may also be receiving additional attention from promotional activity, which means traders should be careful about assuming that every part of the move represents sustainable organic demand. From a technical perspective, the chart is still favoring the bulls, but the risk/reward becomes less attractive when chasing a coin after a +21% daily expansion. I’d rather see ENA either reclaim $0.1722 and break $0.1783 with confirmation, or pull back into a stronger support area and demonstrate that buyers are still defending the trend. 🔥 Bullish scenario: Hold $0.1678 → reclaim $0.1722 → break $0.1783 → target $0.185–$0.190. ⚠️ Bearish scenario: Lose $0.1678 → test $0.1566 → deeper correction toward $0.1458. The trend is bullish, but this is no longer a “chase the candle” setup. The next few reactions around $0.1678–$0.1783 could determine whether ENA is preparing for another expansion or simply cooling down after an explosive move. Watch the levels. Watch the volume. Let price confirm the next move. 🧠📈 #ByXIMPACT
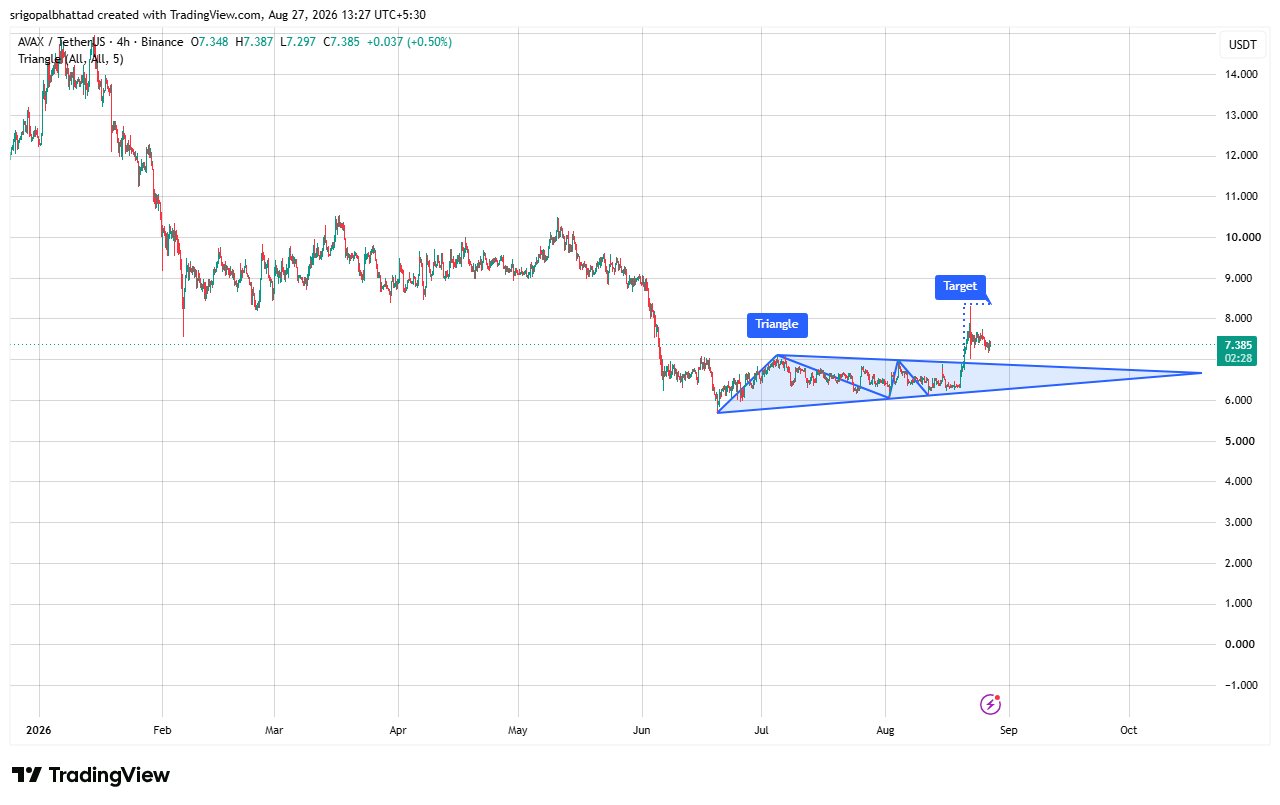
🔵 AVAX/USDT — Triangle Breakout! 🚀 $AVAXUSDT has broken above the triangle’s upper trendline, signaling a potential bullish continuation. 🔹 Current: ~$7.39 🔹 Breakout: ~$7.2–7.4 🔹 Key support: ~$6.0–6.3 🎯 Target: ~$8.5–8.7 ⚠️ Invalidation: Back below the triangle around ~$6.8 A sustained move above the breakout zone could open the way toward the $8.5+ target. 📈🔥 #ByXIMPACT
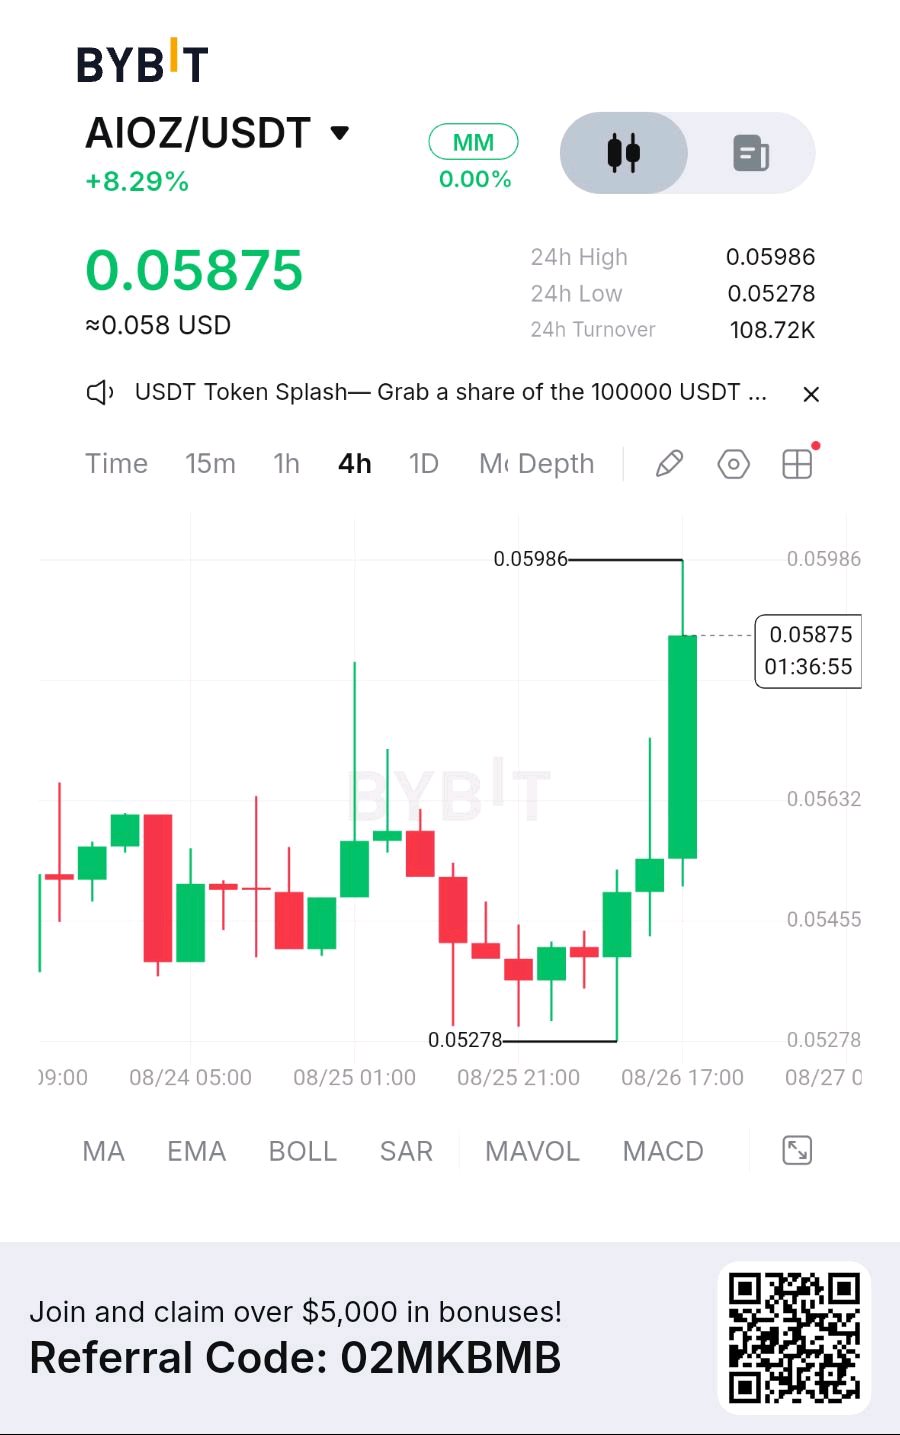
🚀 $AIOZUSDT – STEADY CLIMB +8.29% 🚀 Current price: $0.05875** 24H High: **$0.05986 | 24H Low: $0.05278 Volume: 108.72K USDT (light – caution advised) 📊 CHART SNAPSHOT · Trading just 3% below 24H high – bullish but low volume = fragile · Strong rebound from $0.05278 low (+11% from bottom) · Price coiling near resistance – decision time ahead · MA/EMA sloping up; MACD showing mild bullish momentum 🎯 KEY LEVELS TO WATCH Resistance (sell zones): 🔴 $0.05986 – immediate 24H high 🔴 $0.06100 – next psychological level 🔴 $0.06350 – major resistance if volume surges Support (buy zones): 🟢 $0.05800 – first pullback level 🟢 $0.05650 – mid-range support 🟢 $0.05420 – strong floor 🟢 $0.05278 – 24H low / breakdown alert 📌 TRADING STRATEGY ✅ Breakout play: Enter above **$0.05990** with volume – target $0.0610–0.0635 ✅ Dip buy: Accumulate near $0.0565** or **$0.0542 with tight stops ❌ Avoid: FOMO at $0.05875 without confirmation – low volume = fakeout risk Stop-loss: Below $0.0560 for aggressive longs | Below $0.0525 for conservative ⚠️ CRITICAL WARNINGS · Volume is extremely light (only 108K) – this is a thinly traded alt · Expect slippage and wider spreads – use limit orders only · Low liquidity = pump or dump can happen fast – size down! 💡 MY TA AIOZ is testing the $0.0599 resistance. If volume picks up and it clears, next leg to **$0.063–0.065** is possible. If rejected, expect a dip to $0.0565** or even **$0.054 before the next run. Watch volume like a hawk. No volume = no breakout. #ByXIMPACT