ALCHEMIST
2018Нравится0Акции184Подписчики564Подписаться
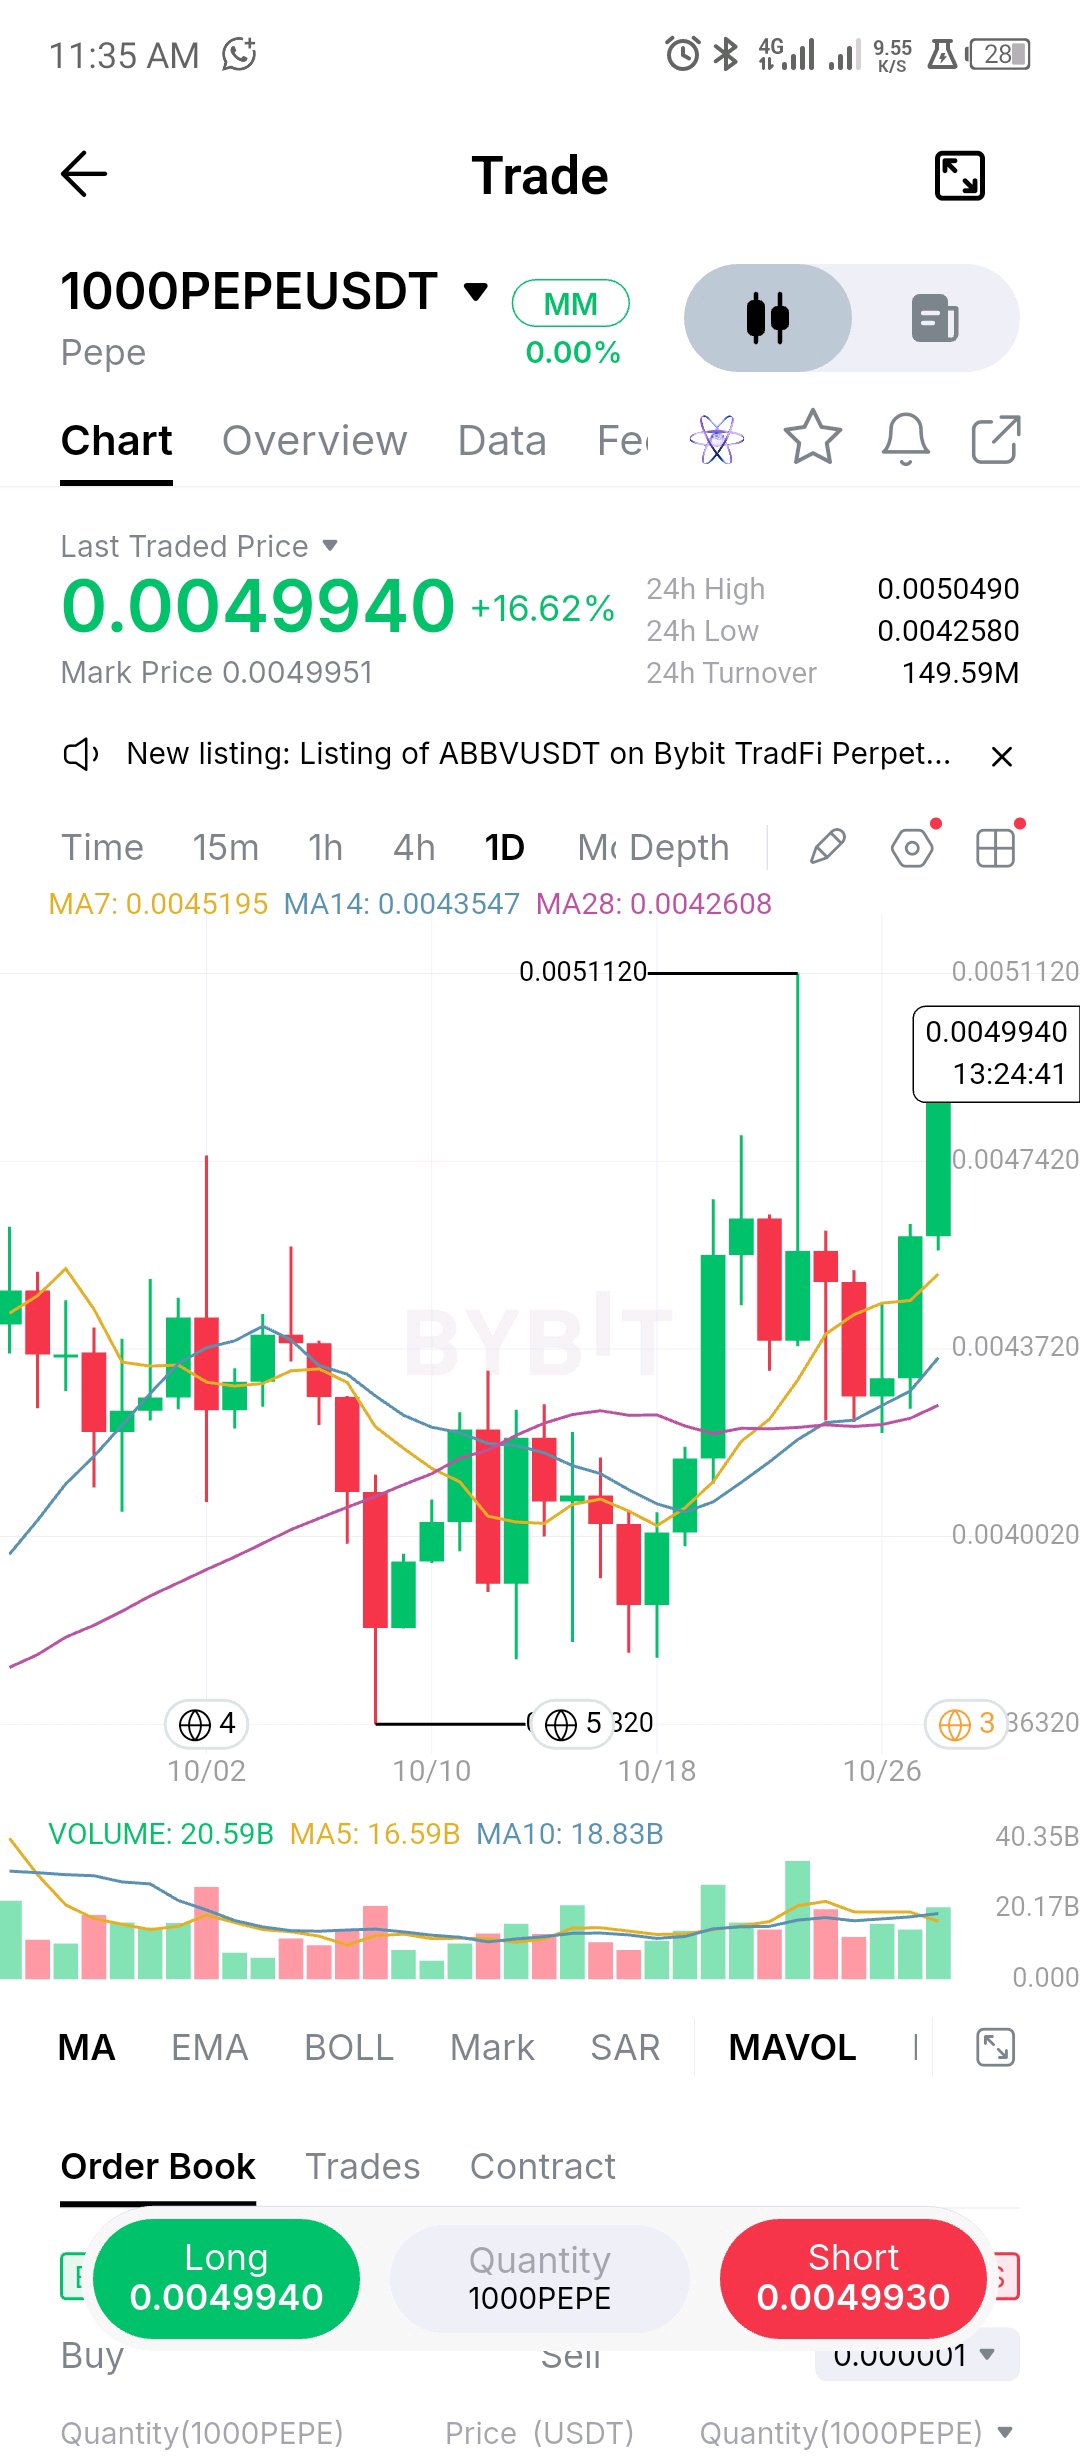
1000PEPE just resolved a long coil to the upside. The 7, 14 and 28 day MAs had flattened into a tight 0.00426-0.00452 band, and price has now moved above all three, up about 17% in 24 hours. Volume is confirming: today's 20.6B is already above both the 5 and 10 day averages with more than half the day left. The test is directly overhead. Price is at 0.00499, just under the 0.00505 24h high and the 0.005112 spike from October 23, which fully reversed. A daily close above 0.00511 would clear that rejection and mark a new high for this view. Failing there again would make this a range-high fade rather than a breakout. On a pullback, 0.00452 (the 7 day MA) is the first level a healthy move should hold, and 0.00426 (28 day MA and the 24h low) is where the breakout thesis breaks. Lows have also stepped up from 0.00363 to roughly 0.00425, which supports the move. Breakouts after +17% days are where chasing gets expensive, so I'd rather wait for a retest or a close above 0.00511. $PEPEUSDT #ByXIMPACT
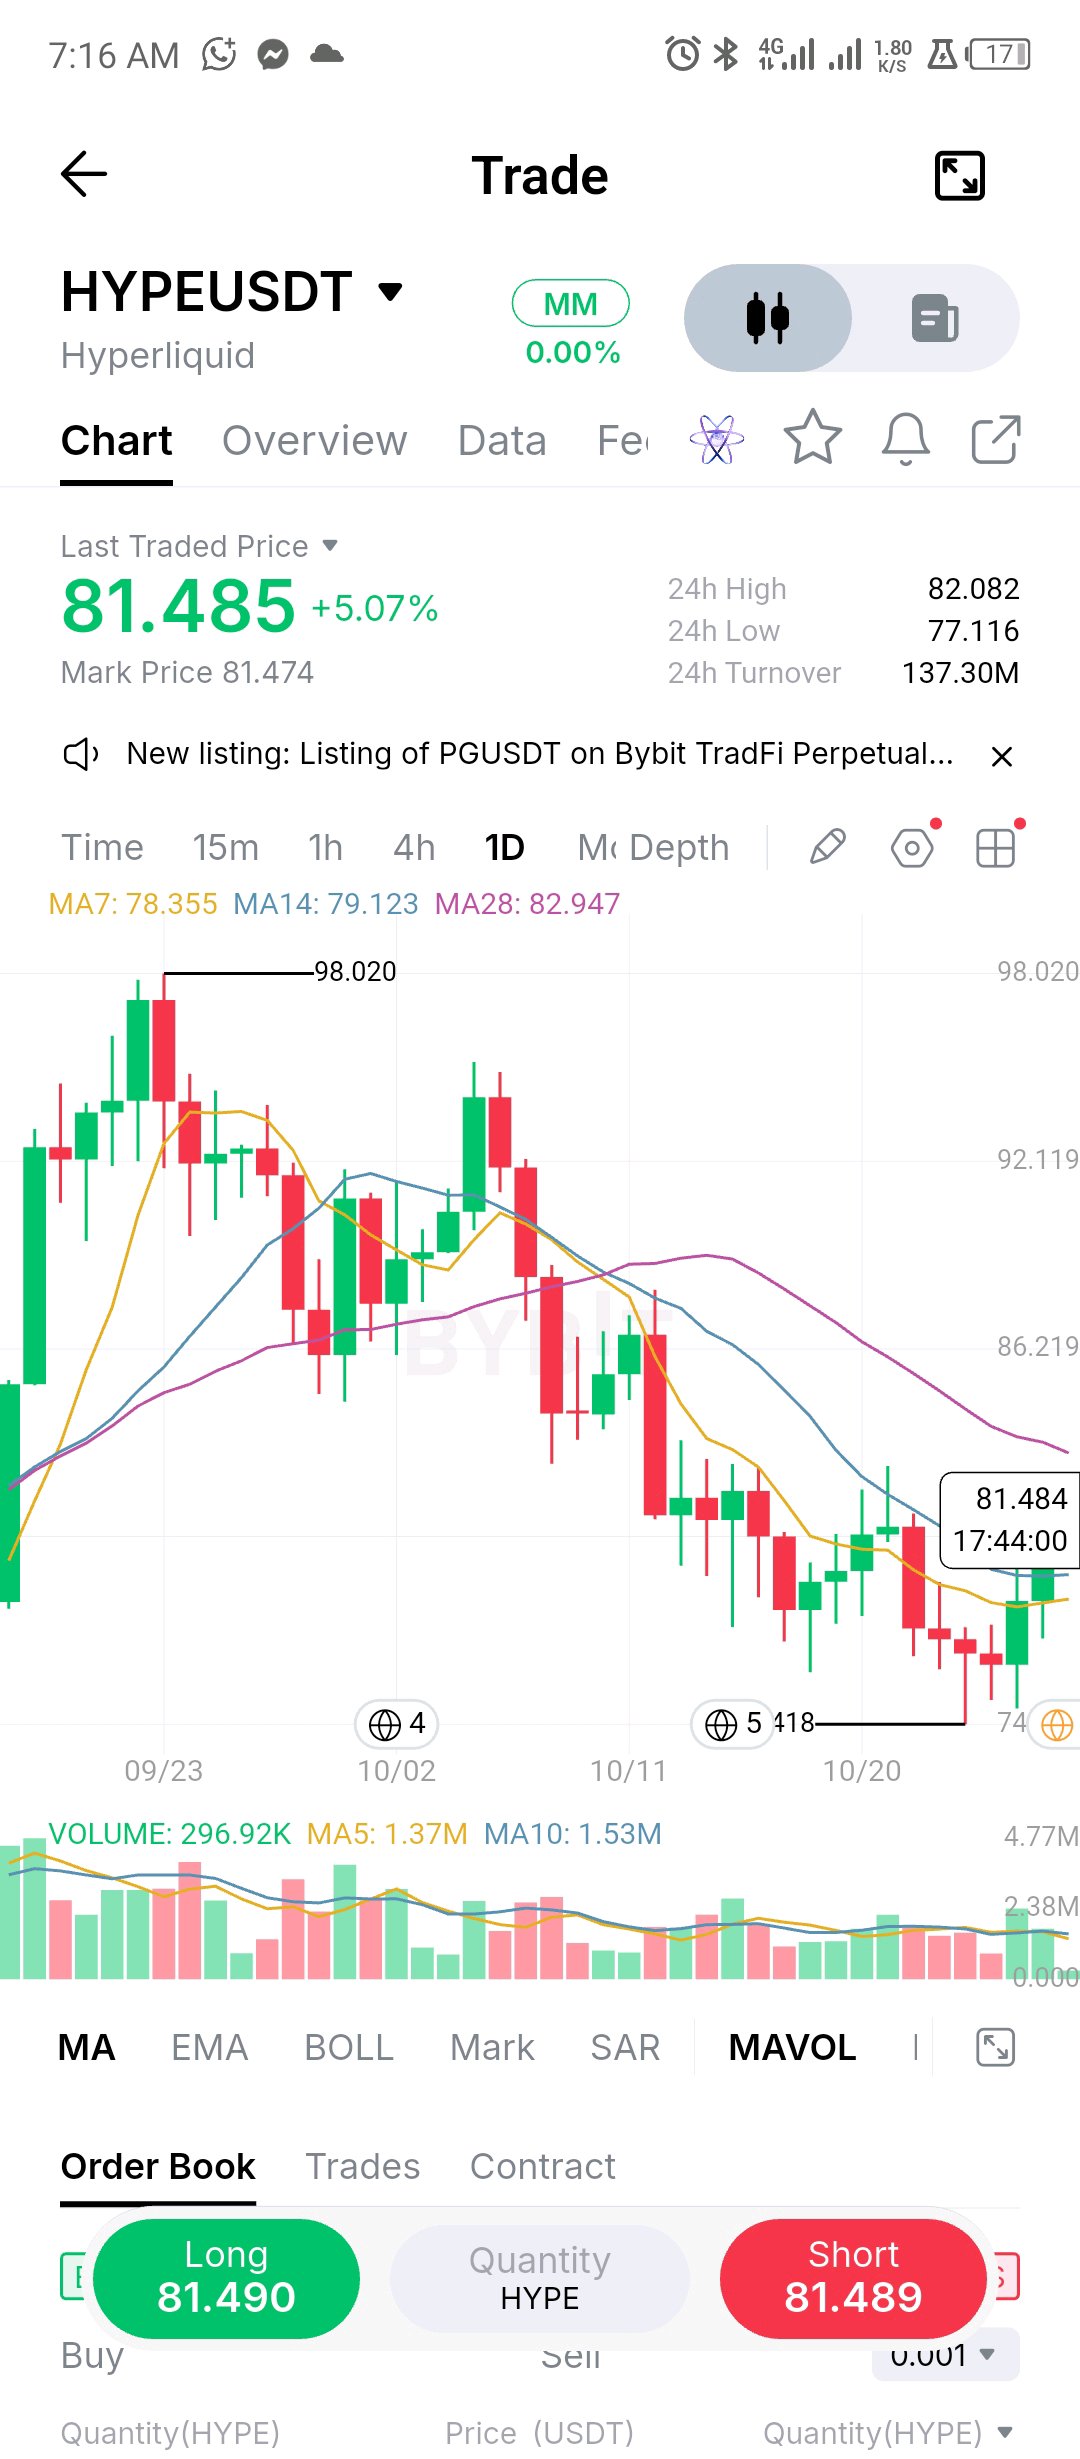
HYPE has bounced almost 10% off the 74.4 flush low, and price is now above both the 7 and 14 day MAs (78.4 and 79.1). That's the first evidence that the 24% slide from 98 is losing momentum. The next test is a stacked one. The 28 day MA at 82.95 sits right beside the 38.2% retrace of the whole drop (83.4), and today's high is 82.1. Three levels inside about 2% of each other is where a bounce either converts or gets sold. Above that, the 86 area where the October breakdown candle began is the bigger target. On the downside, 79 is now support to hold on a close, then today's 77.1 low and the 74.4 flush. Volume has faded through the drop, so this isn't a washout, just a relief rally with room to prove itself. I want a daily close above 83 before I call it a trend change. $HYPEUSDT #ByXIMPACT
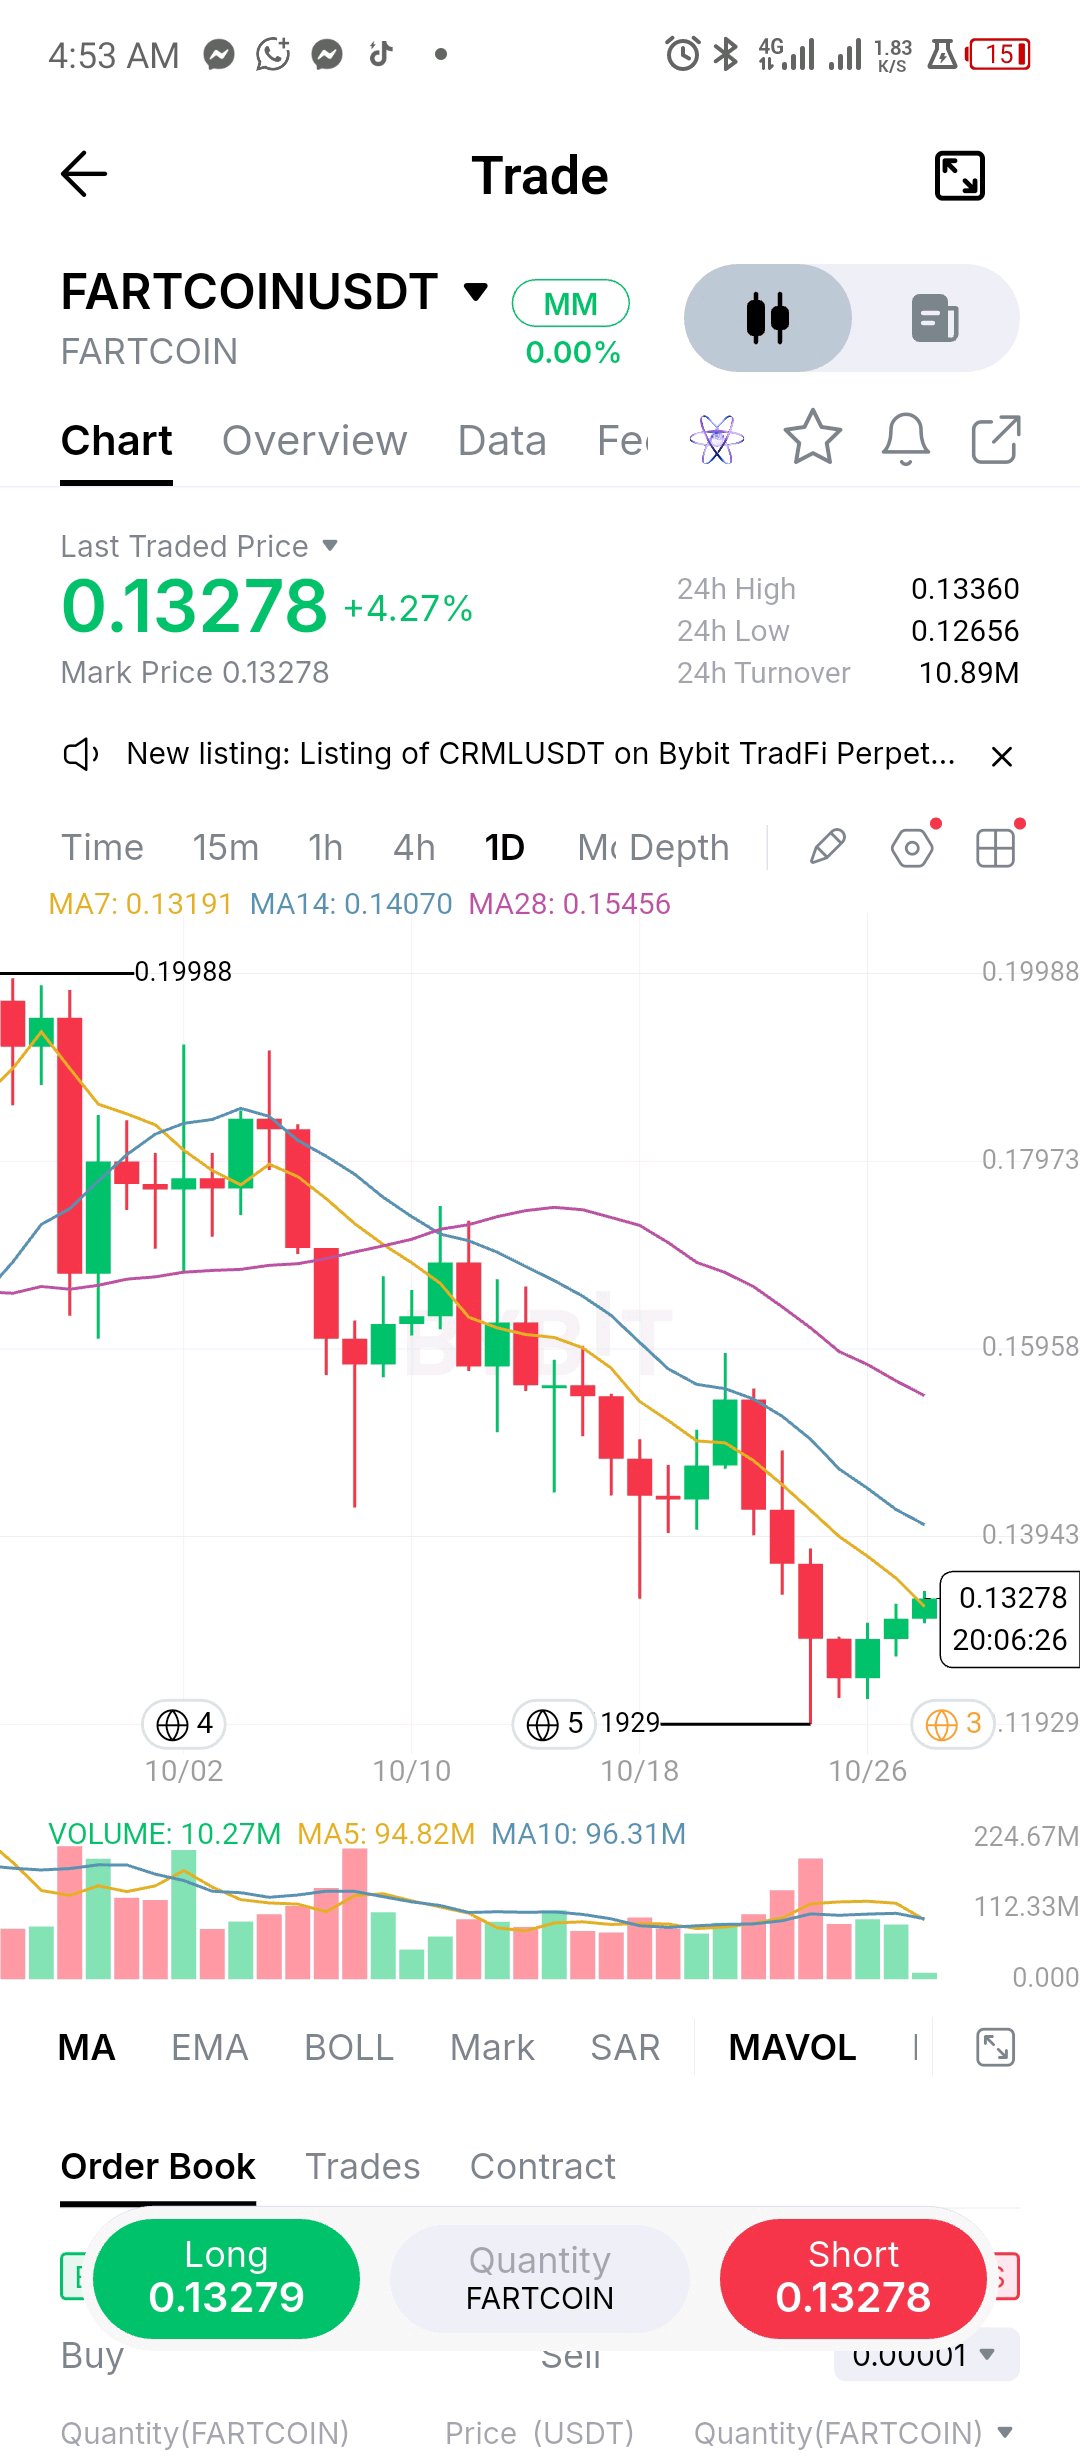
FARTCOIN is down about 40% from the 0.19988 high to the 0.11929 low, and the bounce since is the first thing on this chart that looks different. The flush into 0.119 came on heavy volume, and daily lows have crept higher session after session since. Price has now pushed back above the 7 day MA (0.13191). One reclaim doesn't change the trend. The 14 and 28 day MAs (0.1407 and 0.1546) are still falling and sit about 6% and 16% overhead, and the 0.139-0.140 zone is the first real test. A daily close above 0.1407 would be the first sign the downtrend is stalling. Support is today's 0.1266 low, then the 0.1193 flush low. Lose that and the bounce was just relief. It's a high-beta perp, so I'm keeping size small and letting closes confirming instead of buying the first green candles. $FARTCOINUSDT $FILUSDT #ByXIMPACT
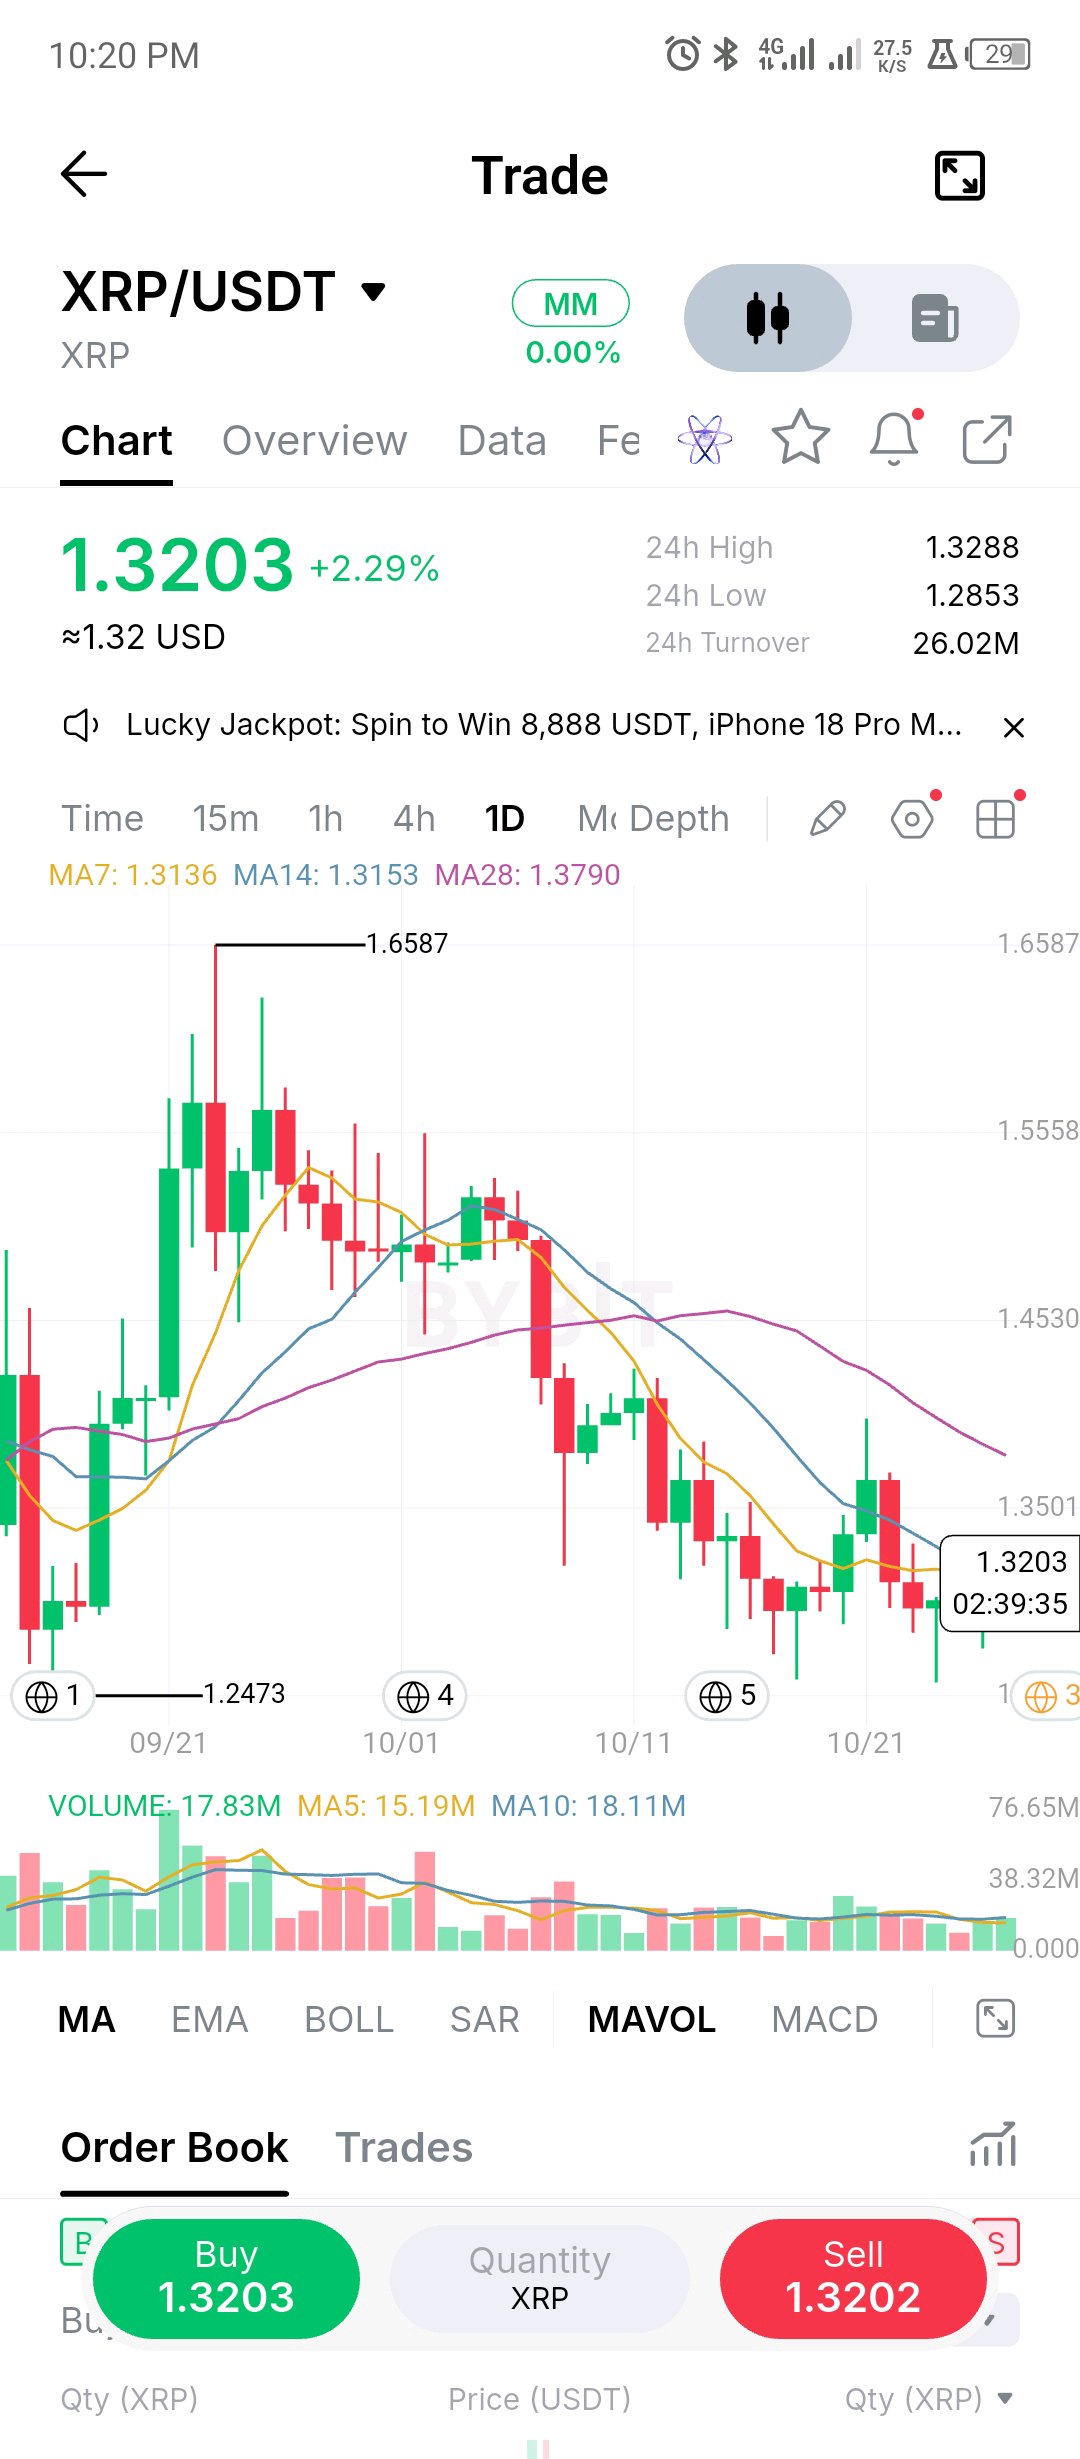
XRP has now tested the 1.25-1.26 area three times, once in September (1.2473) and twice in October, and each time buyers have shown up. Today's +2.3% pushes price back above the 7 and 14 day MAs (1.3136 and 1.3153), which have flattened and are converging right under it. That's a better look than a week ago, but it's still a bounce inside a down-leg. Price has given back about 82% of the run from 1.2473 to 1.6587, and the 28 day MA at 1.379 is still falling. The last rally failed around 1.39-1.40, so 1.38-1.40 is the band that decides whether this is a base or just another lower high. Bulls need a daily close above 1.40 to confirm a higher low. Bears need a close under 1.25, which would break the three-test support and leave no marked support on this chart. Volume on the bounce is average, not strong, so I treat today as a first step rather than a signal. $XRPUSDT #ByXIMPACT
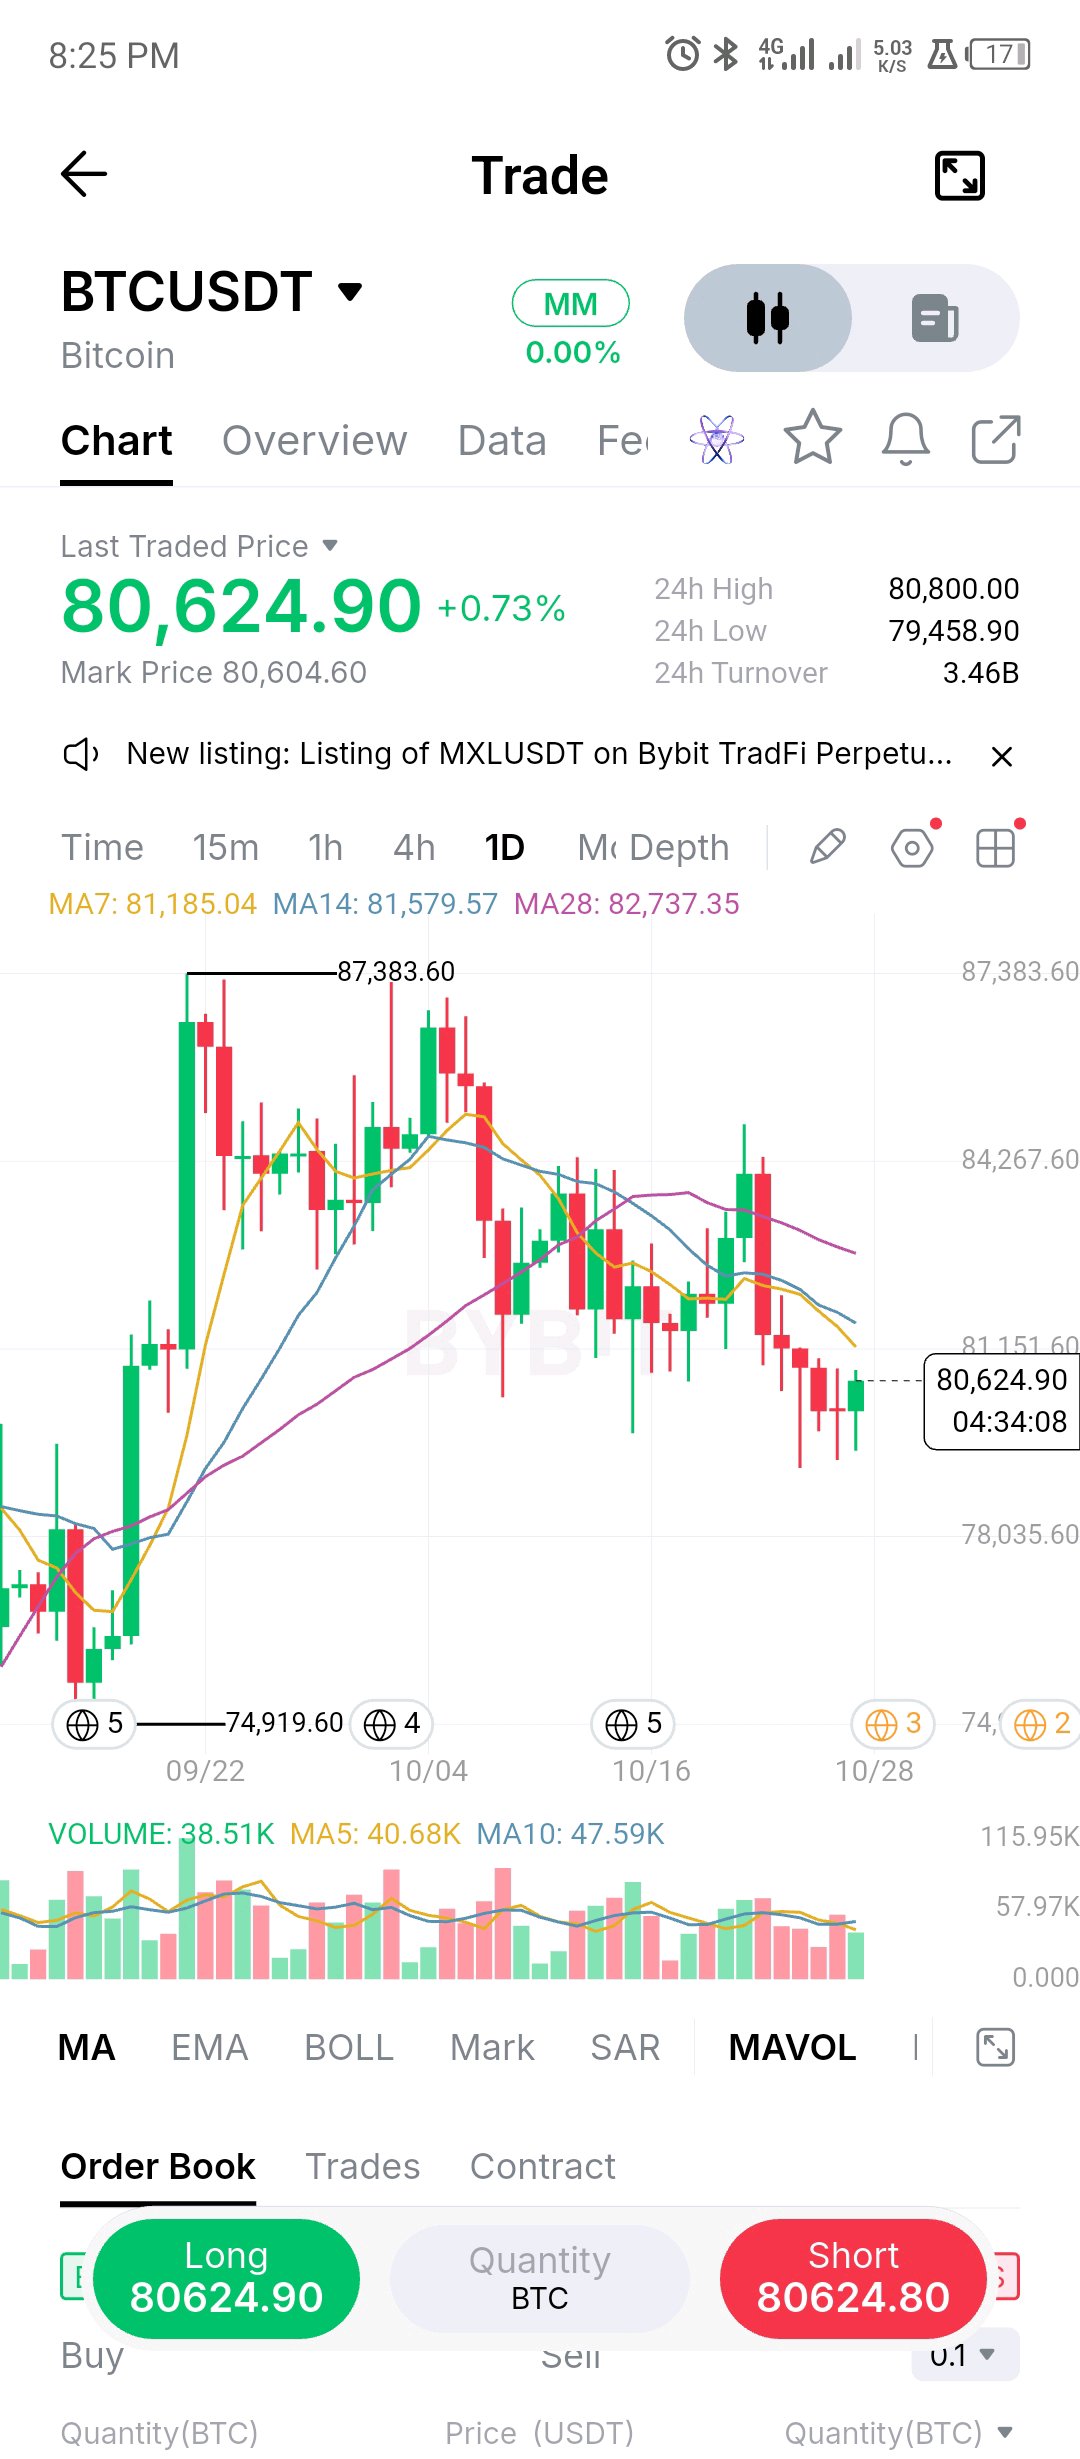
BTC is sitting just under the midpoint of its entire 74.9k to 87.4k range (81,152), and the midpoint isn't alone: the 7 and 14 day MAs are at 81.2k and 81.6k, right on top of it. That's a thick ceiling, and price hasn't been able to close back above it. Highs have stepped down from 87.4k to roughly 84.8k to today's 80.8k, while the floor around 79.2-79.5k has been tested several times in the last week. Volume is drifting lower through all of it, with the 5 day average under the 10 day, so neither side is committing. Bulls need a daily close above 81.6k to take back the MAs, with the 28 day at 82.7k and the 84-85k swing high behind it. Bears need a close under 79.2k, which exposes 78k and then the September low at 74.9k. Compression at a confluence like this usually resolves with a bigger candle than the last few, so I'm not trying to front-run it. $BTCUSDT #ByXIMPACT
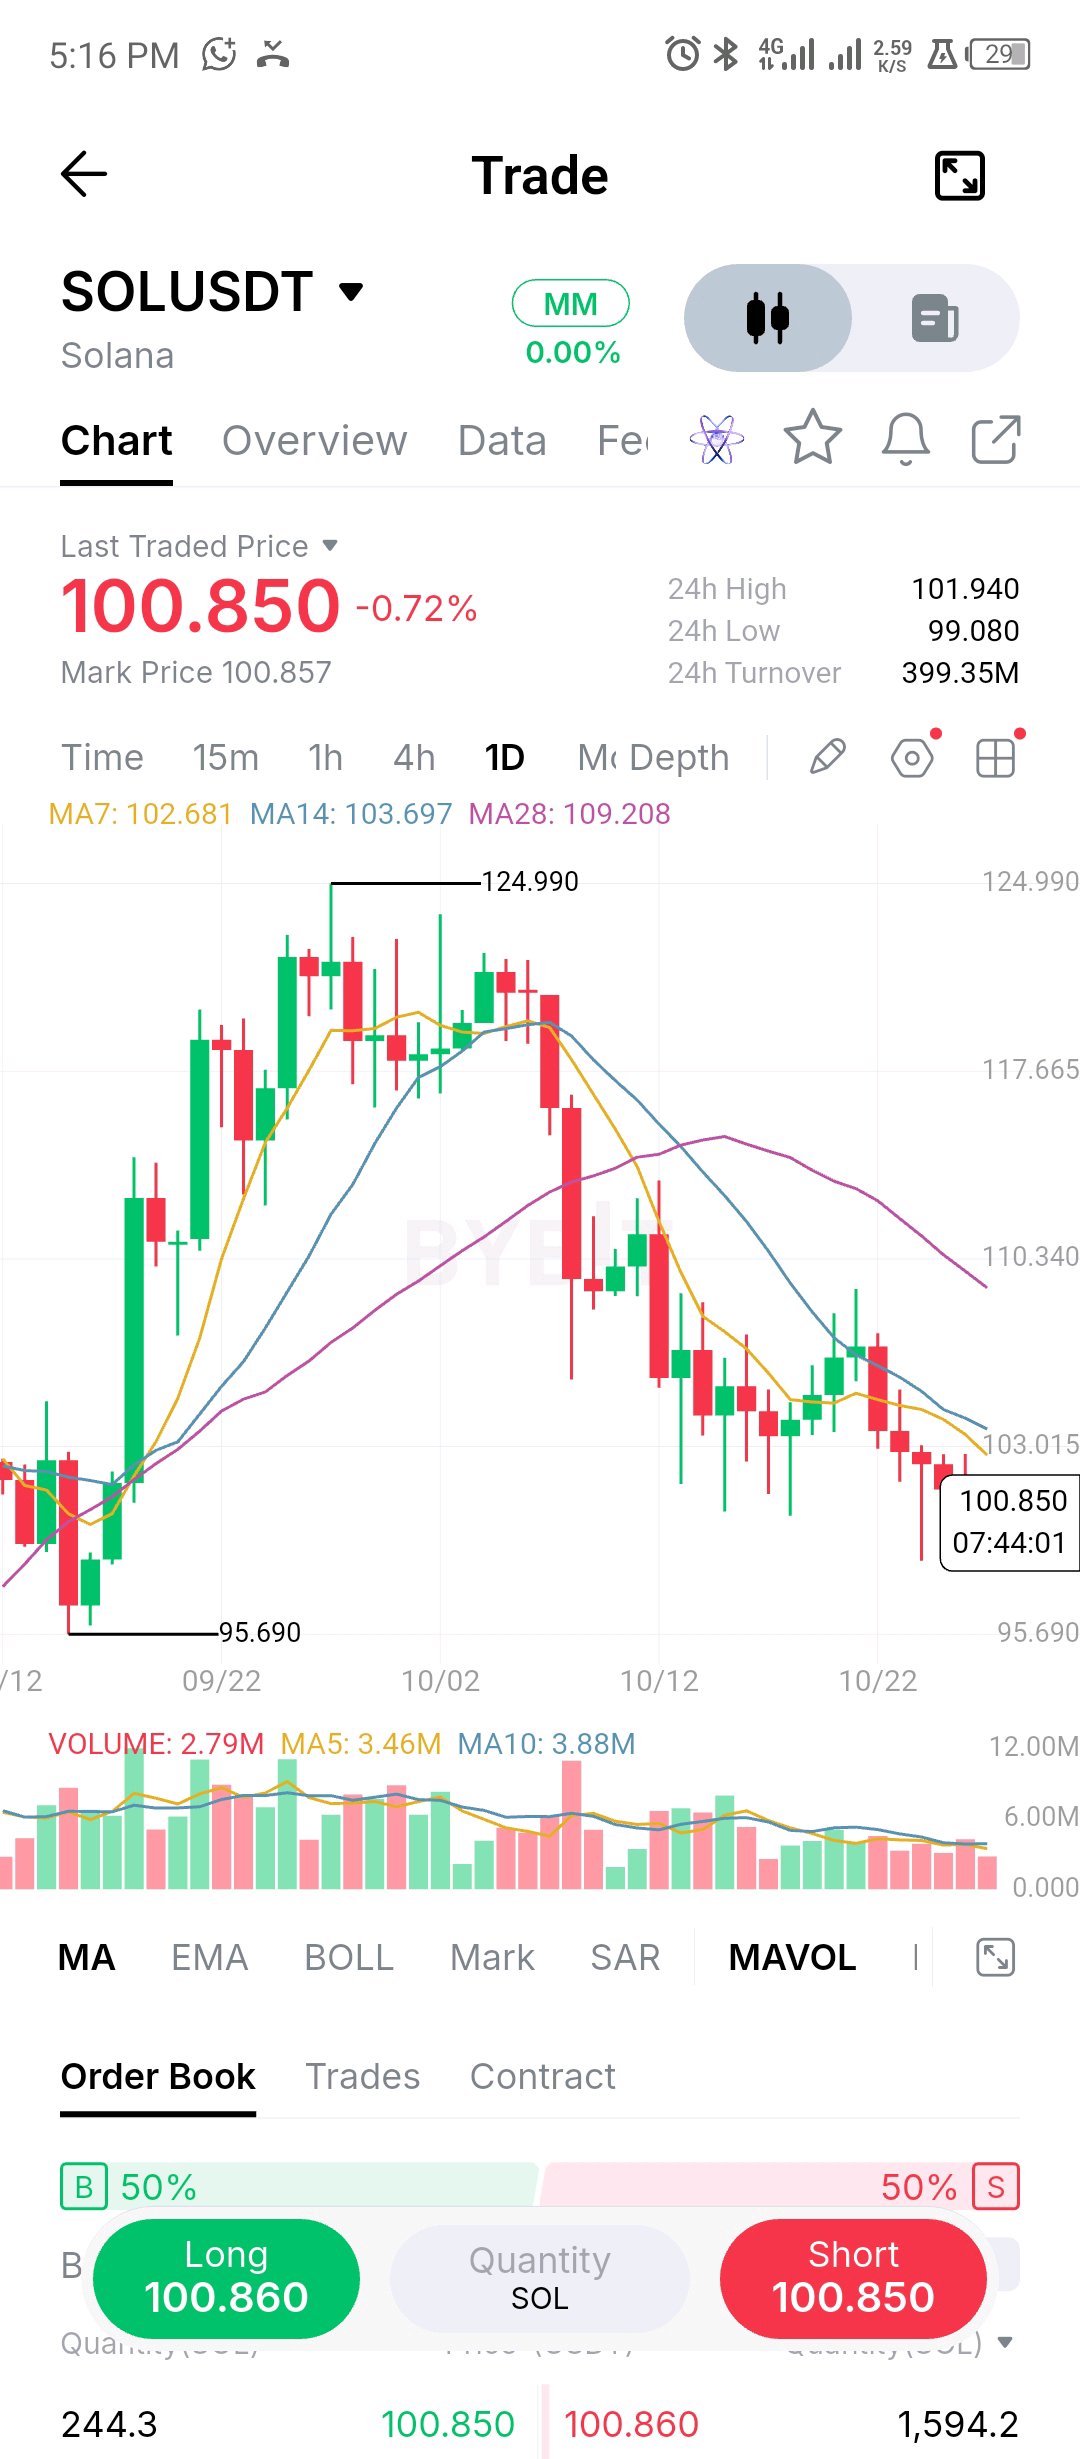
$SOL has given back about 82% of the move from 95.69 to 124.99 and now sits just 5% above the September base. The grind lower has come on shrinking volume, with the 5 day average under the 10 day and nothing like the heavy selling of the early-October breakdown candle. That makes this more of a drift than a panic, but drifts still end at support. Price is under the 7, 14 and 28 day MAs (102.7, 103.7, 109.2), all pointing down, so the first resistance is the 102.7-103.7 band, then the 109 area where the last bounce stalled. The 100 round number was tested intraday (24h low 99.08), and the October 24 wick went lower, near 98.5, and got bought. Below that, 95.69 is the line that matters, because a daily close under it undoes the whole September base. A close back above 103.7 is the first sign sellers are tiring. Until one of those happens, I treat bounces as tests of the MAs, not reversals. $SOLUSDT #ByXIMPACT
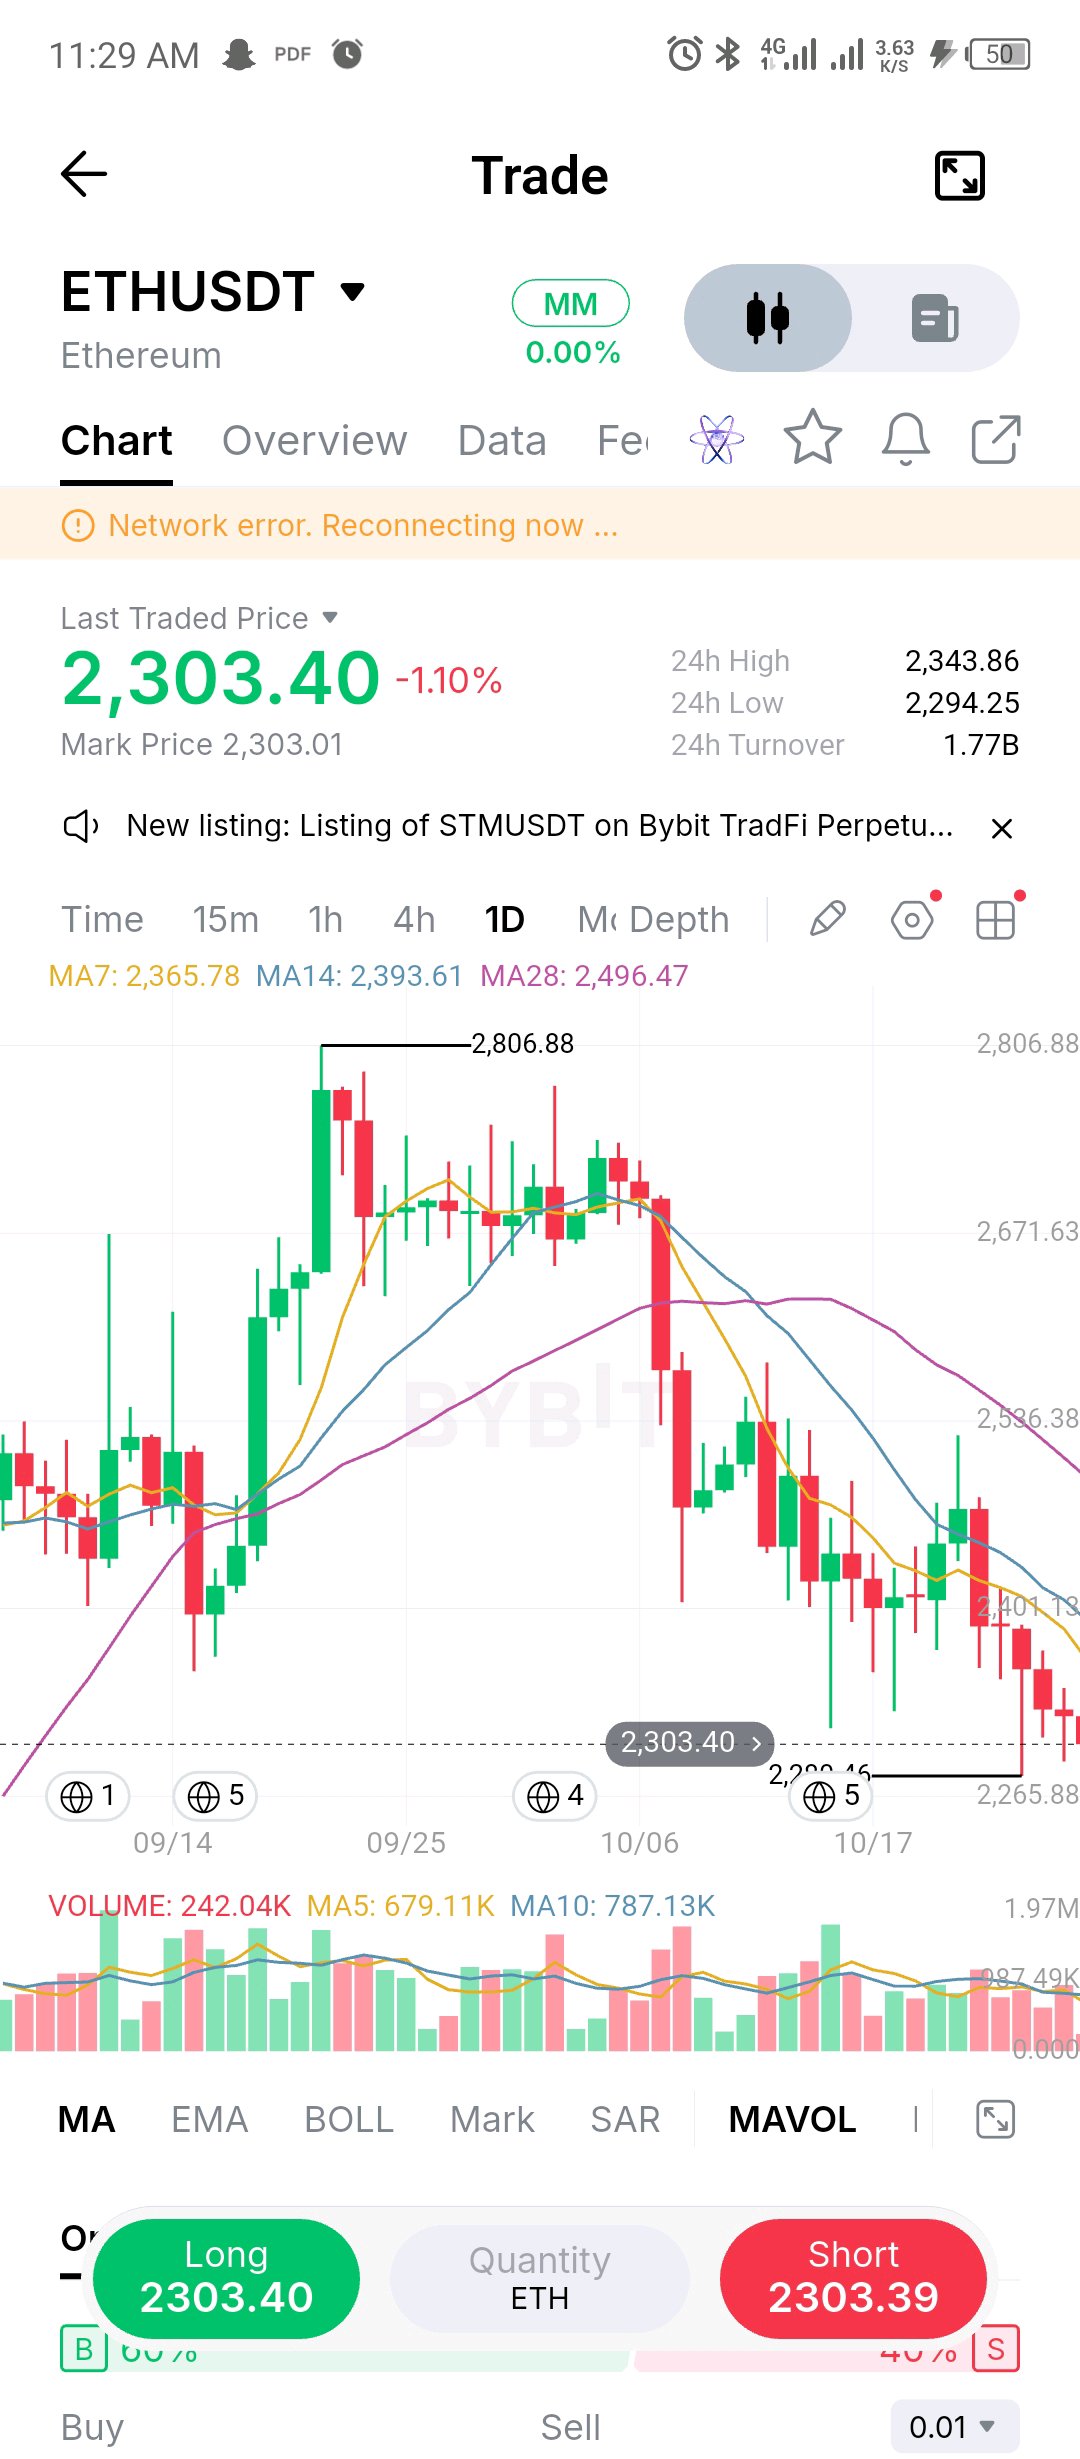
ETH defended the 2,280 area on October 24, a long lower wick that got bought quickly, and has since compressed into a tight 2,294-2,344 range. That's the first sign of buyers, but a defended low isn't a trend change. The bigger picture is still lower highs, with price about 17% under the 2,807 peak and below the 7, 14 and 28 day MAs (2,368, 2,395, 2,497). All three are rolling over, so any recovery has to chew through them one by one. Two lines I'm watching. A daily close above 2,395 (the 14 day MA) says the bounce has legs, with the 2,525 swing high next. A close below 2,280 invalidates the defense and puts 2,200 on the table. Until one of them breaks, this is a range inside a downtrend, and I trade ranges small. $ETHUSDT #ByXIMPACT
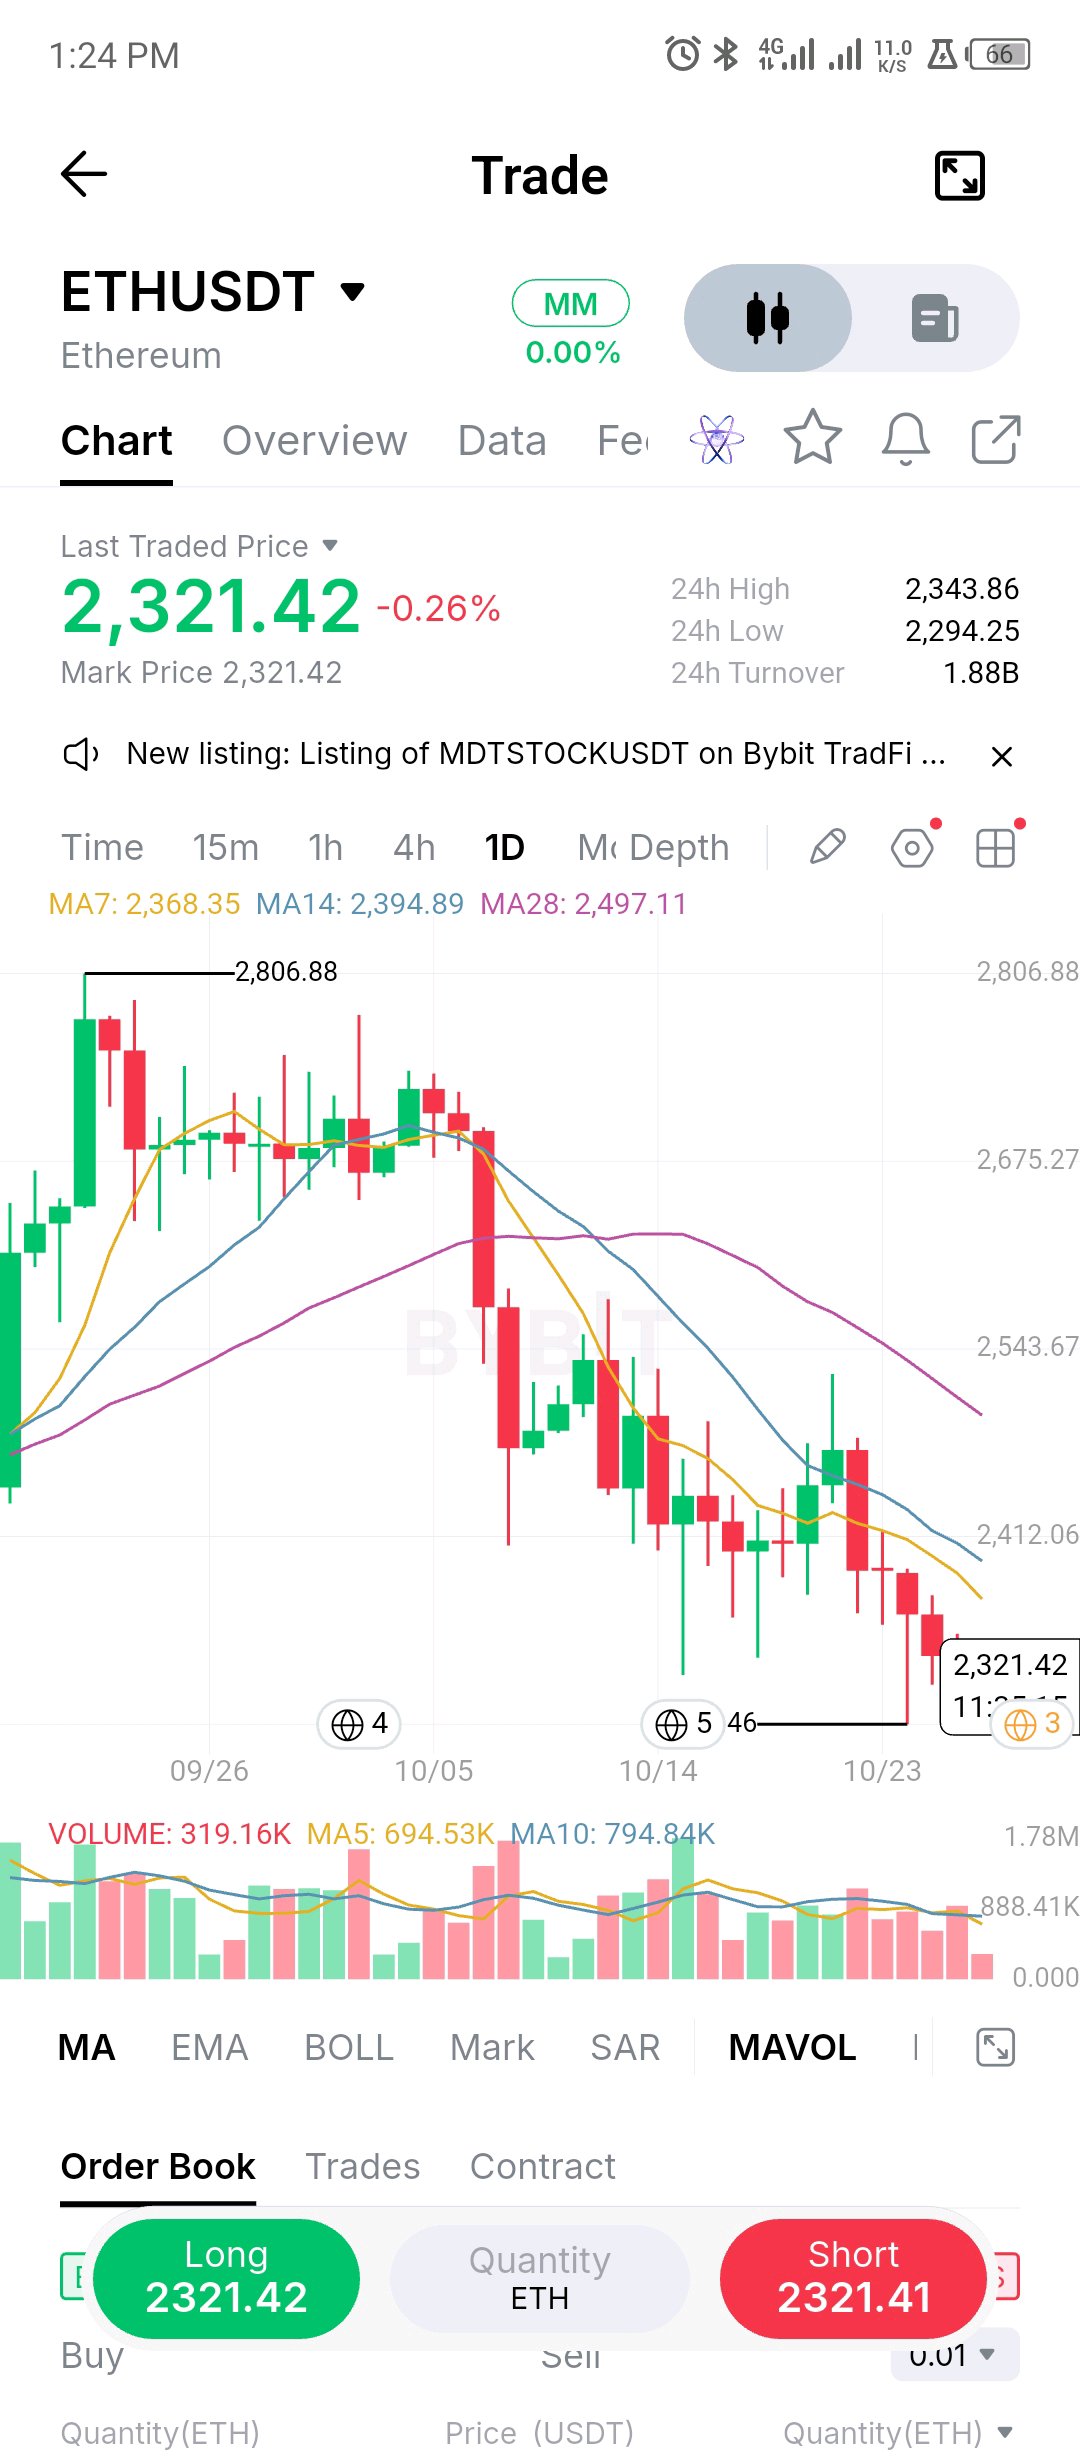
ETH is down about 18% from the 2,807 high and trading at the lowest prints on this daily chart. The structure is clean and not in the bulls' favor: a failed range around 2,650-2,780, an early-October breakdown candle, and lower highs ever since. Price is under the 7, 14 and 28 day MAs (2,366, 2,394, 2,496), all sloping down, so every bounce runs into layered resistance. Today's high near 2,344 is the first lid. The 14 day MA around 2,394 is what a real recovery has to reclaim on a close, and the last bounce topped near 2,525. Volume has cooled on the selloff, with the 5 day average under the 10 day. That looks more like steady distribution than capitulation, and panic lows usually come with a volume spike that isn't here yet. Support is the 2,300 round number, with the recent wick low near 2,280 just under it. A daily close below that opens 2,200. I'm not interested in longs until 2,394 is reclaimed. $ETHUSDT #ByXIMPACT
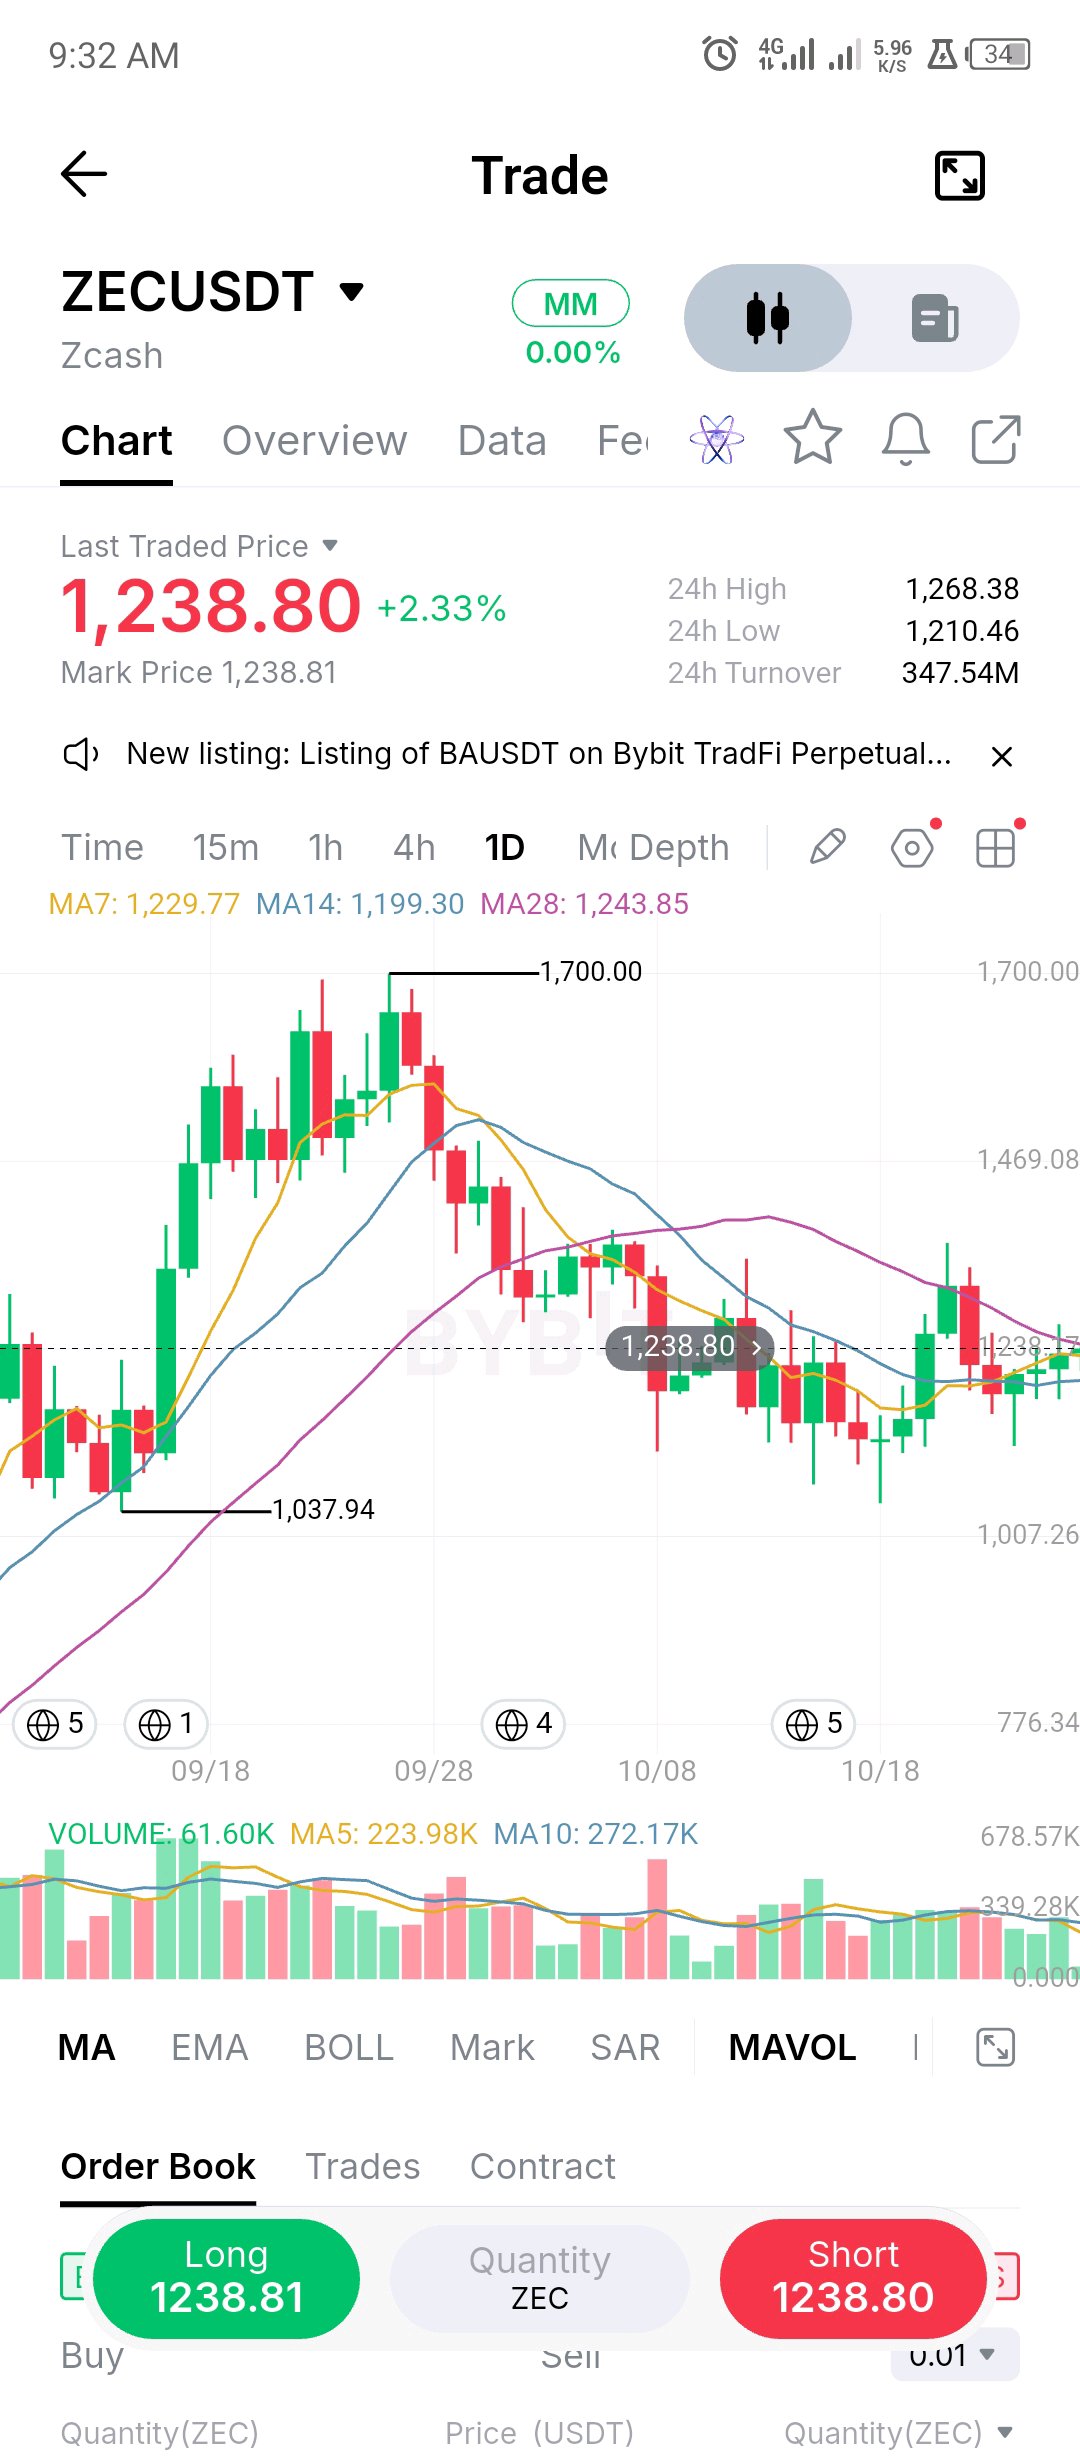
$ZEC round-tripped almost its entire move. It ran from 1,038 to 1,700, fell back to roughly 1,050 by October 18, and has since recovered about 18%. The question now is whether that retest was the low or just a pause. On the daily, price sits inside a tight cluster: the 7, 14 and 28 day MAs are at 1,230, 1,199 and 1,244, with price at 1,239. When all three average within about 4% of each other, direction usually comes from whichever side breaks first. Volume is cooling too, with the 5 day average under the 10 day, which fits a coil. Upside: a daily close above 1,268 (today's high), then the 1,300-1,365 area where last week's bounce ran out. Downside: 1,210 first, then the 14 day MA near 1,199, with 1,050 as the level that decides the bigger picture. I don't have an edge in the middle of this cluster, so I'm letting the break show direction. $ZENTUSDT #ByXIMPACT
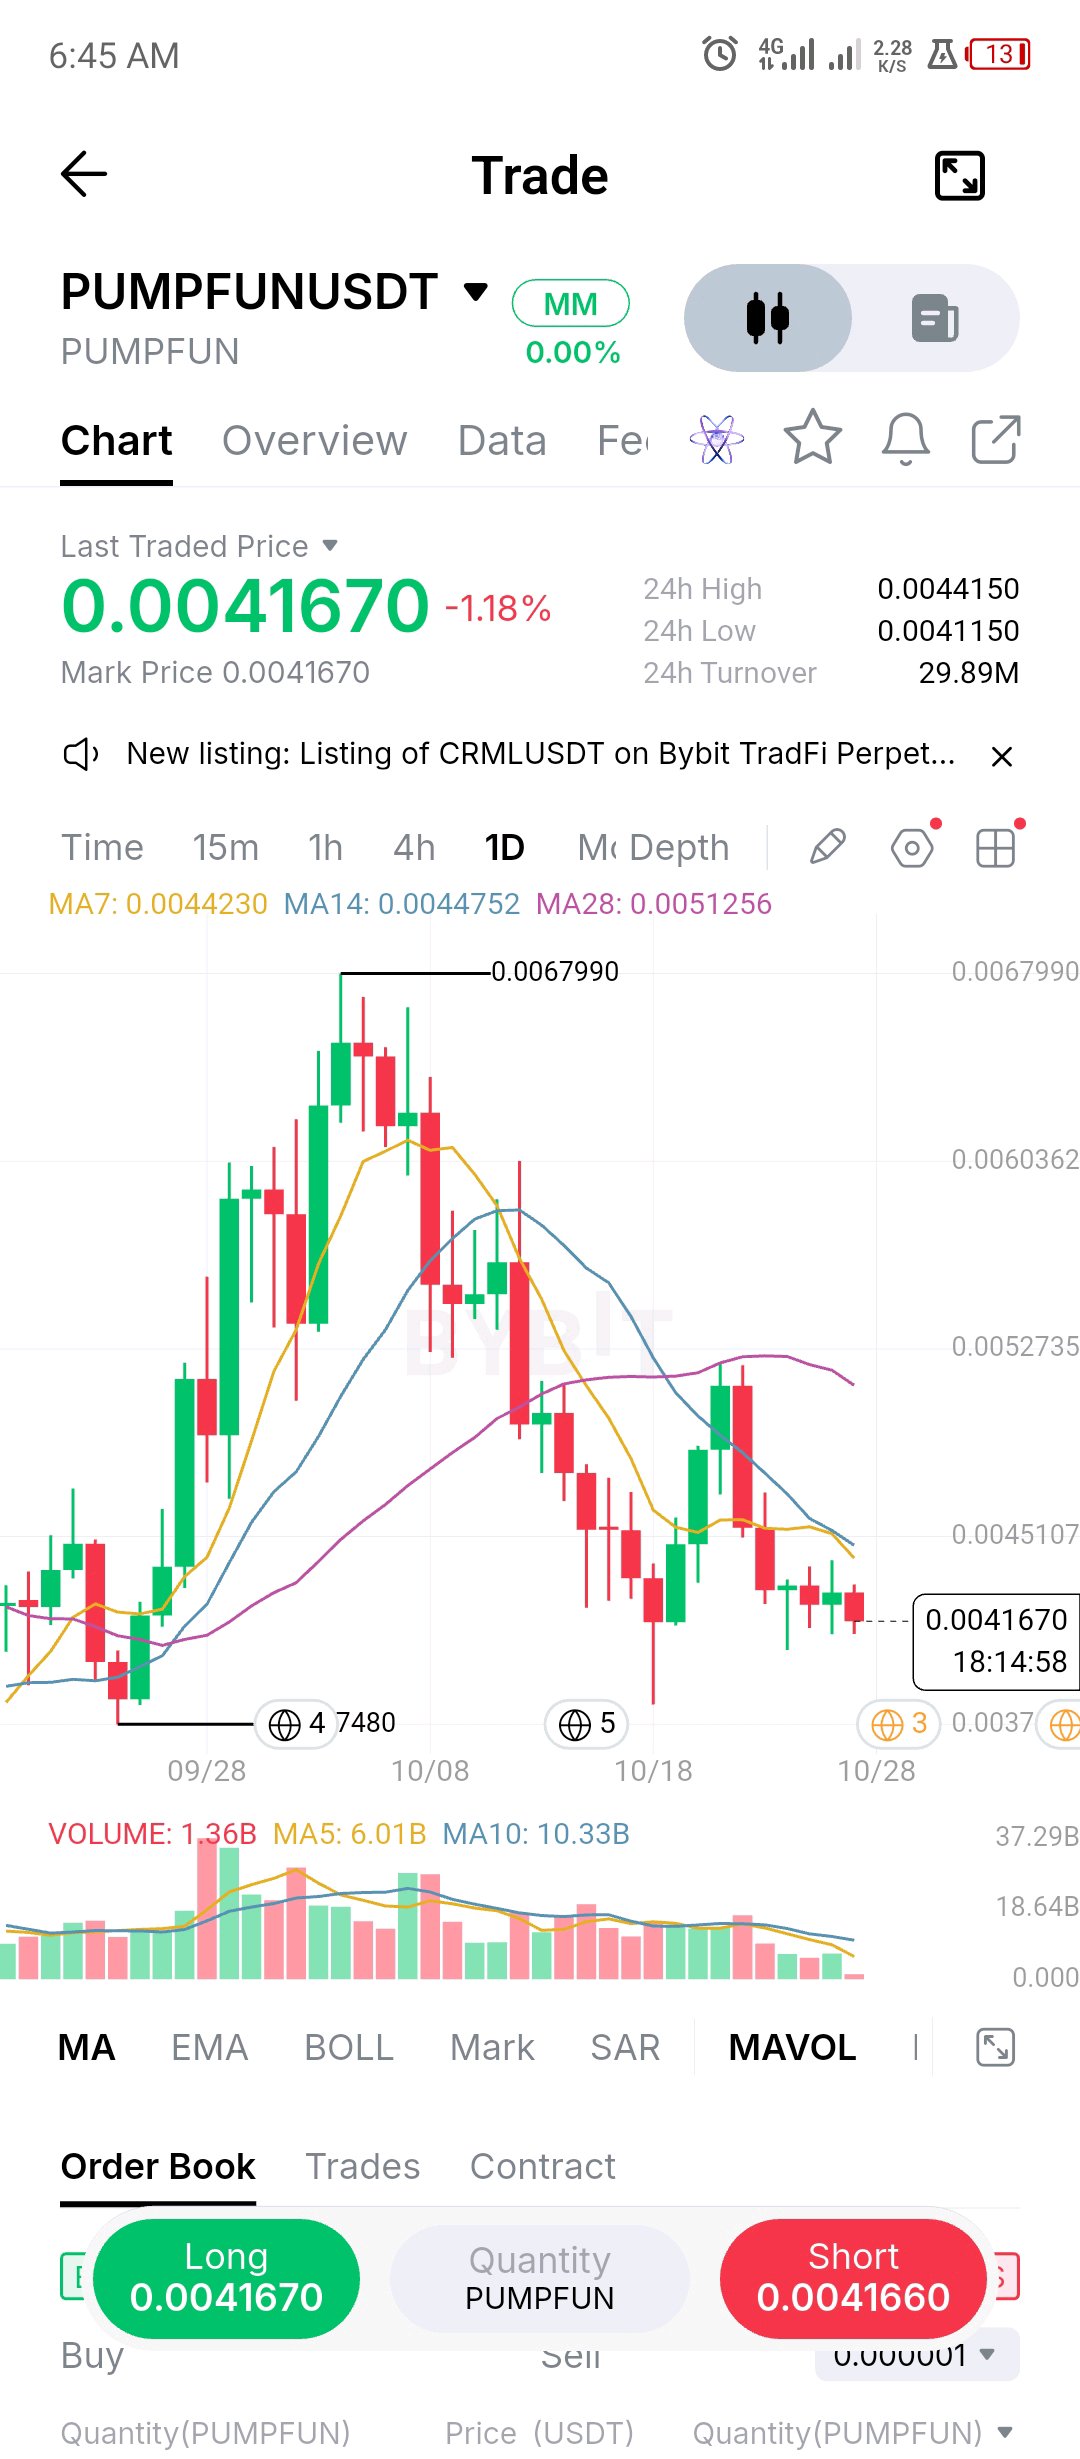
PUMPFUN has handed back about 86% of the run from 0.00375 to 0.00680, and the daily candles have gone small and quiet right above the base. Volume is fading too, with the 5 day average well under the 10 day. That's compression, and compression usually ends with a move. The structure still favors sellers. The last bounce stalled near 0.0052, right at the 28 day MA (0.00513), and highs have stepped down since. The 7 and 14 day MAs (0.00442 and 0.00448) sit just above price, which makes 0.0044-0.0045 the first ceiling. Downside map: 0.00412 (the 24h low) first, then the 0.00375-0.00382 zone where price has bottomed twice. A daily close under 0.00375 breaks the whole base. For bulls, a close above 0.00448 is the first sign of a turn, with 0.0052 as the next test. On a perp, I'd keep leverage low in a range this tight until one side breaks. $PUMPUSDT #ByXIMPACT
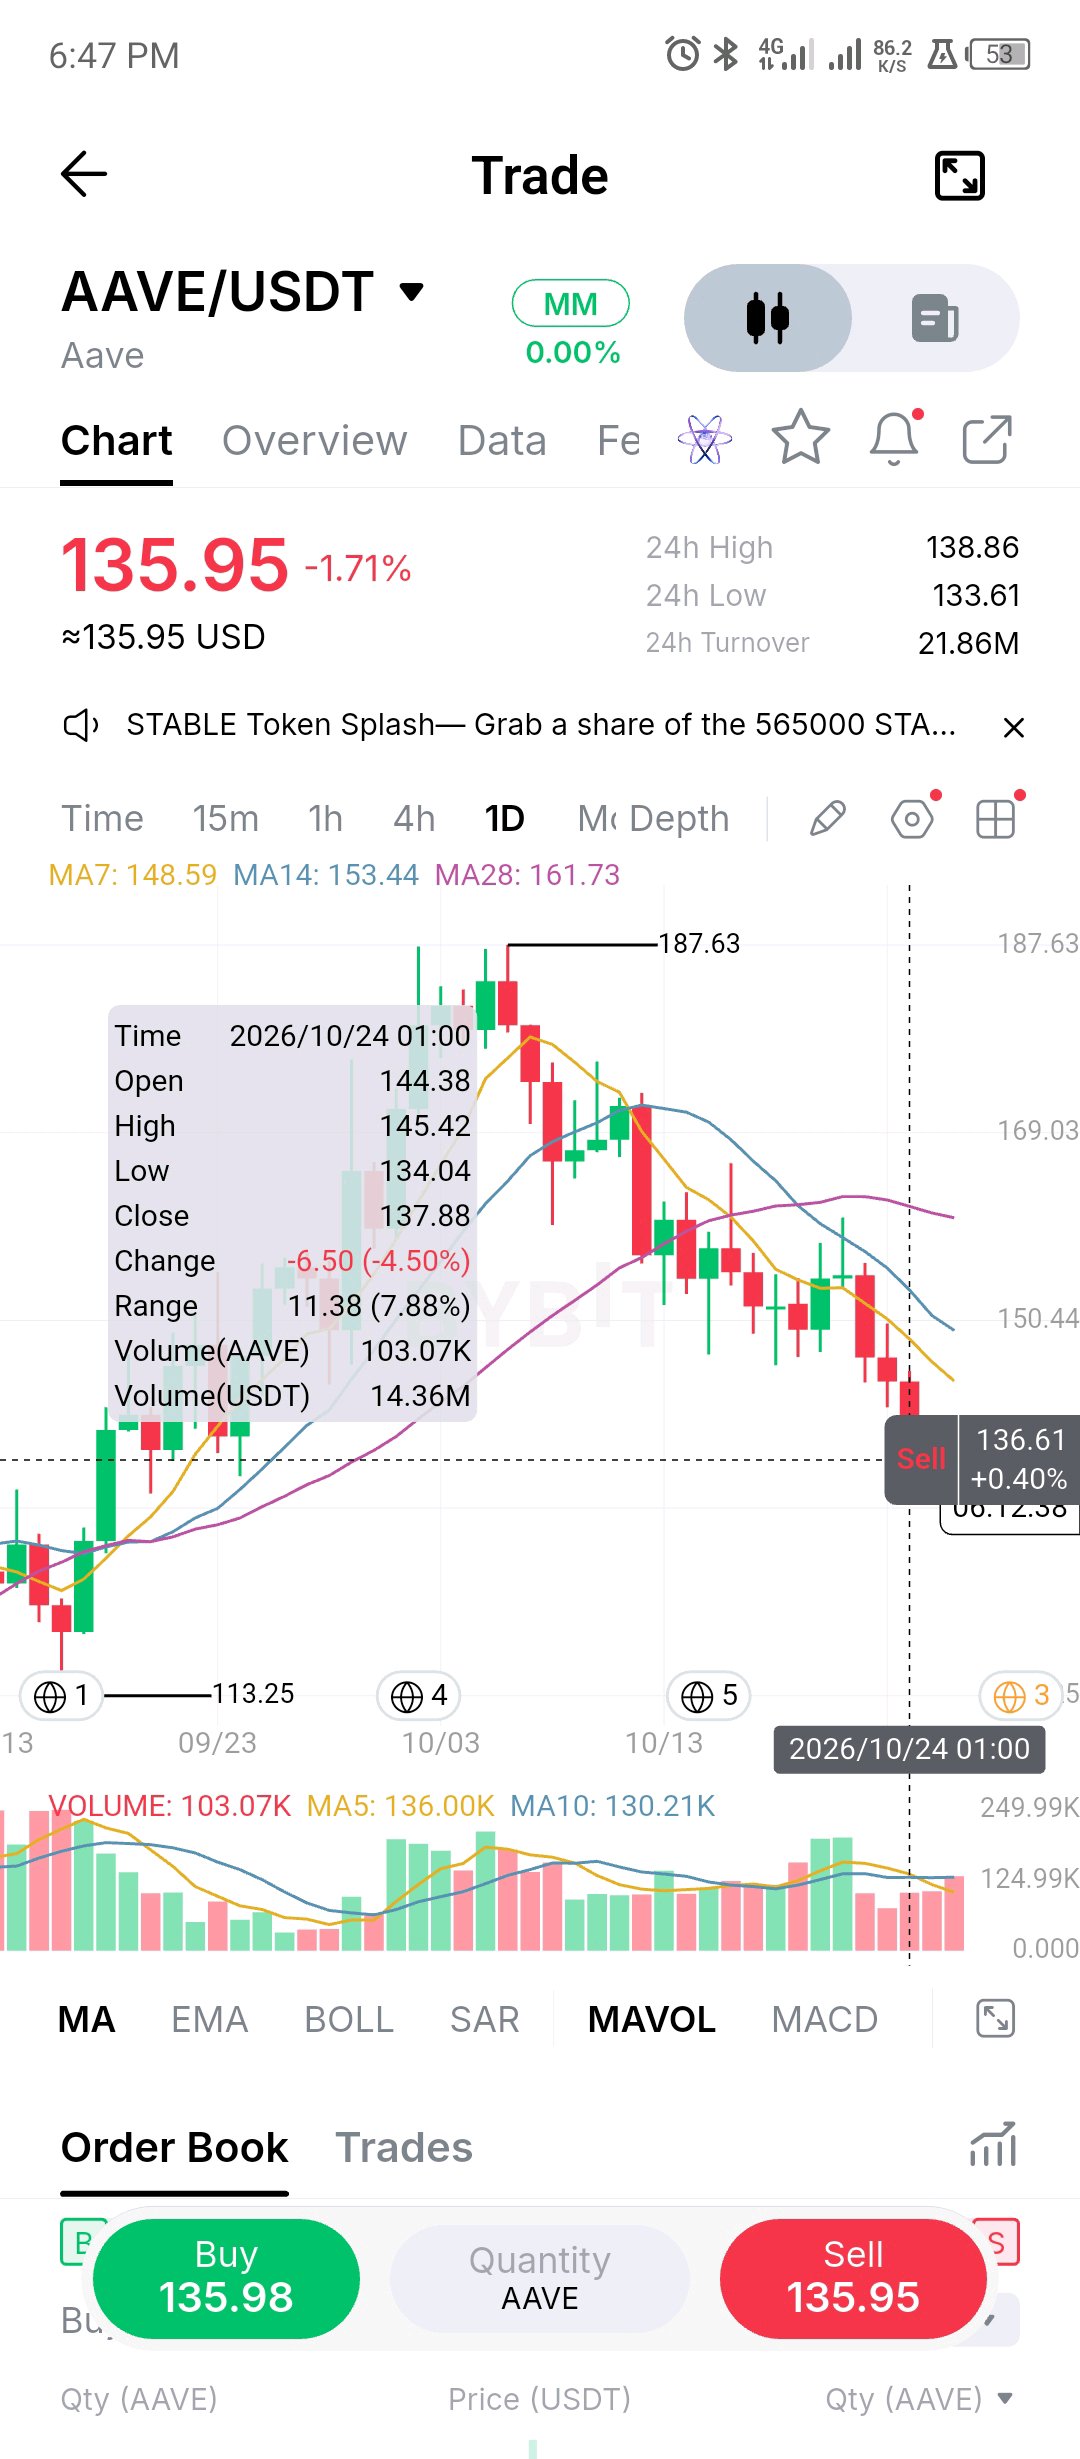
AAVE has erased about 70% of the climb from 113 to 187.6, and the daily structure is hard to argue with: lower highs, lower lows, price 8% under the 7 day MA (148.6) and 16% under the 28 day (161.7). 134 is the level in play. The October 24 low (134.04) and today's low (133.61) both sit there. A daily close below it opens 129, the 78.6% retrace of the whole move, then the late-September range in the 120s. For bulls, the first sign of life isn't a bounce, it's a close back above 141-142 (the 61.8% retrace). A real trend change needs the 7 day MA at 148.6 reclaimed and a higher high. Until then I treat rallies as tests of resistance, not reversals. $AAVEUSDT #ByXIMPACT
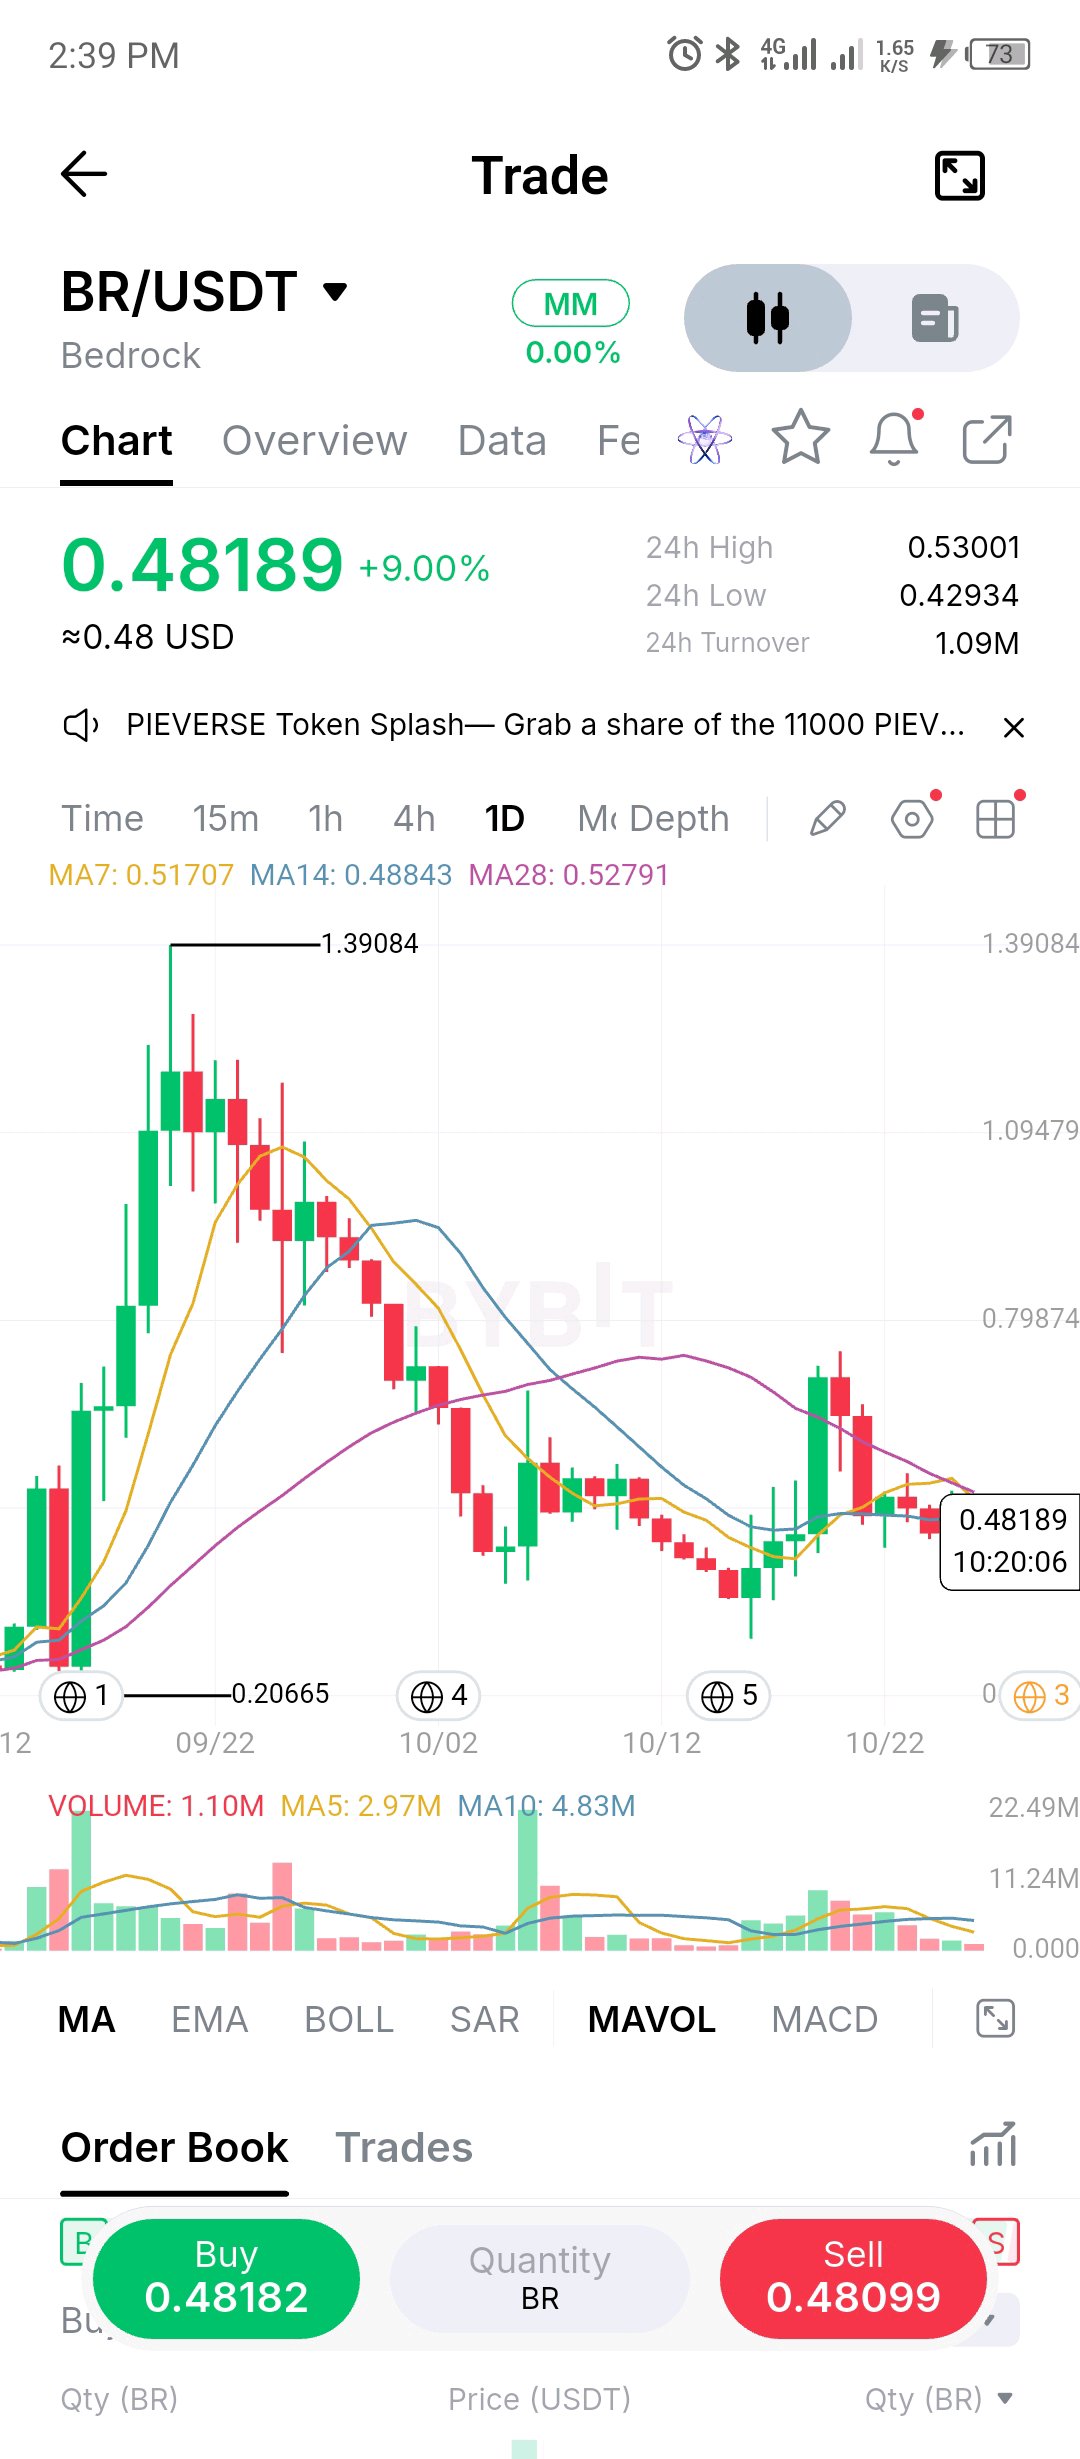
BR has given back roughly 77% of its entire 0.207 to 1.391 run, and the daily chart is now asking a simple question: base or pause? Price is back on top of the 14 day MA (0.488), but the 7 and 28 day sit overhead at 0.517 and 0.528, right under today's 0.530 high. That's a thick band, so a daily close above 0.53 is the minimum to take this bounce seriously. Volume is also contracting, with the 5 day average well under the 10 day. Support is today's 0.429 low first, then the mid-October low near 0.30. Losing 0.43 on a close would say last week's bounce was relief, and the next leg would test that lower zone. $BRUSDT #ByXIMPACT
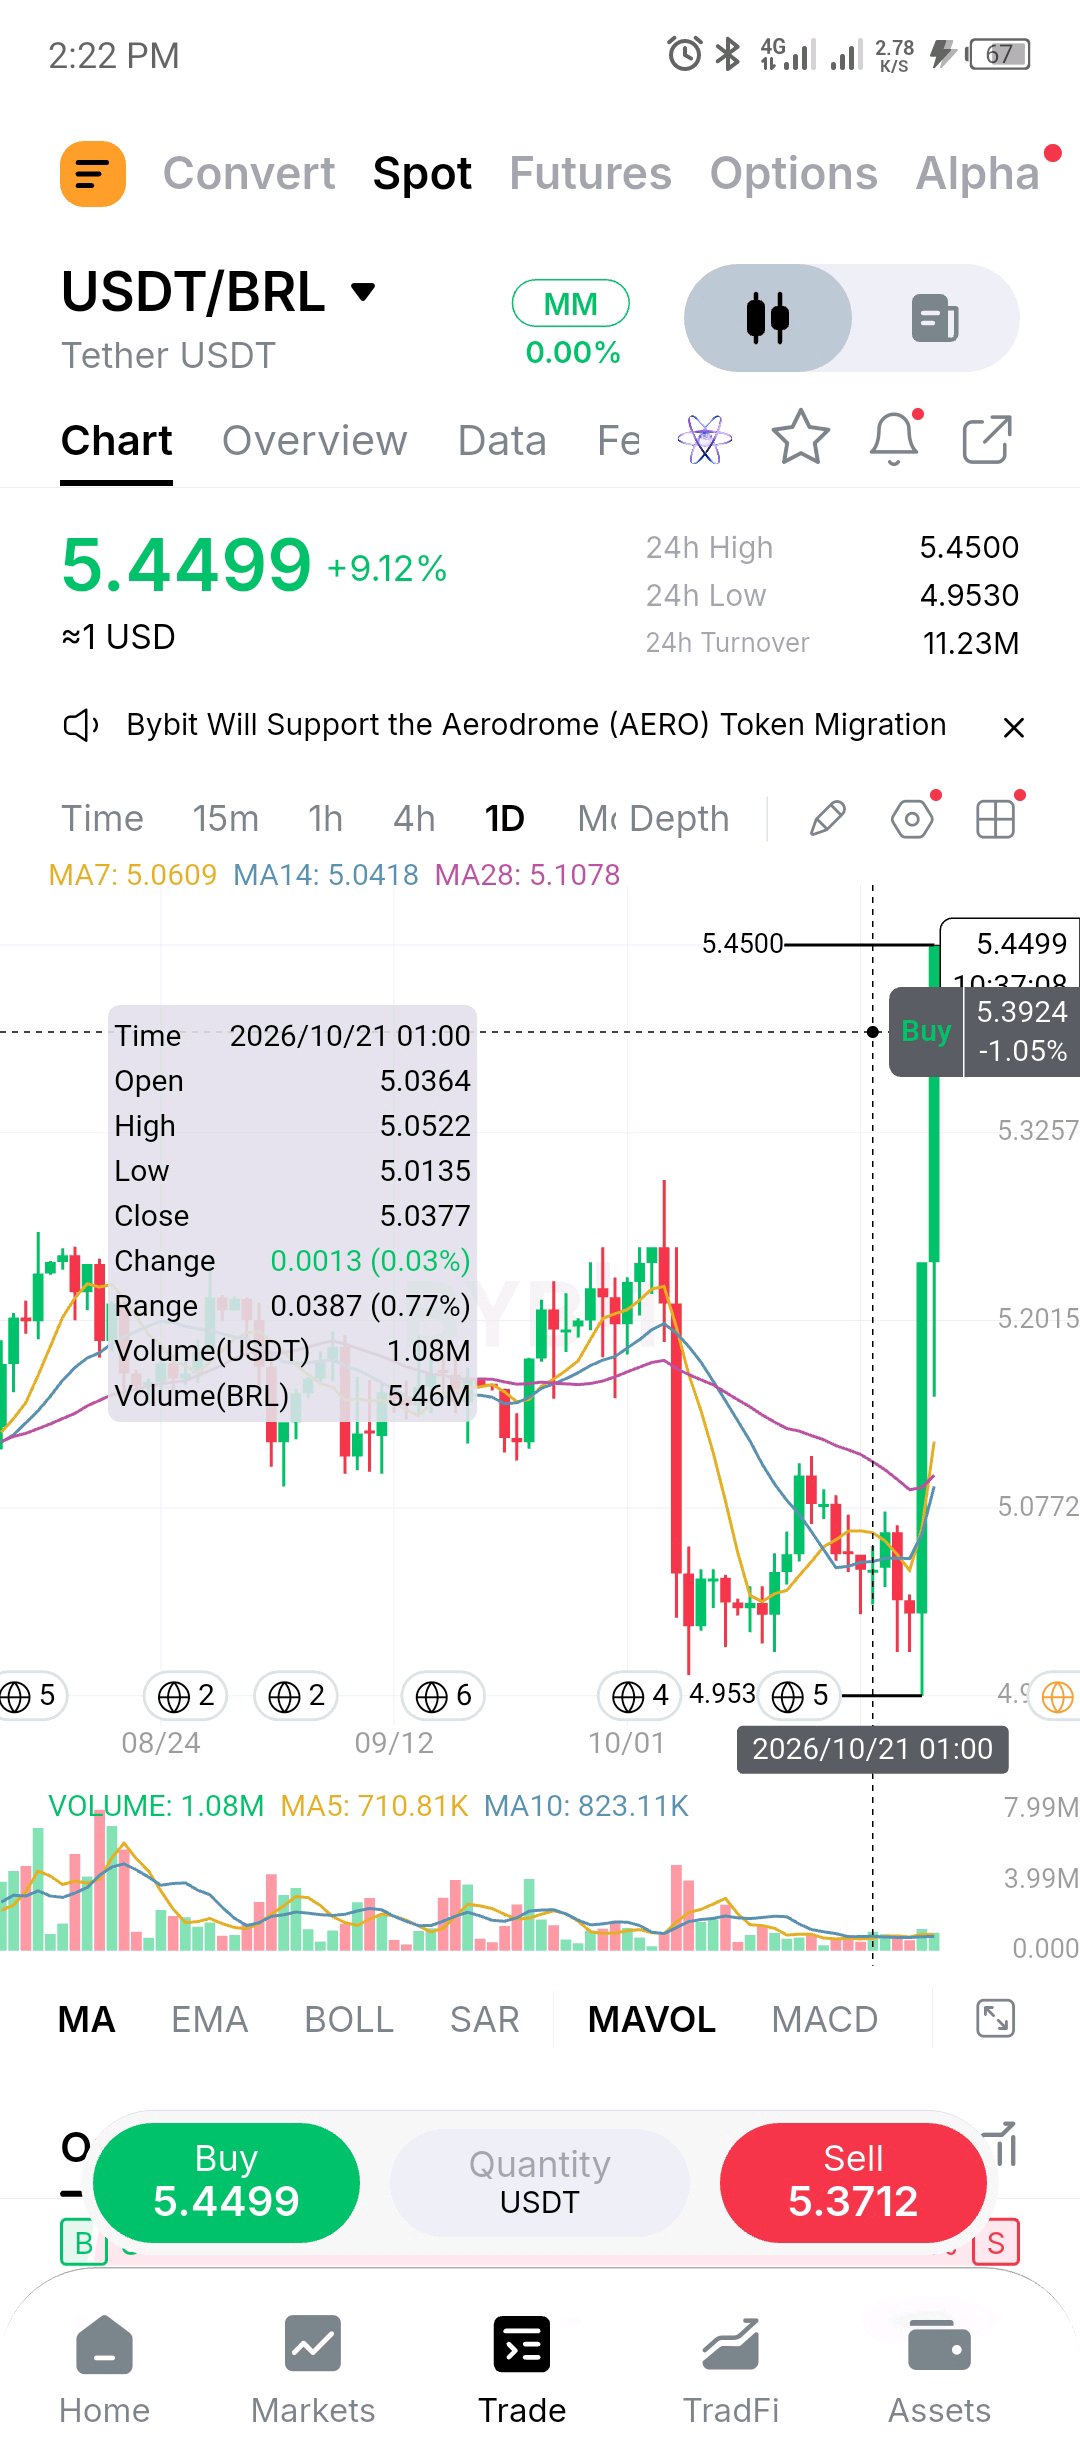
USDT/BRL just printed a +9% day, and the first thing to get straight is that this isn't a USDT move. USDT is the anchor, so what's moving is either the real or this order book. Price went from the 4.95 low to 5.45 in one candle, leaving the 7, 14 and 28 day MAs (5.06, 5.04, 5.11) far behind. Before the early-October drop the pair was mostly trading between 5.1 and 5.3, so 5.45 sits above anything on this chart. Two readings. Genuine BRL weakness, in which case 5.45 becomes the level to hold. Or a local liquidity spike that fades back toward the 5.10-5.25 zone. The wide gap between buy and sell right now leans toward the second until proven otherwise. Before trading it, check the global USD/BRL rate. If it hasn't moved like this, you're looking at an order book, not a trend. $USDCUSDT $THETAUSDT #ByXIMPACT
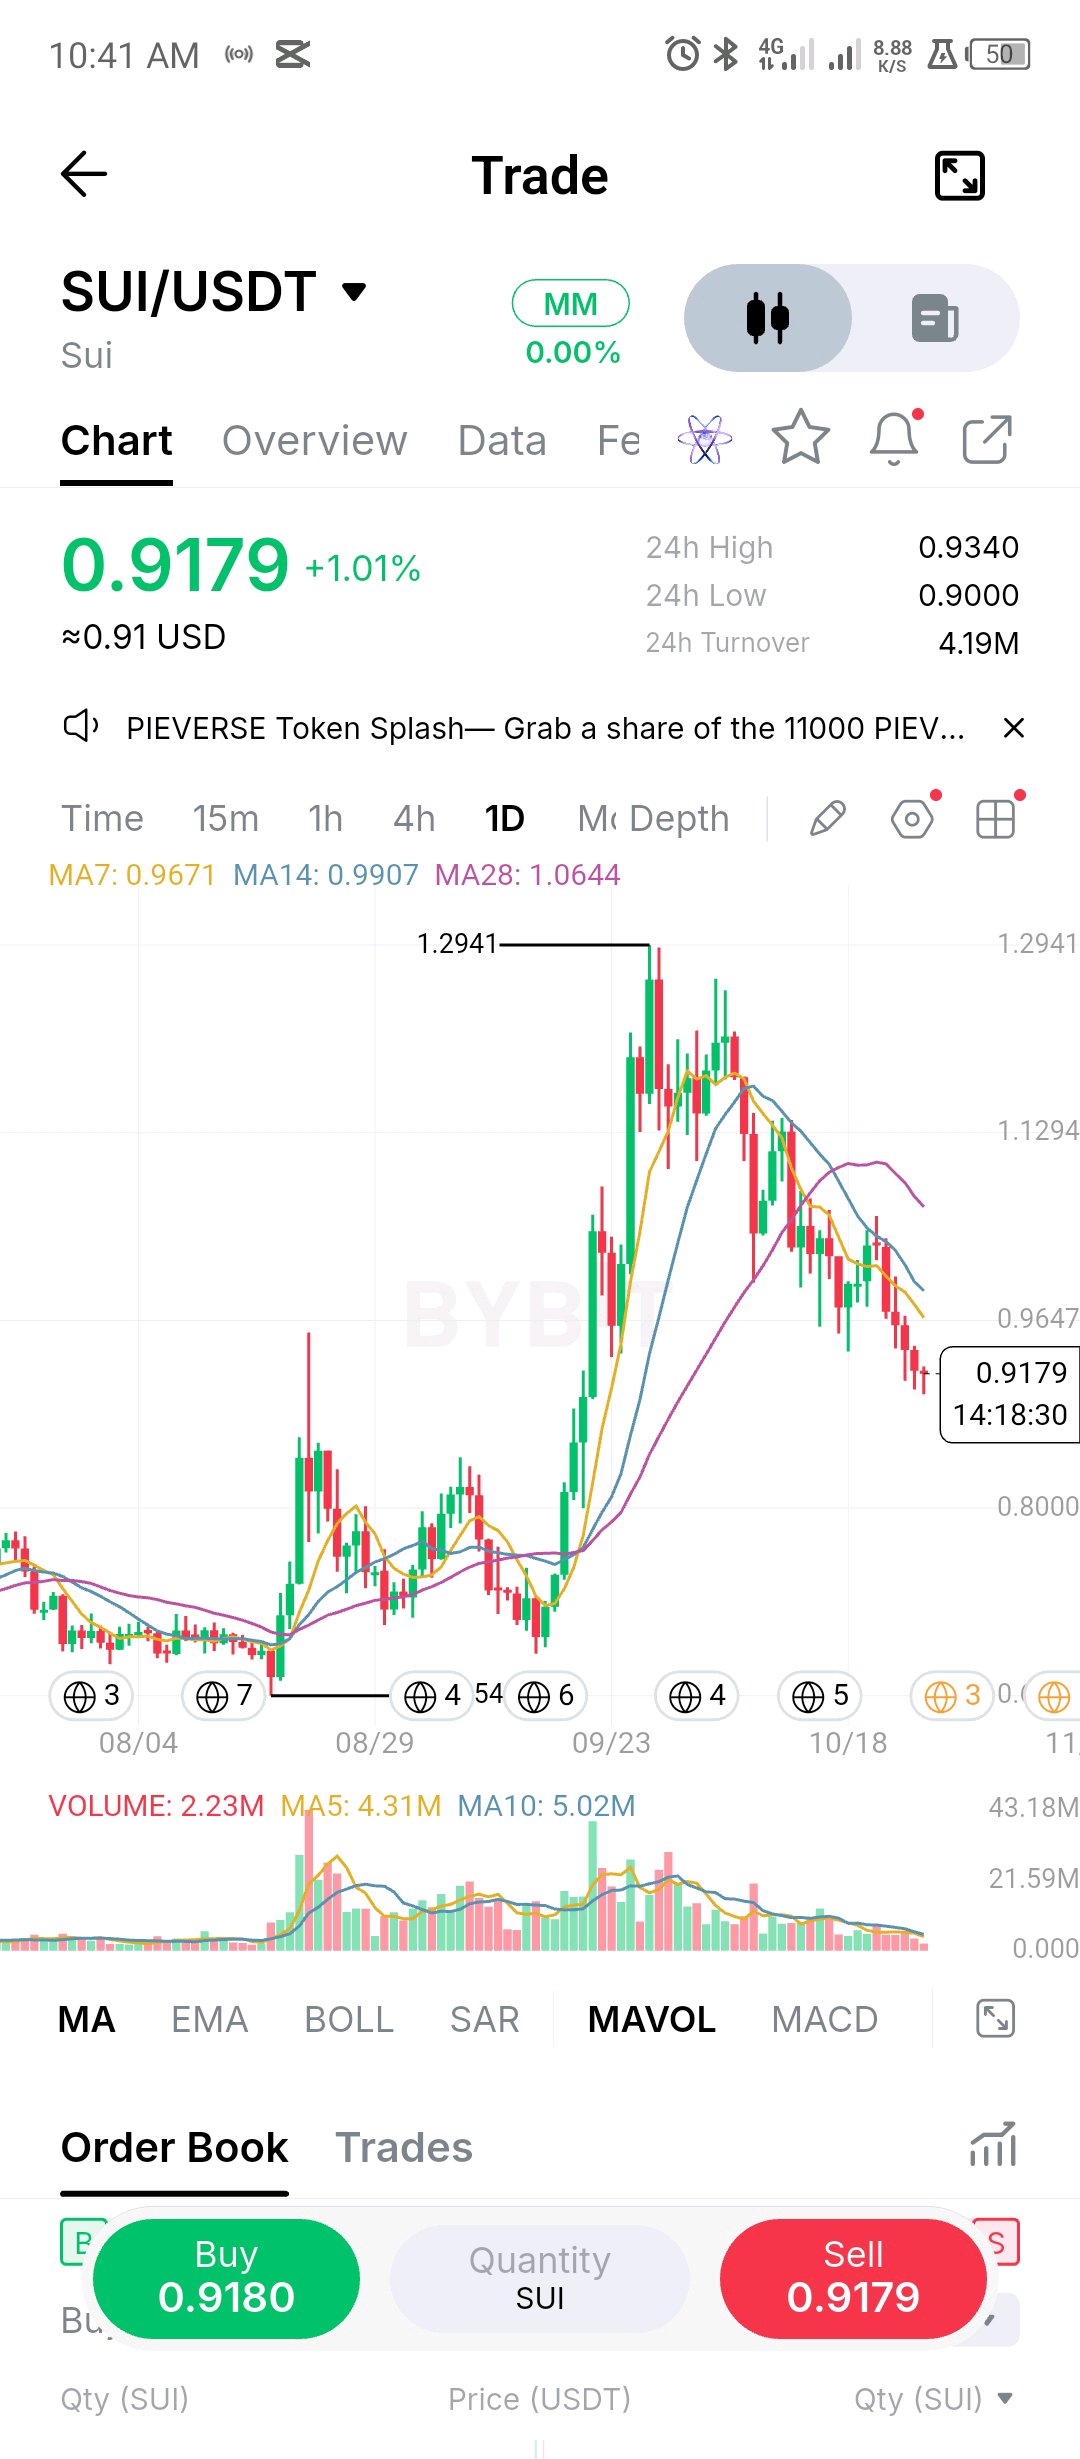
SUI keeps bleeding in an orderly way, and orderly is the key word. Lower highs, lower lows, mostly red candles stepping down from 1.29, and volume shrinking on the way down instead of expanding. That looks like drift, not panic. Today's low printed exactly 0.9000, and round numbers tend to attract bids, so that's the level everyone is watching. Price is under the 7, 14 and 28 day MAs (0.967, 0.991, 1.064), all sloping down, so any bounce has a ceiling stacked right above it: 0.967 first, then the 1.00 psychological level. If 0.90 breaks on a daily close, the next real support is the 0.80 area where the September thrust started, about 13% lower. If it holds and price closes back over 0.967, the drift is at least paused. Until then I treat bounces as resistance tests, not reversals. $SUIUSDT #ByXIMPACT
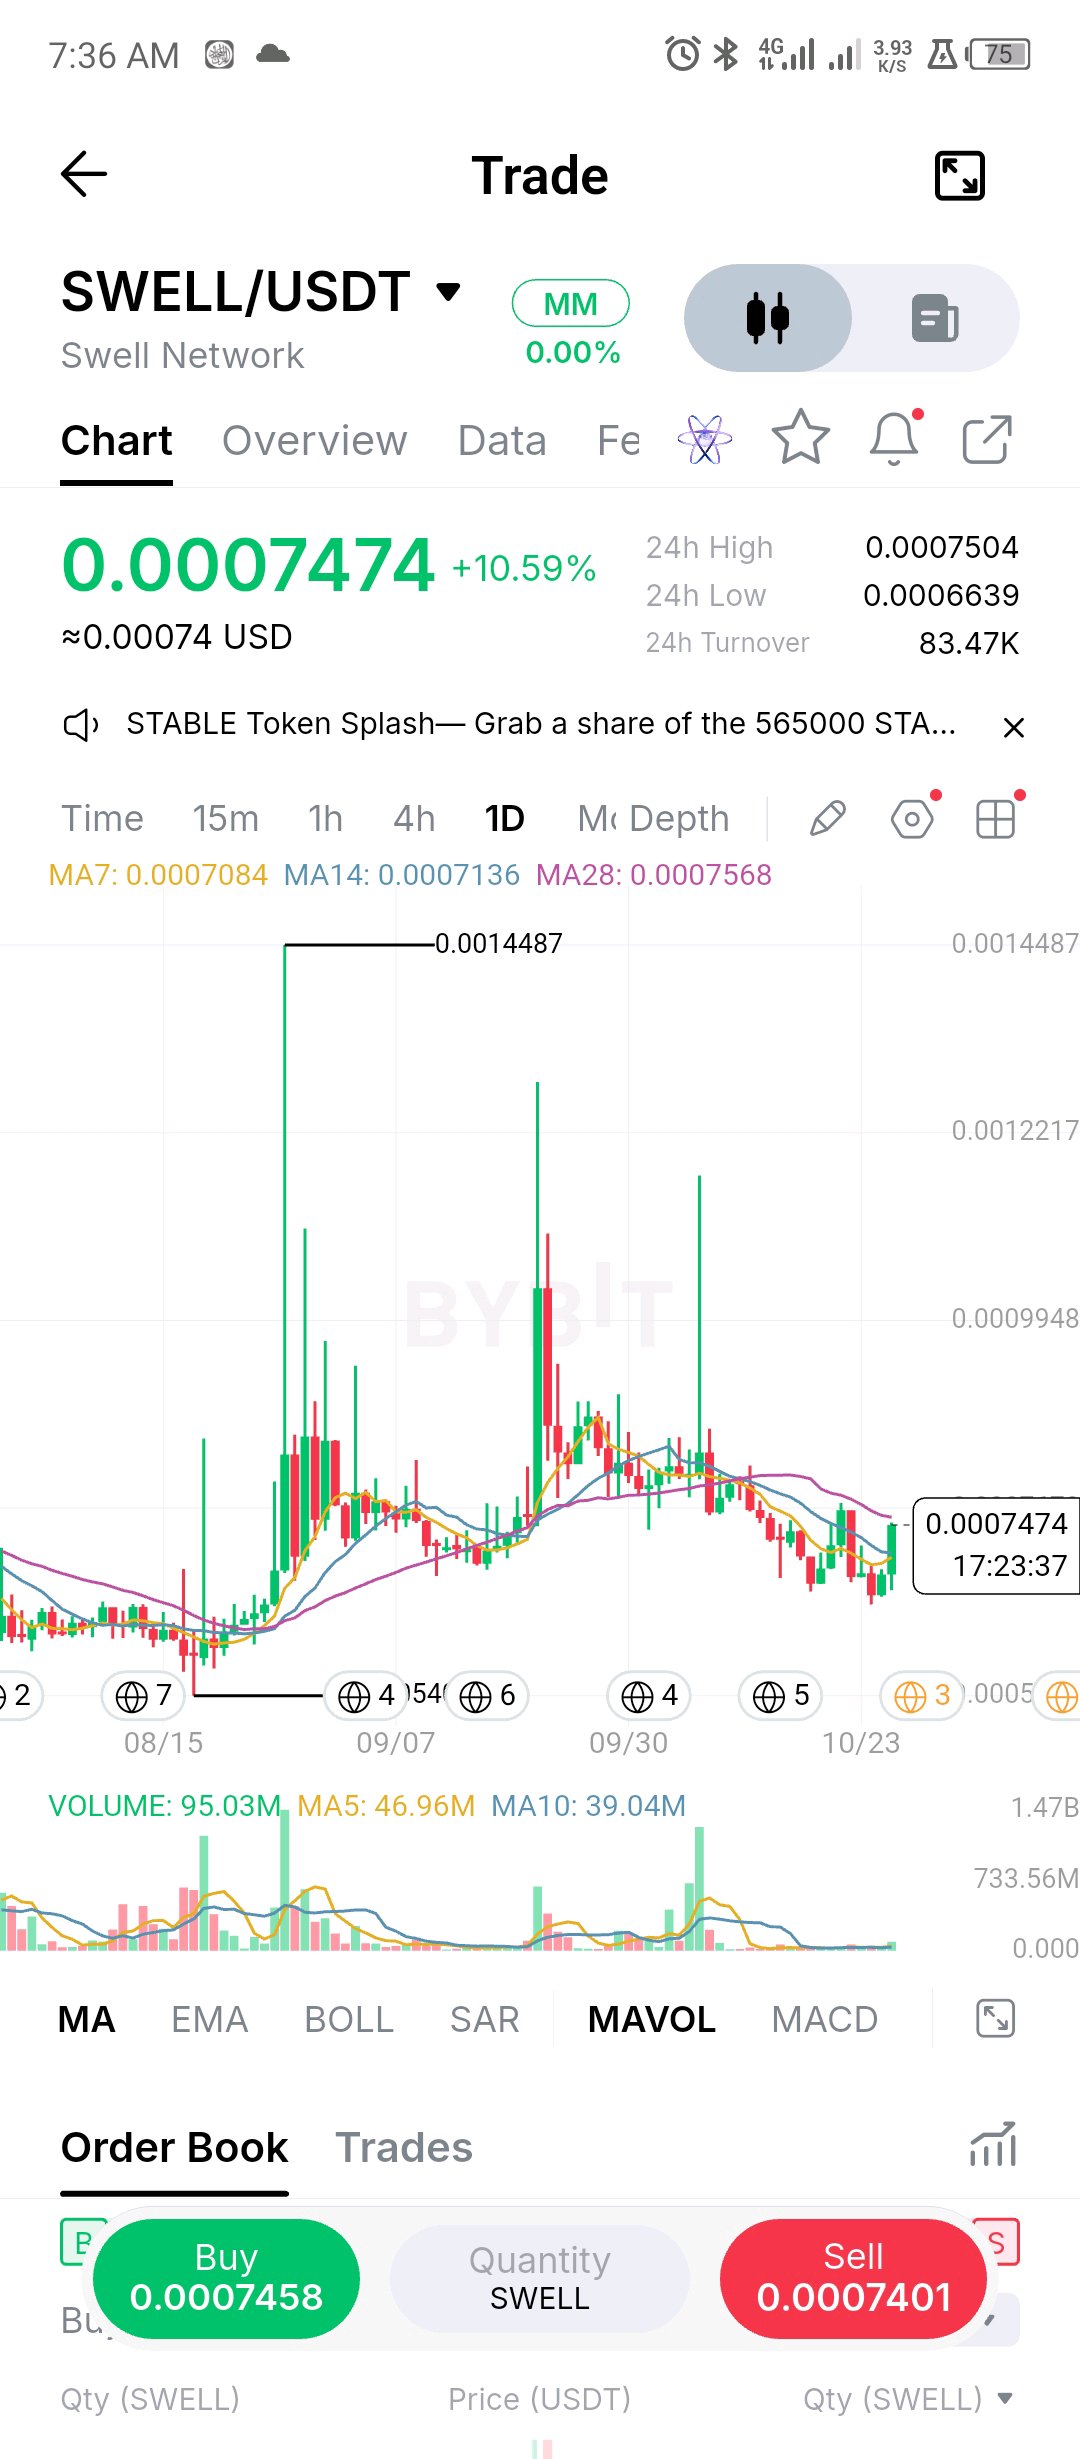
SWELL is doing something it hasn't done in a while: putting volume behind a green candle. Today's volume is already around 95M with most of the session still to go, against a 10 day average near 39M. Price has pushed back over the 7 and 14 day MAs (both around 0.00071) and sits about 1% under the 28 day at 0.000757, which has been overhead since the early-October breakdown. A daily close above 0.000757 would be the first higher-timeframe sign sellers are losing the trend. Beyond that, 0.00077 to 0.00085 is where the last leg down started, so expect supply there. Below, 0.00071 is first support and today's 0.00066 low is the line that matters. Heads up: this one is thin and wicks hard, so size accordingly. $SWELLUSDT #ByXIMPACT
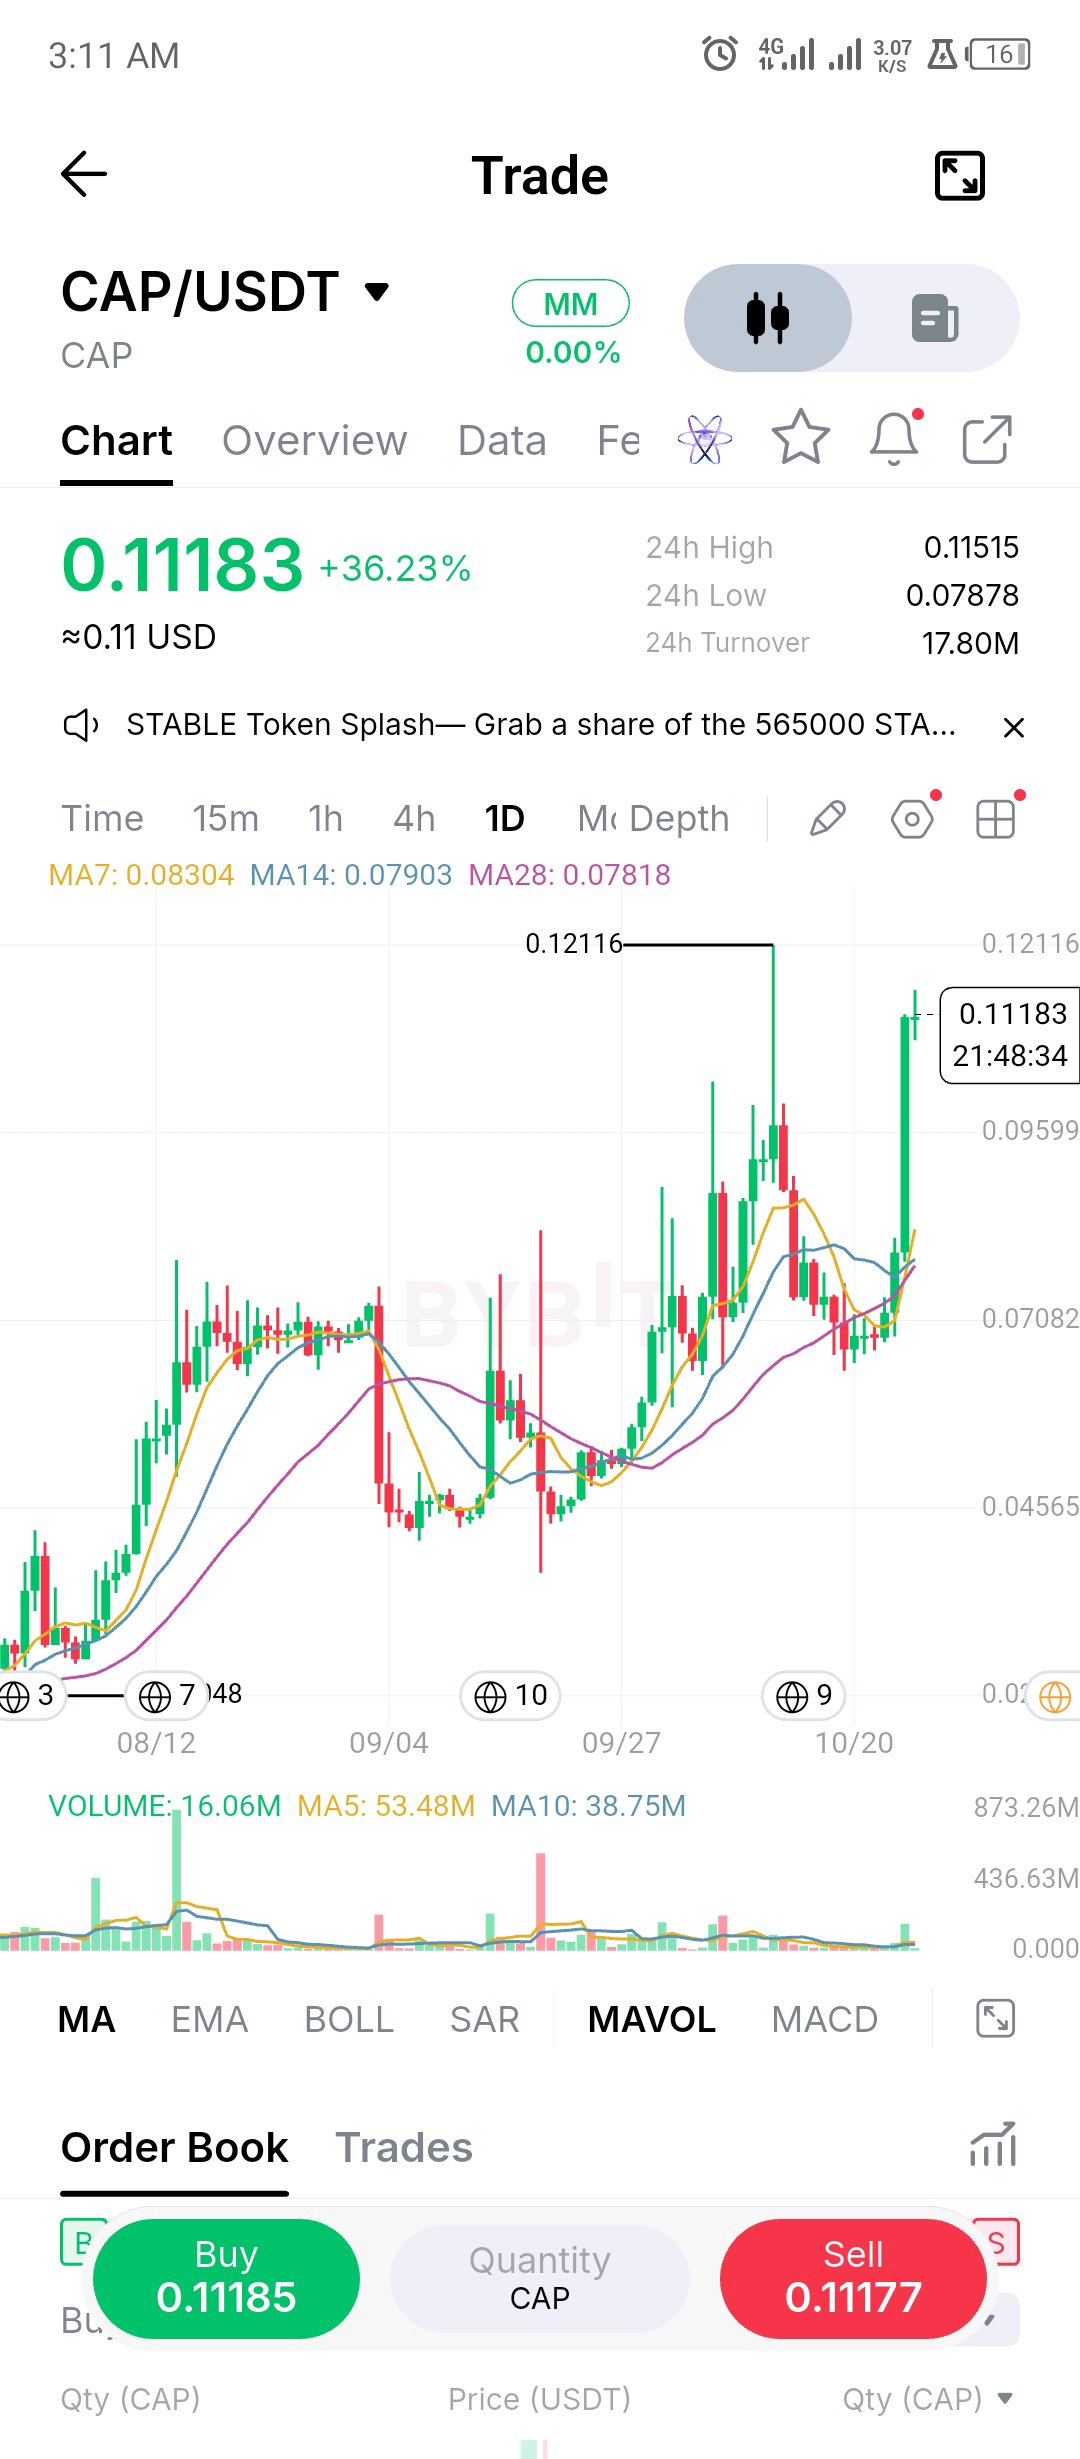
CAP just printed a roughly 35% daily candle that blew through a range it had been chopping in for weeks. The move is real. What I'm less sure about is the entry anyone gets now. Price is about 40% above the 14 and 28 day MAs, which are flat near 0.079, with the 7 day only now curling up. A gap like that gets closed by either time or price, and I don't know which this will be. Volume on the thrust also looks modest next to the spikes earlier in the chart, so I'd want to see it confirmed. Overhead, the 0.121 wick high is about 8% away. Below, the candle's midpoint near 0.095, then the 0.08 base it launched from. I'd rather watch for a pullback that holds the upper half of that candle than buy a vertical move. $CAPUSDT #ByXIMPACT
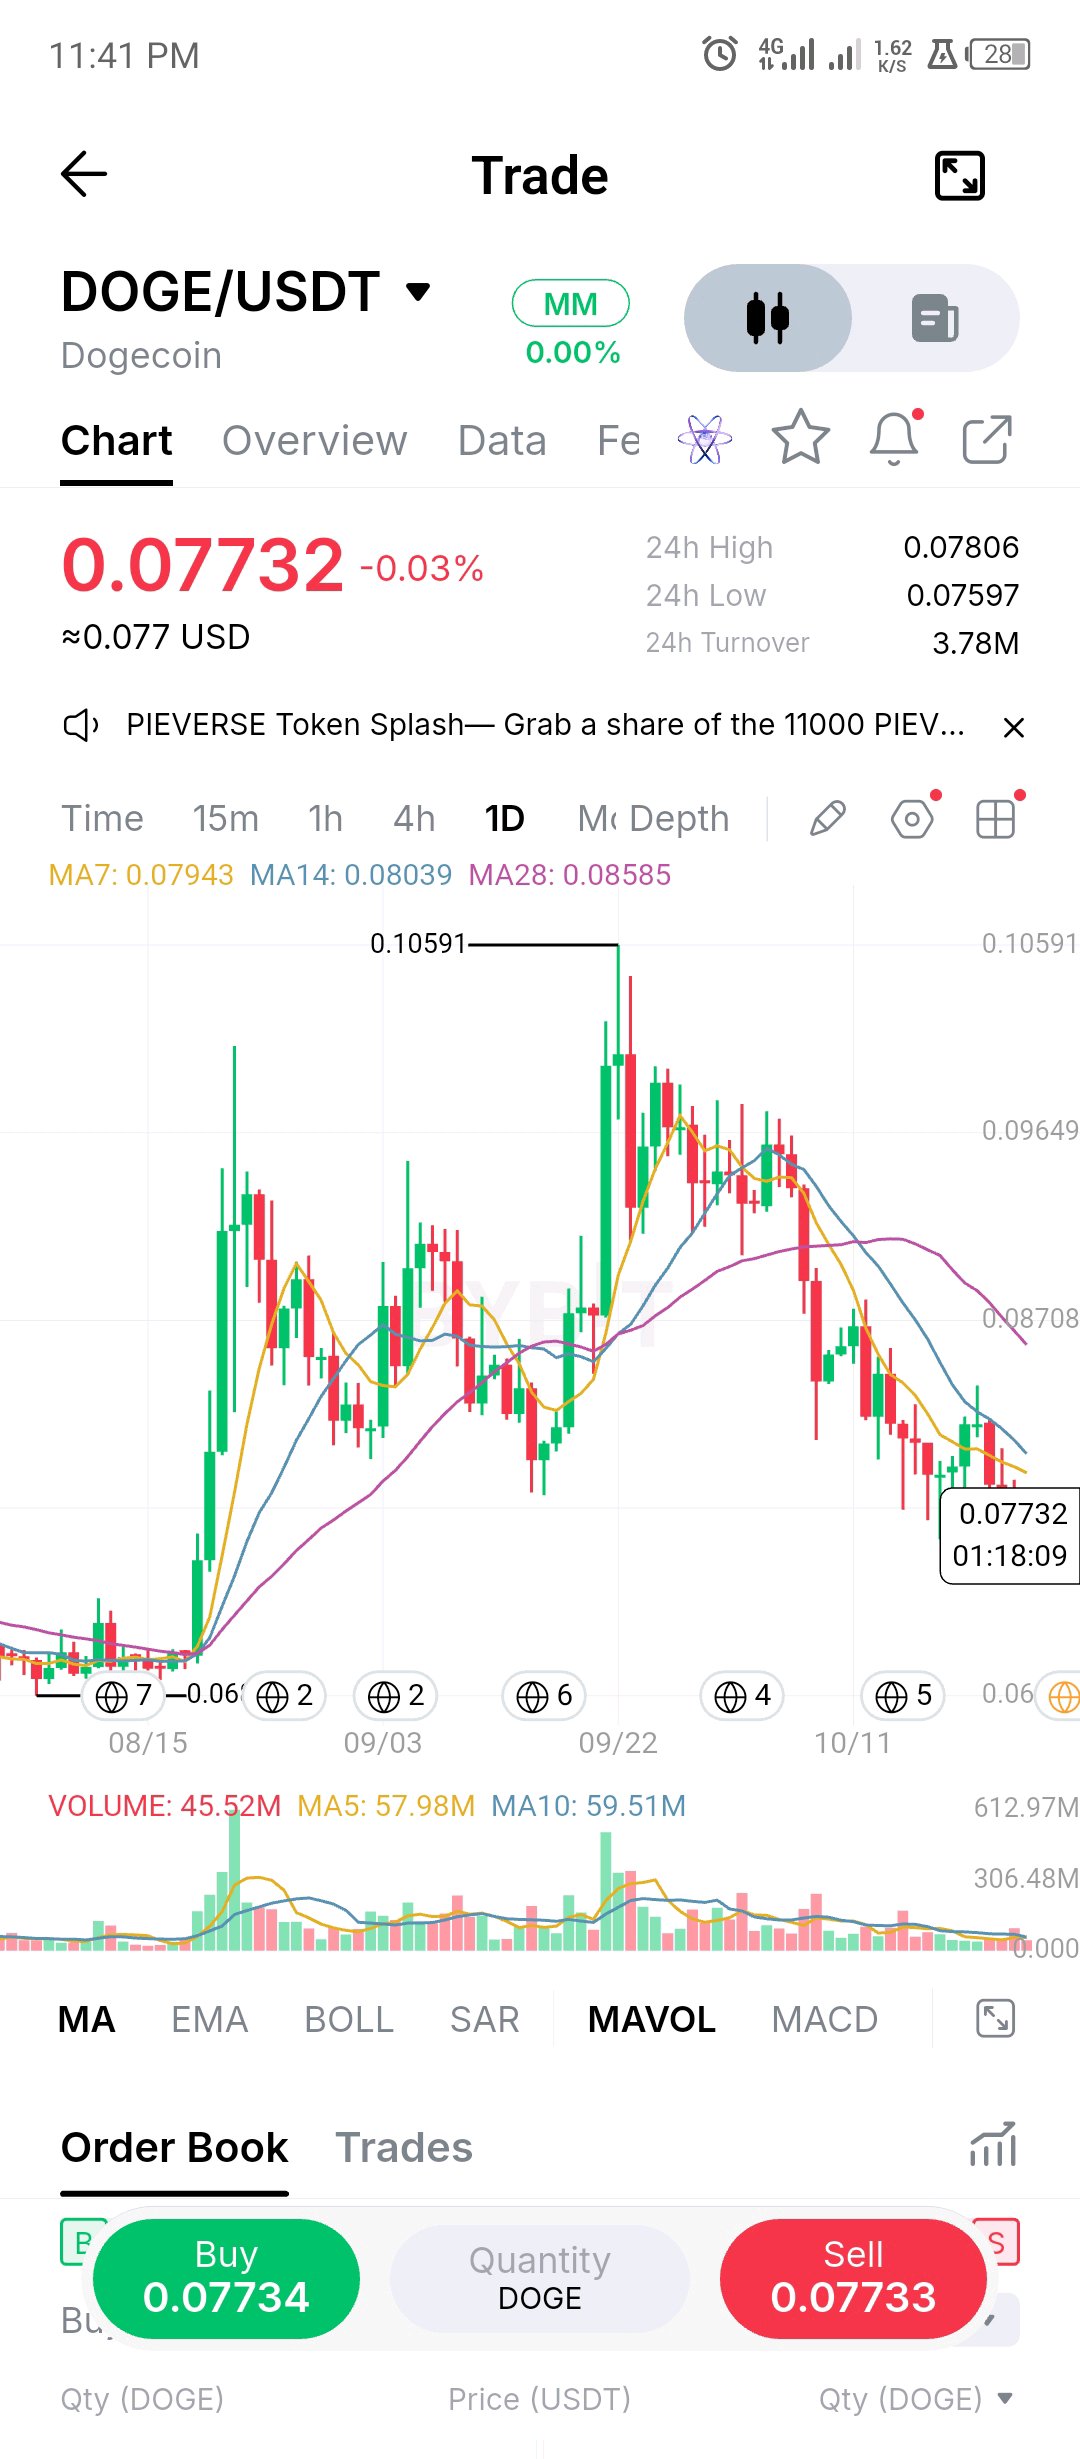
DOGE has gone quiet, and quiet after a 27% slide from 0.106 is worth paying attention to. Today's range is under 3%, daily candles have shrunk, and volume is running below its 5 and 10 day averages. Selling pressure is fading, but fading isn't the same as buyers arriving. Price is still under all three MAs, stacked bearish (7 below 14 below 28) and all pointing down. Overhead, the 0.079 to 0.080 zone is where the 7 and 14 day MAs sit, and also where early September lows held. Former support, now supply. I'm not trying to call the bottom. A daily close back over 0.080 on rising volume would be the first real sign. Lose today's 0.076 low and there's not much structure until the 0.06s. $DOGEUSDT #ByXIMPACT
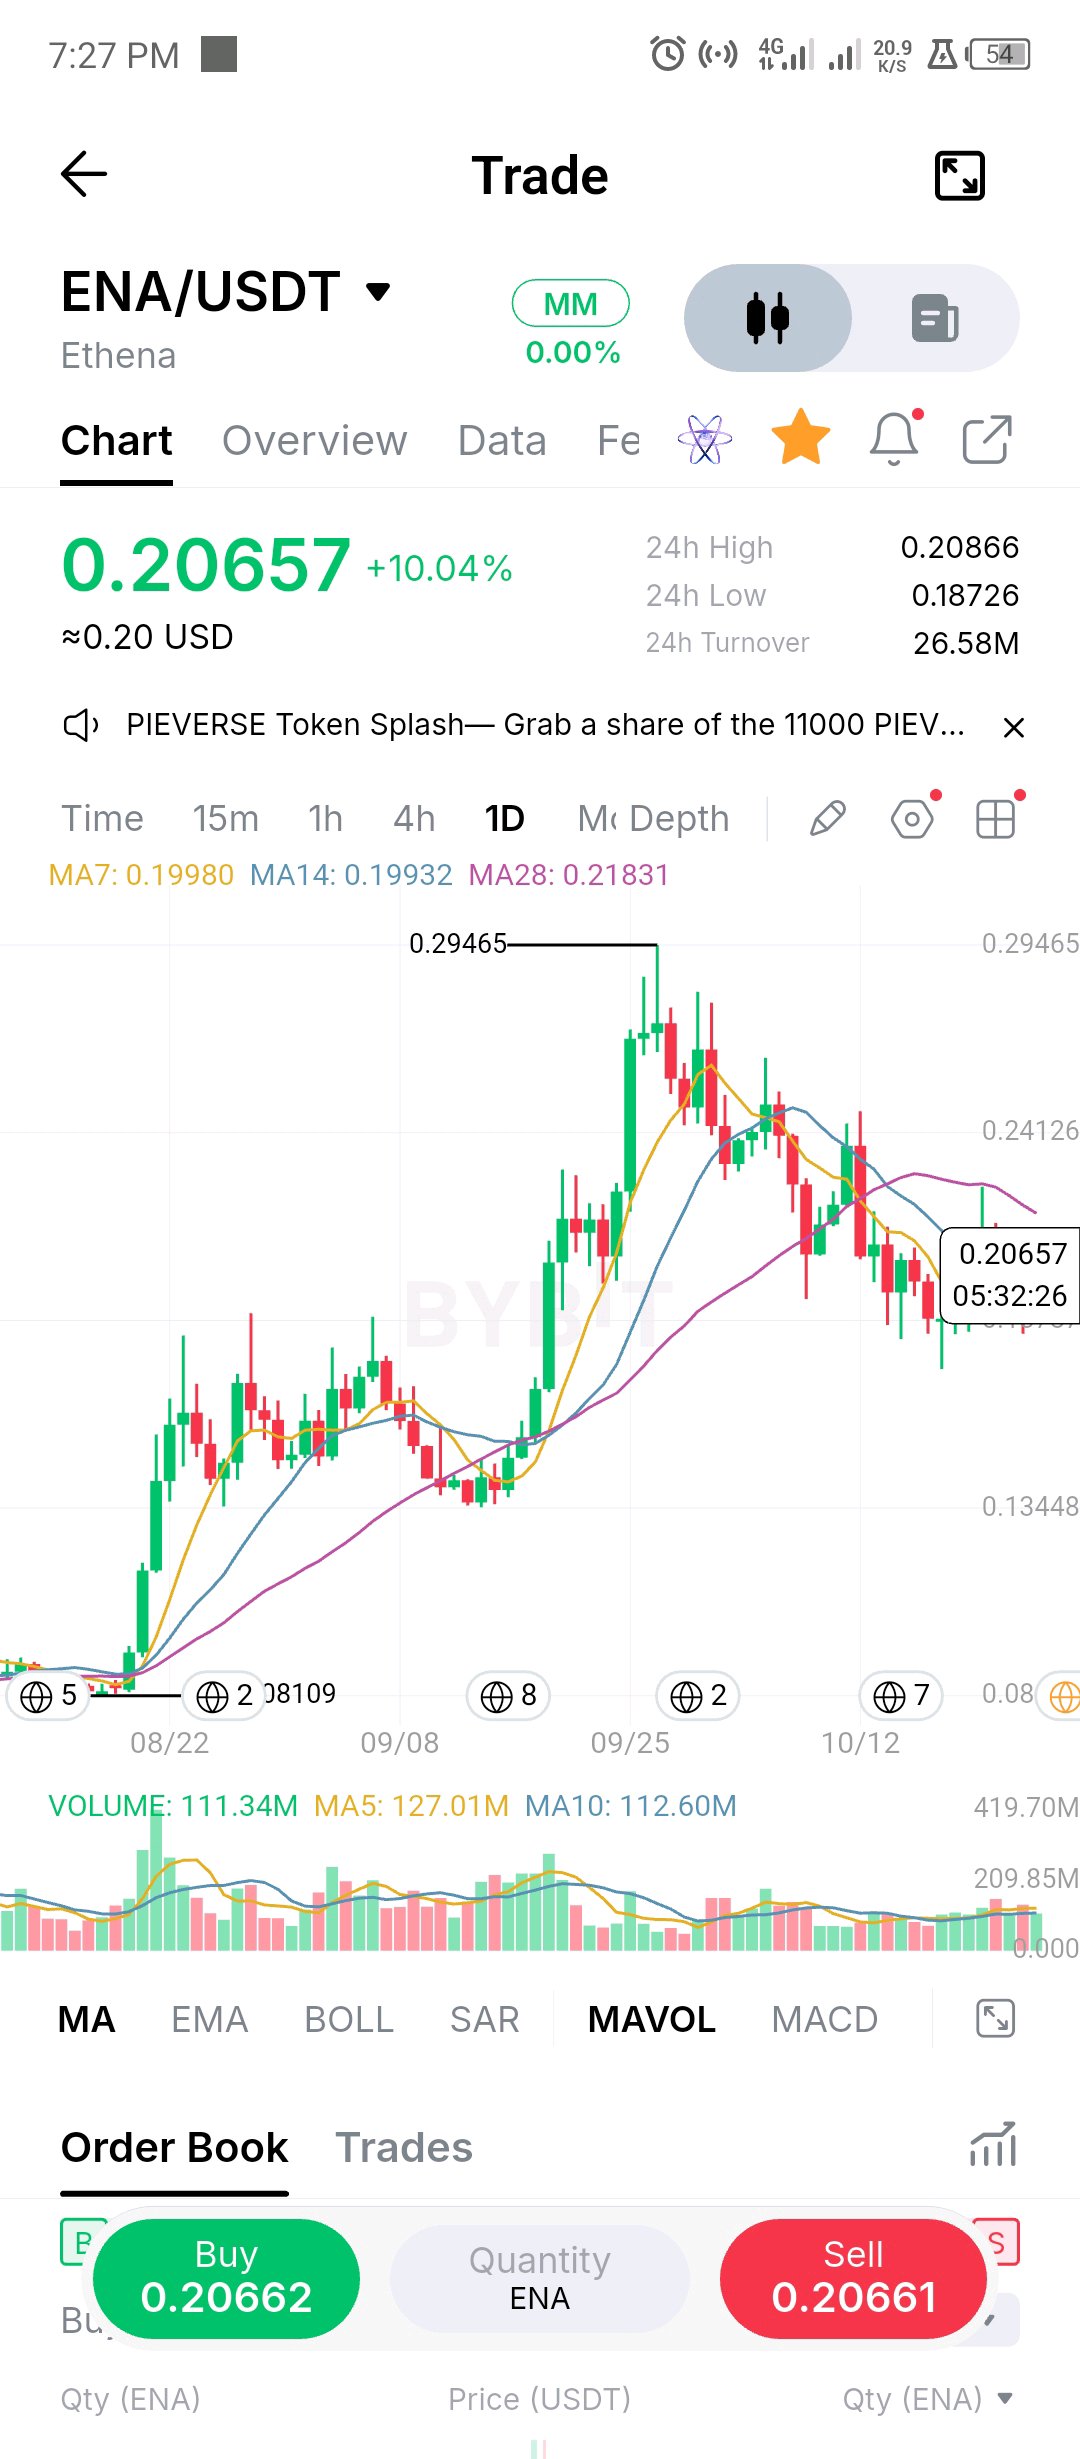
A +10% daily candle on ENA looks like a reversal. It might become one, but it hasn't earned that label yet. Price has pushed back above the 7 and 14 day MAs (both around 0.199), but the 28 day sits overhead at 0.218 and is still sloping down from the 0.29 top. That's the real test, not today's green candle. Volume so far is average rather than a surge, and the daily still has hours left to close. A close above 0.218 changes my view. A rejection there and I'd expect a revisit of the 0.19 area, with the swing low in the 0.17s behind it. $ENAUSDT #ByXIMPACT
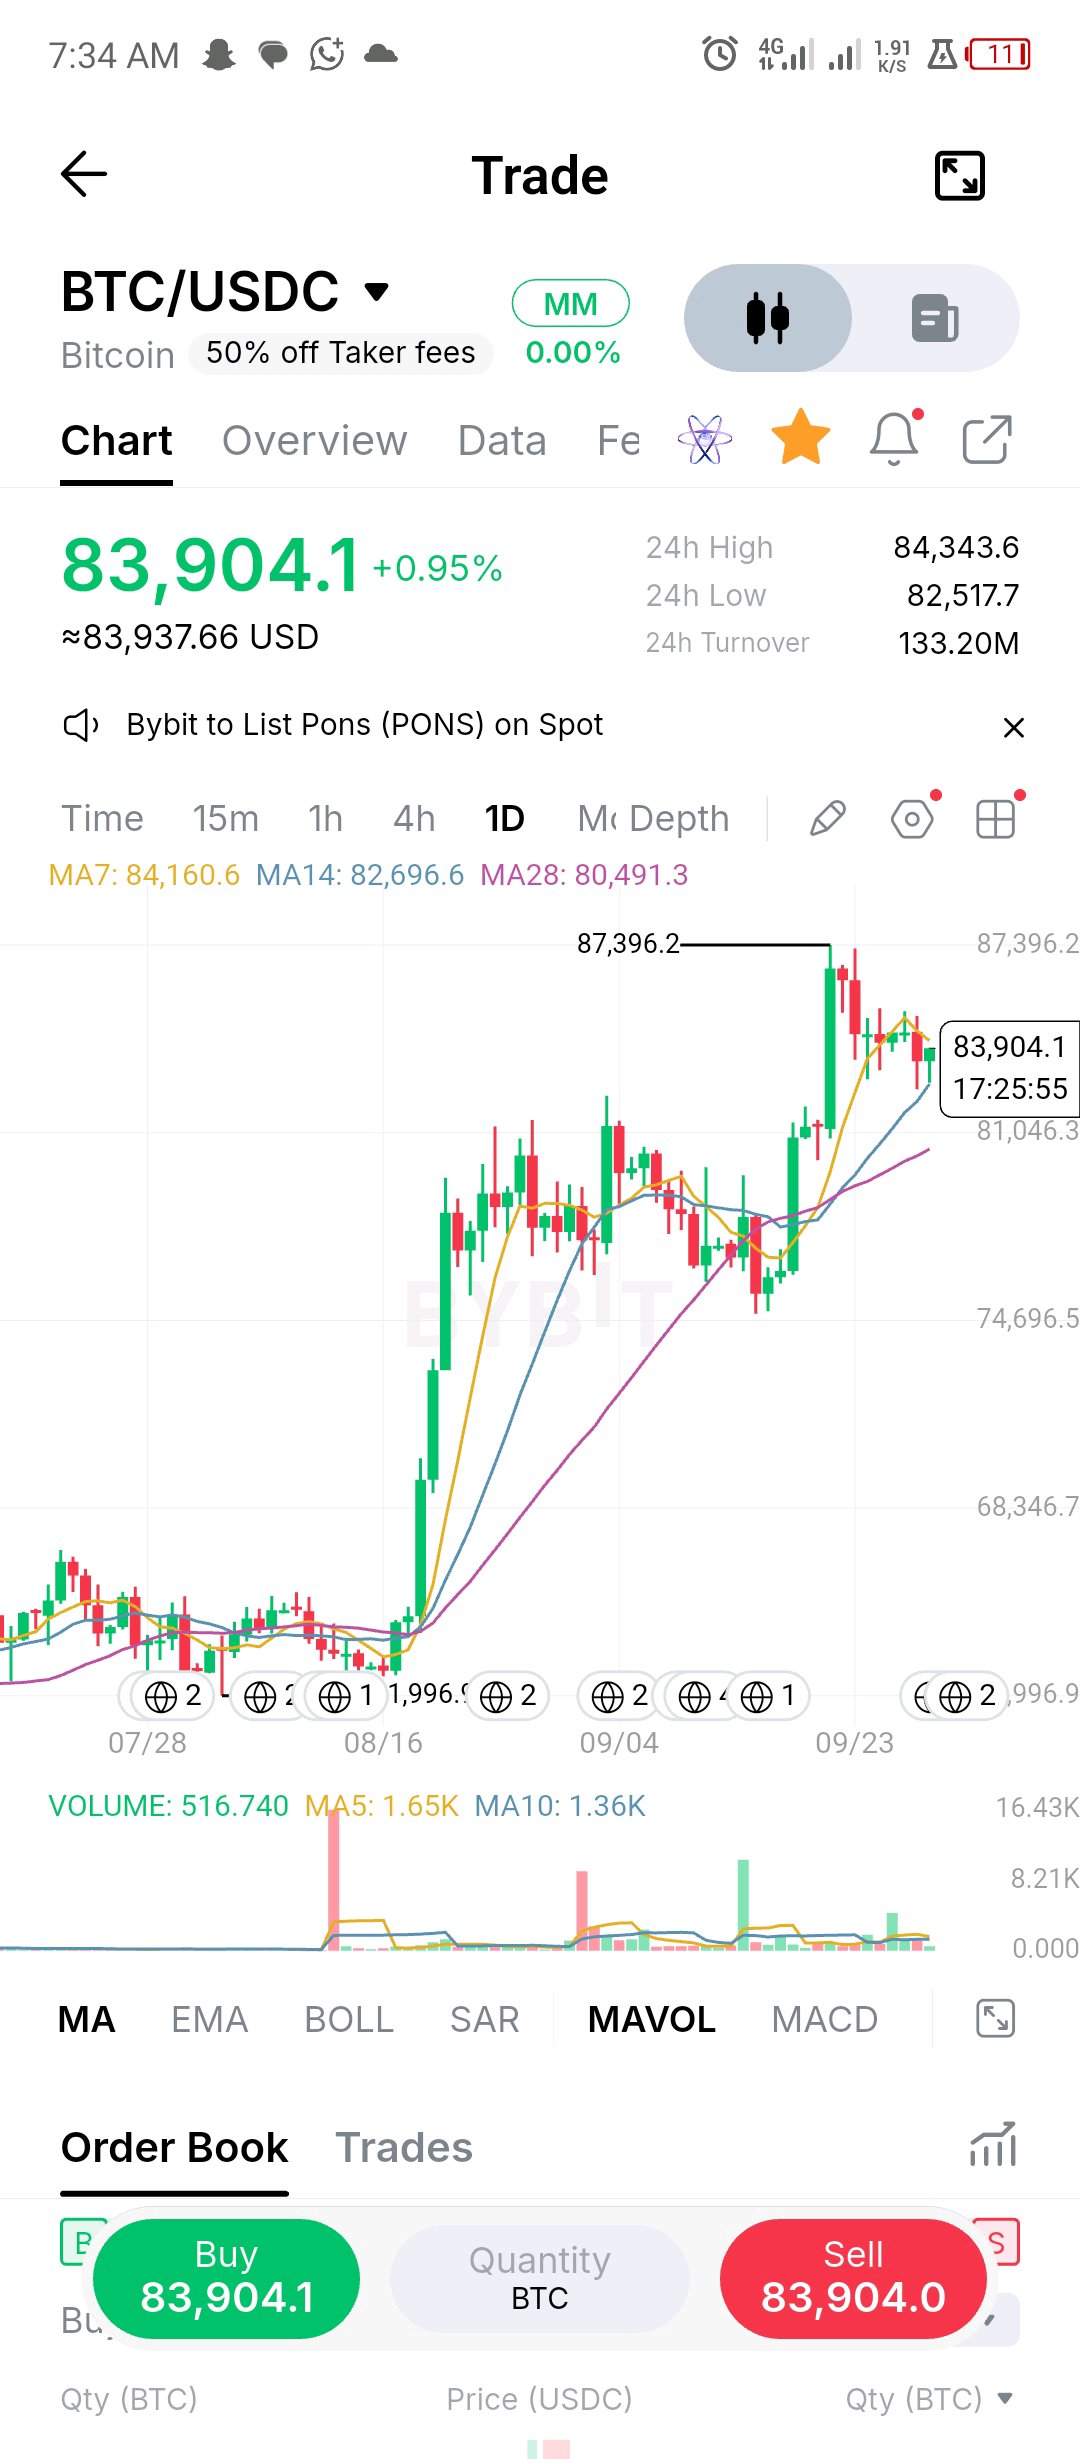
BTC/USDC: HOLDING THE 14-DAY MA AFTER THE 87K REJECTION BTC ran from the 63K base to 87,396 almost in one push, got sold hard at the top, and is now digesting around 83.9K. The pullback has been orderly. Price sits just under the MA7 (84,160) and still above the MA14 (82,696) and MA28 (80,491), all three rising. This reads as a correction inside an uptrend, not a trend change, at least not yet. The heaviest volume on the whole chart printed on the 87K rejection candle, so real supply showed up there. Selling volume has faded since. 24h turnover is 133.20M, and today's daily bar is well under its 5 and 10-day averages (516 vs 1.65K and 1.36K), but that candle is still open so I won't lean on it. Quiet pullback is healthy, though the bounce isn't being bought with conviction either. 82,500-82,700. The MA14 sits right on top of the 24h low (82,517). This is the zone that decides the daily trend. Support: 82,517 / 82,700, then 81,000, then MA28 near 80,500. Resistance: MA7 at 84,160, the 24h high at 84,343, then the 87,396 top. I'm not chasing the middle of this range. Continuation long on a daily close above 84,350 with volume expanding, targeting 87K. The lower-risk entry is a retest of 82.5-82.7K that holds with a rejection wick. Take partials near 86-87K since sellers already showed their hand there. A daily close below 82,500 loses the MA14 and opens 81K, then 80.5K. Below the MA28 the bullish structure is broken and I step aside. The daily candle is still open, so size for a wick through either side. Fixed risk per trade, stop at the invalidation level, not at hope. $BTCUSDT #ByXIMPACT
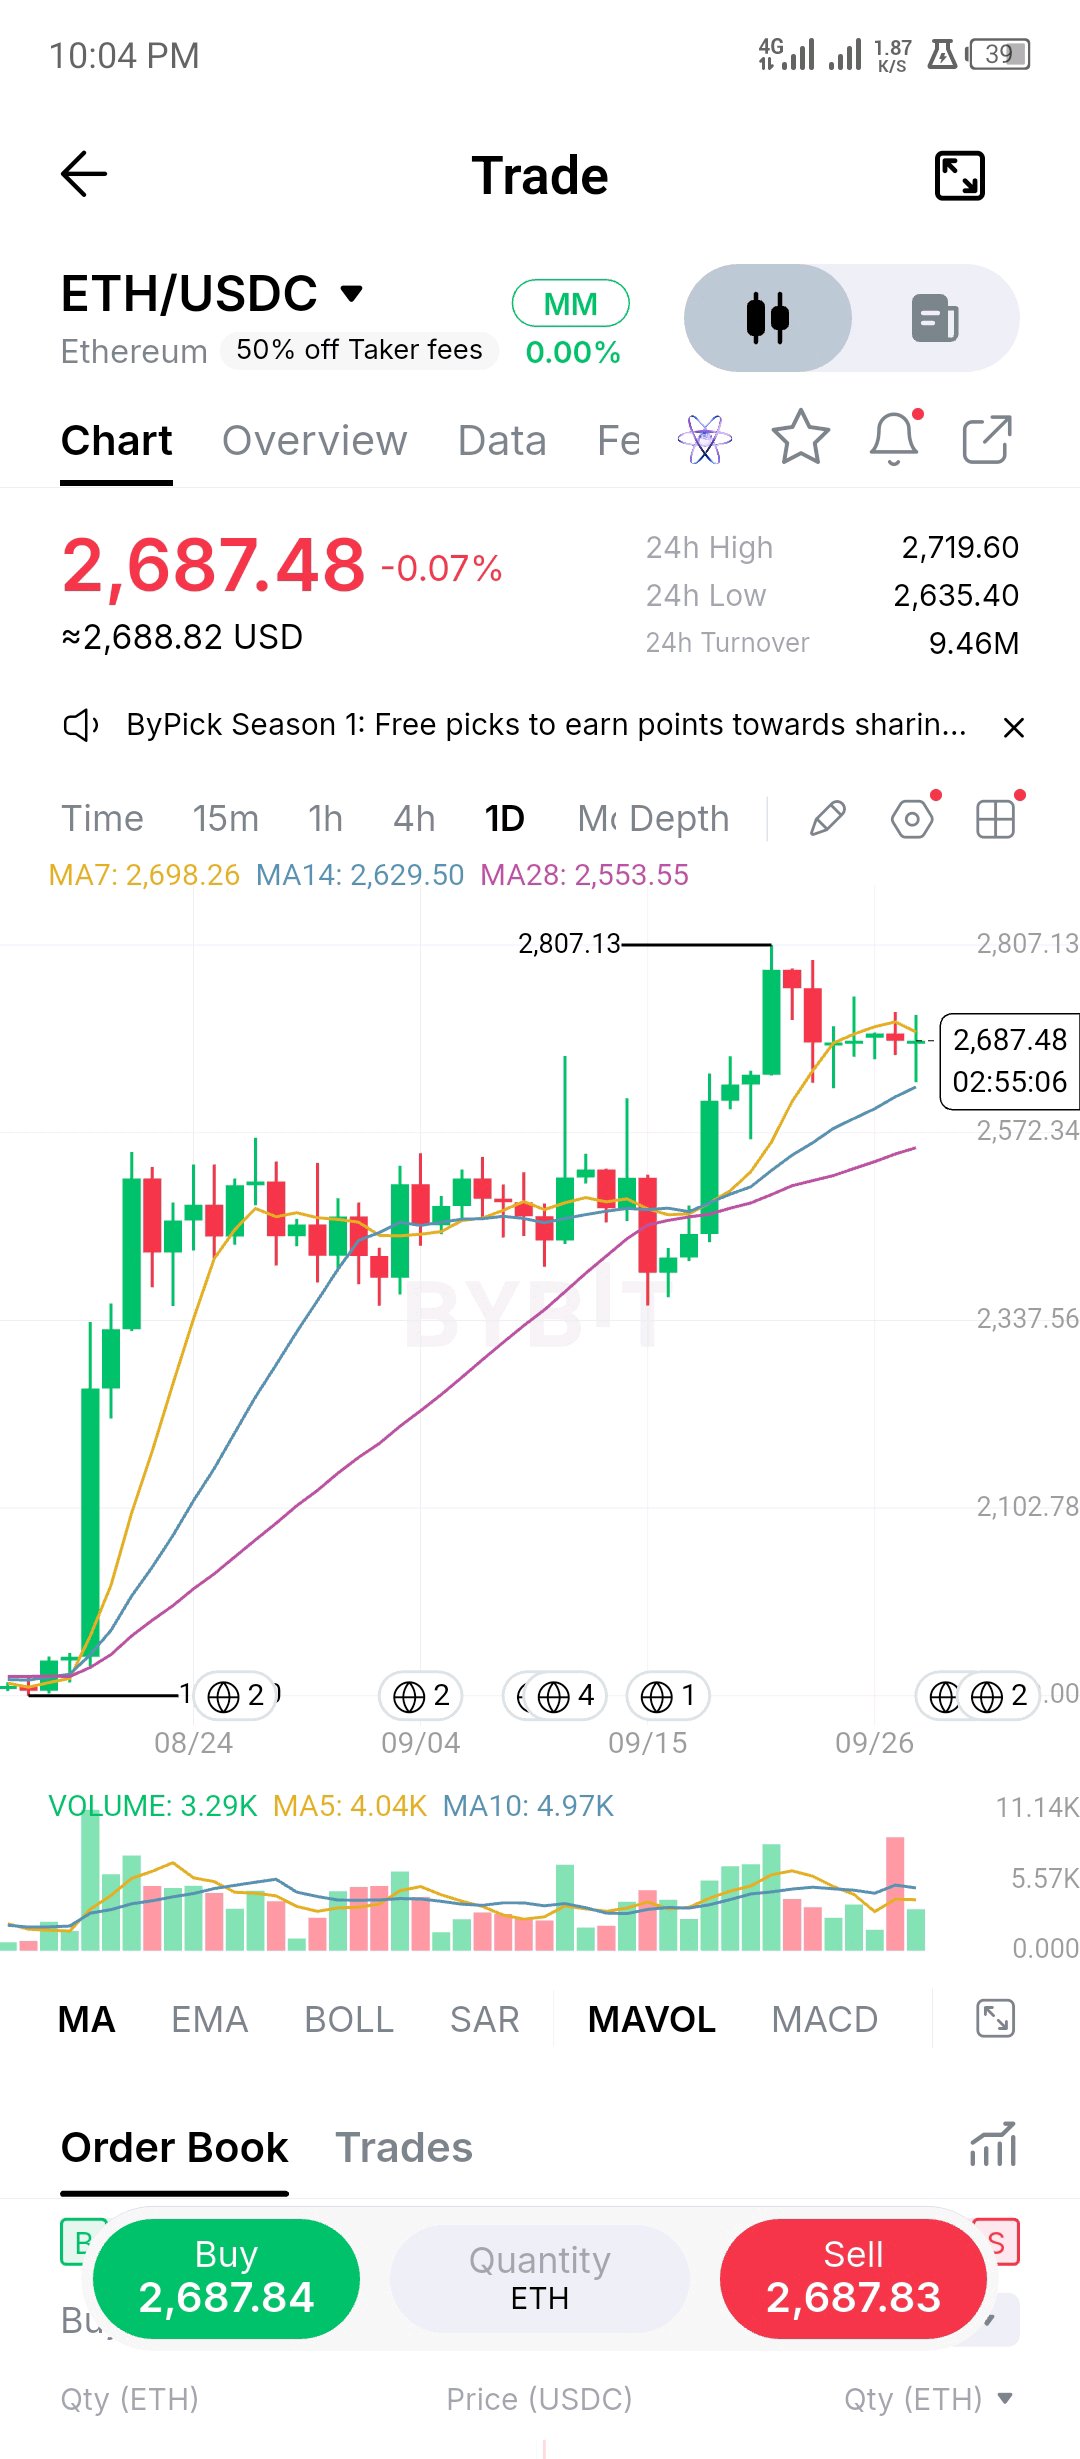
ETH HOLDING THE BREAKOUT BASE, BUT 2,720 IS THE GATE Consideration ETH ripped out of a long base and printed 2,807.13 before sellers stepped in. Since then the daily candles have shrunk to small bodies and dojis around 2,687. That looks more like digestion after an impulse than a top, as long as the higher lows stay intact. The last two red candles were rejections, not a breakdown. Volume and turnover The heavy volume sat on the breakout leg and on the first rejection candle. Today's volume is running under both the 5 and 10 day averages, and 24h turnover is about 9.46M. Sellers are not pressing and buyers are not chasing. Compression like this usually resolves with a volume expansion, so I want to see that before trusting either direction. Level to watch 2,719.60, the 24h high. It also lines up with where price keeps failing to close above the 7-day MA (2,698). A daily close above it changes the tone. Support and resistance Resistance: 2,719.60, then 2,807.13. Support: 2,635.40 (24h low), with the 14-day MA sitting just under it near 2,629. Below that the 28-day MA around 2,553 is the next real floor. Trade plan I'm not chasing inside the range. Two setups: a daily close above 2,720 with volume picking up, targeting a retest of 2,807. Or a pullback into 2,630-2,640 that holds and bounces, for a long with a tight stop. If neither triggers, I stay flat. Invalidation A daily close below 2,629 puts the 14-day MA and the range low in the rearview, and the bullish structure is off. I'd step aside and reassess at the 28-day MA. Risk note Size for the range, not for the breakout you hope for. Small candles can turn into a fast move either way, so define the stop before entry. This is my read of the chart, not financial advice. $ETHUSDT #ByXIMPACT