Crypto Insights📊
📊 Crypto Analyst|BTC & Altcoins|I read the market, not the hype. Price Action|Market Structure High-Probability Setups Clean analysis, smart risk Management
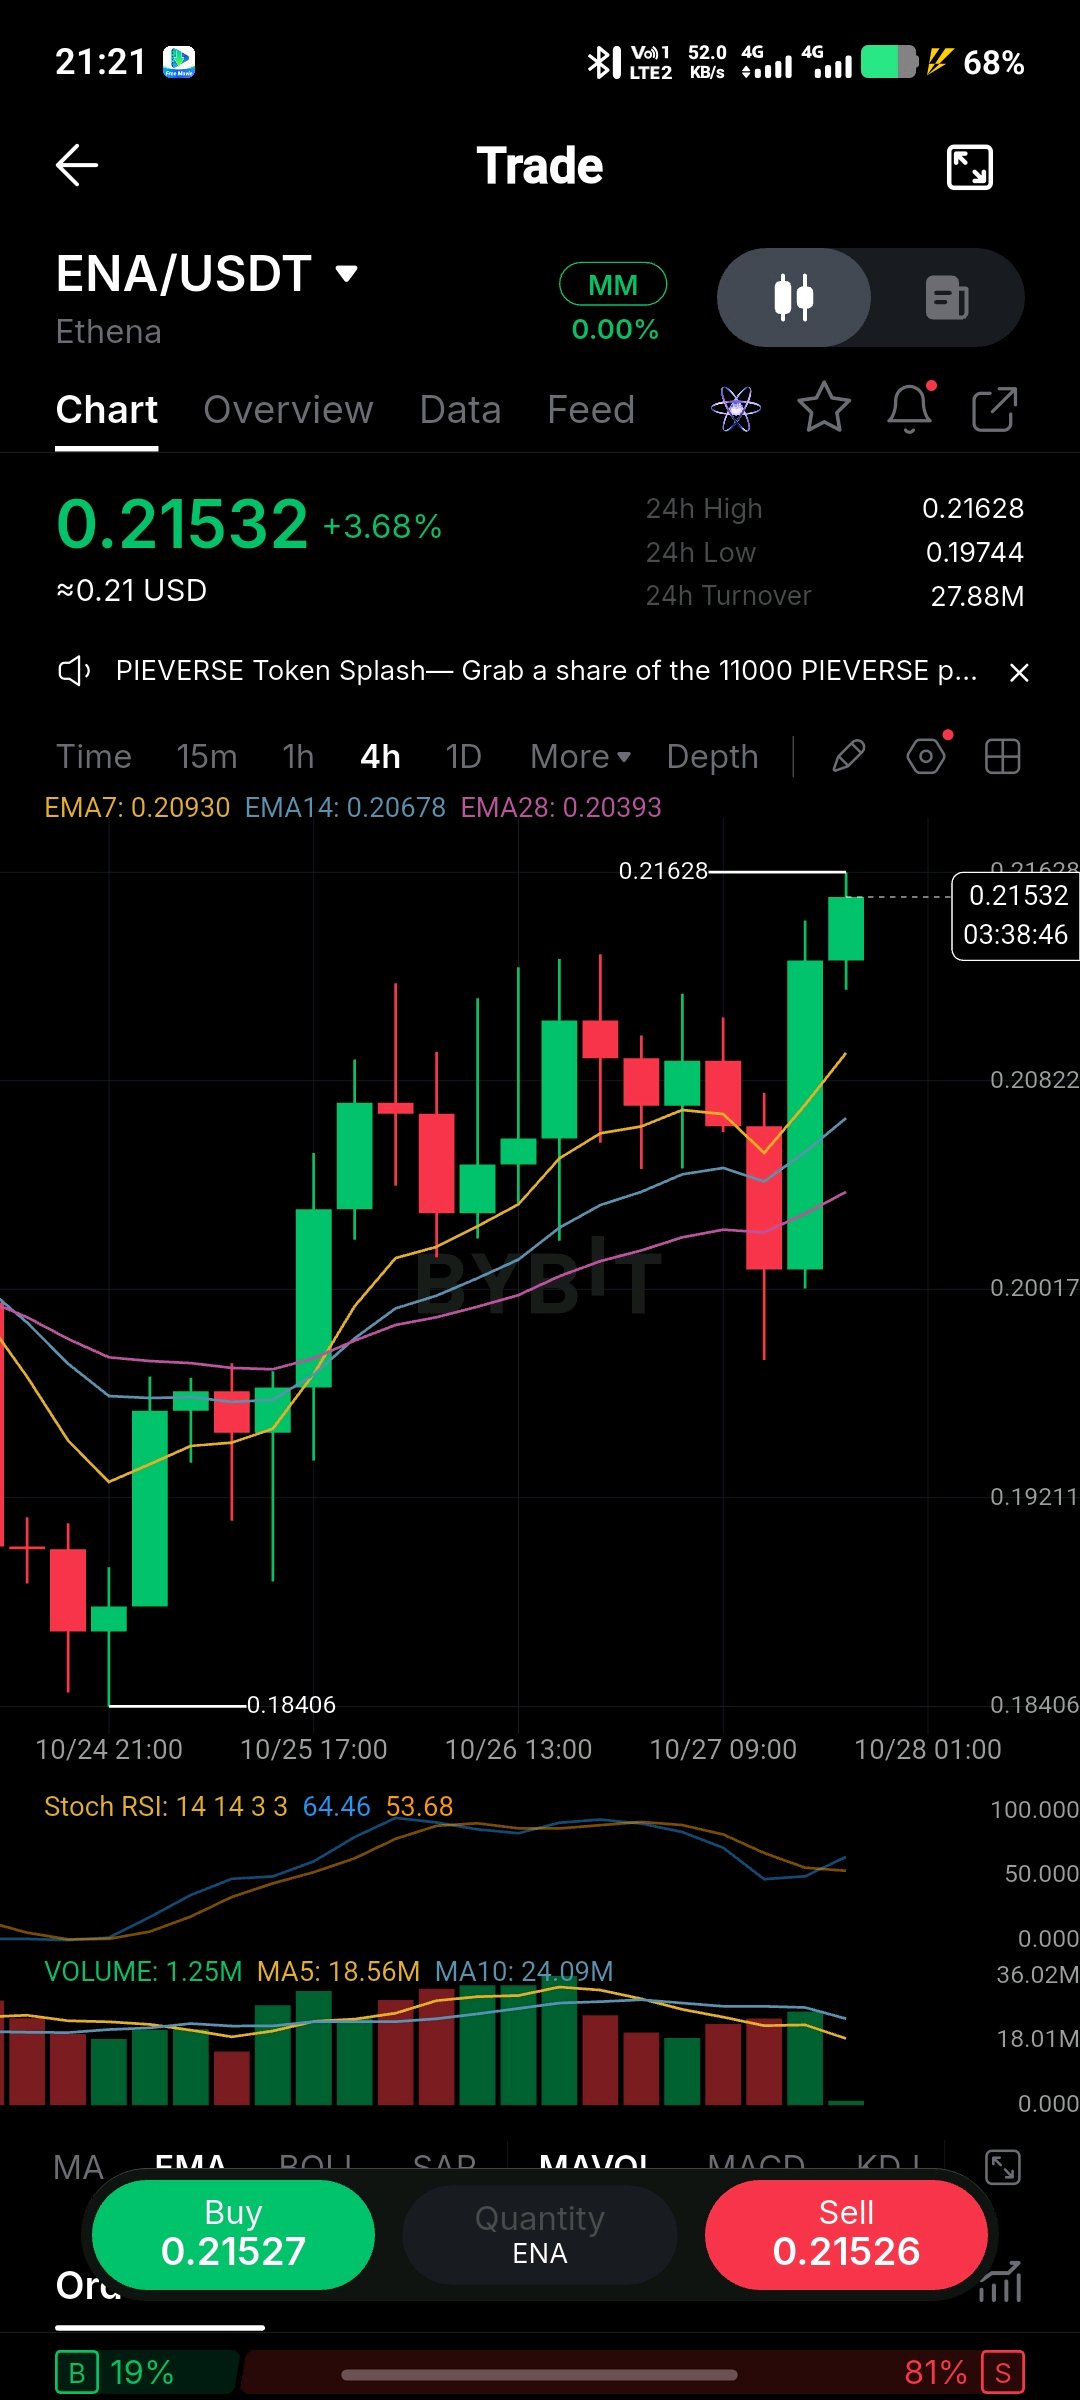
An explosive rebound is playing out after a deep shakeout, with price sprinting to 0.21532 (+3.68%) on the 4h as buyers reclaim control from the lows. Following a harsh drop that wicked to the 0.18406 structural base, momentum has flipped hard to challenge the 24h peak at 0.21628. Currently price is riding firmly above the 4h MA stack - MA28 at 0.20393, MA14 at 0.20678, and MA7 at 0.20930. Backed by $27.88M in 24h turnover, this sharp recovery setup suggests buyers are gearing up to clear the top and push into price discovery. TRADE PARAMETERS Pair: ENA/USDT (4h Timeframe) Bias: Bullish Momentum Continuation / V-Shape Recovery Buy Zone: 0.20678 to 0.21100 Stop Loss: 0.19850 (4h close below EMA28 baseline at 0.20393) PROFIT TARGETS Target 1: 0.21628 (Clearance of 24h high for risk-free shift) Target 2: 0.22100 (Breakout expansion above daily top) Target 3: 0.23500 (Full measured move from 0.18406 base) TECHNICAL CONFLUENCES - V-Shape Reversal Off Major Floor Massive bounce from 0.18406 low with strong green volume shows aggressive absorption and complete change in short-term sentiment. - Bullish EMA Reclaim Price pushed back above EMA7, EMA14 and EMA28 in one impulse, confirming short-term trend strength is back with buyers. - Momentum Reset With Volume Stoch RSI turning up at 64.46 / 53.68 combined with rising volume bars points to fresh buying participation, not just a dead-cat bounce. RISK & EXECUTION PLAN Wait for a minor retest into the buy zone rather than chasing the spike. At Target 1, book partials and move Stop Loss to breakeven to lock a risk-free trade. #ByXIMPACT $ENAUSDT

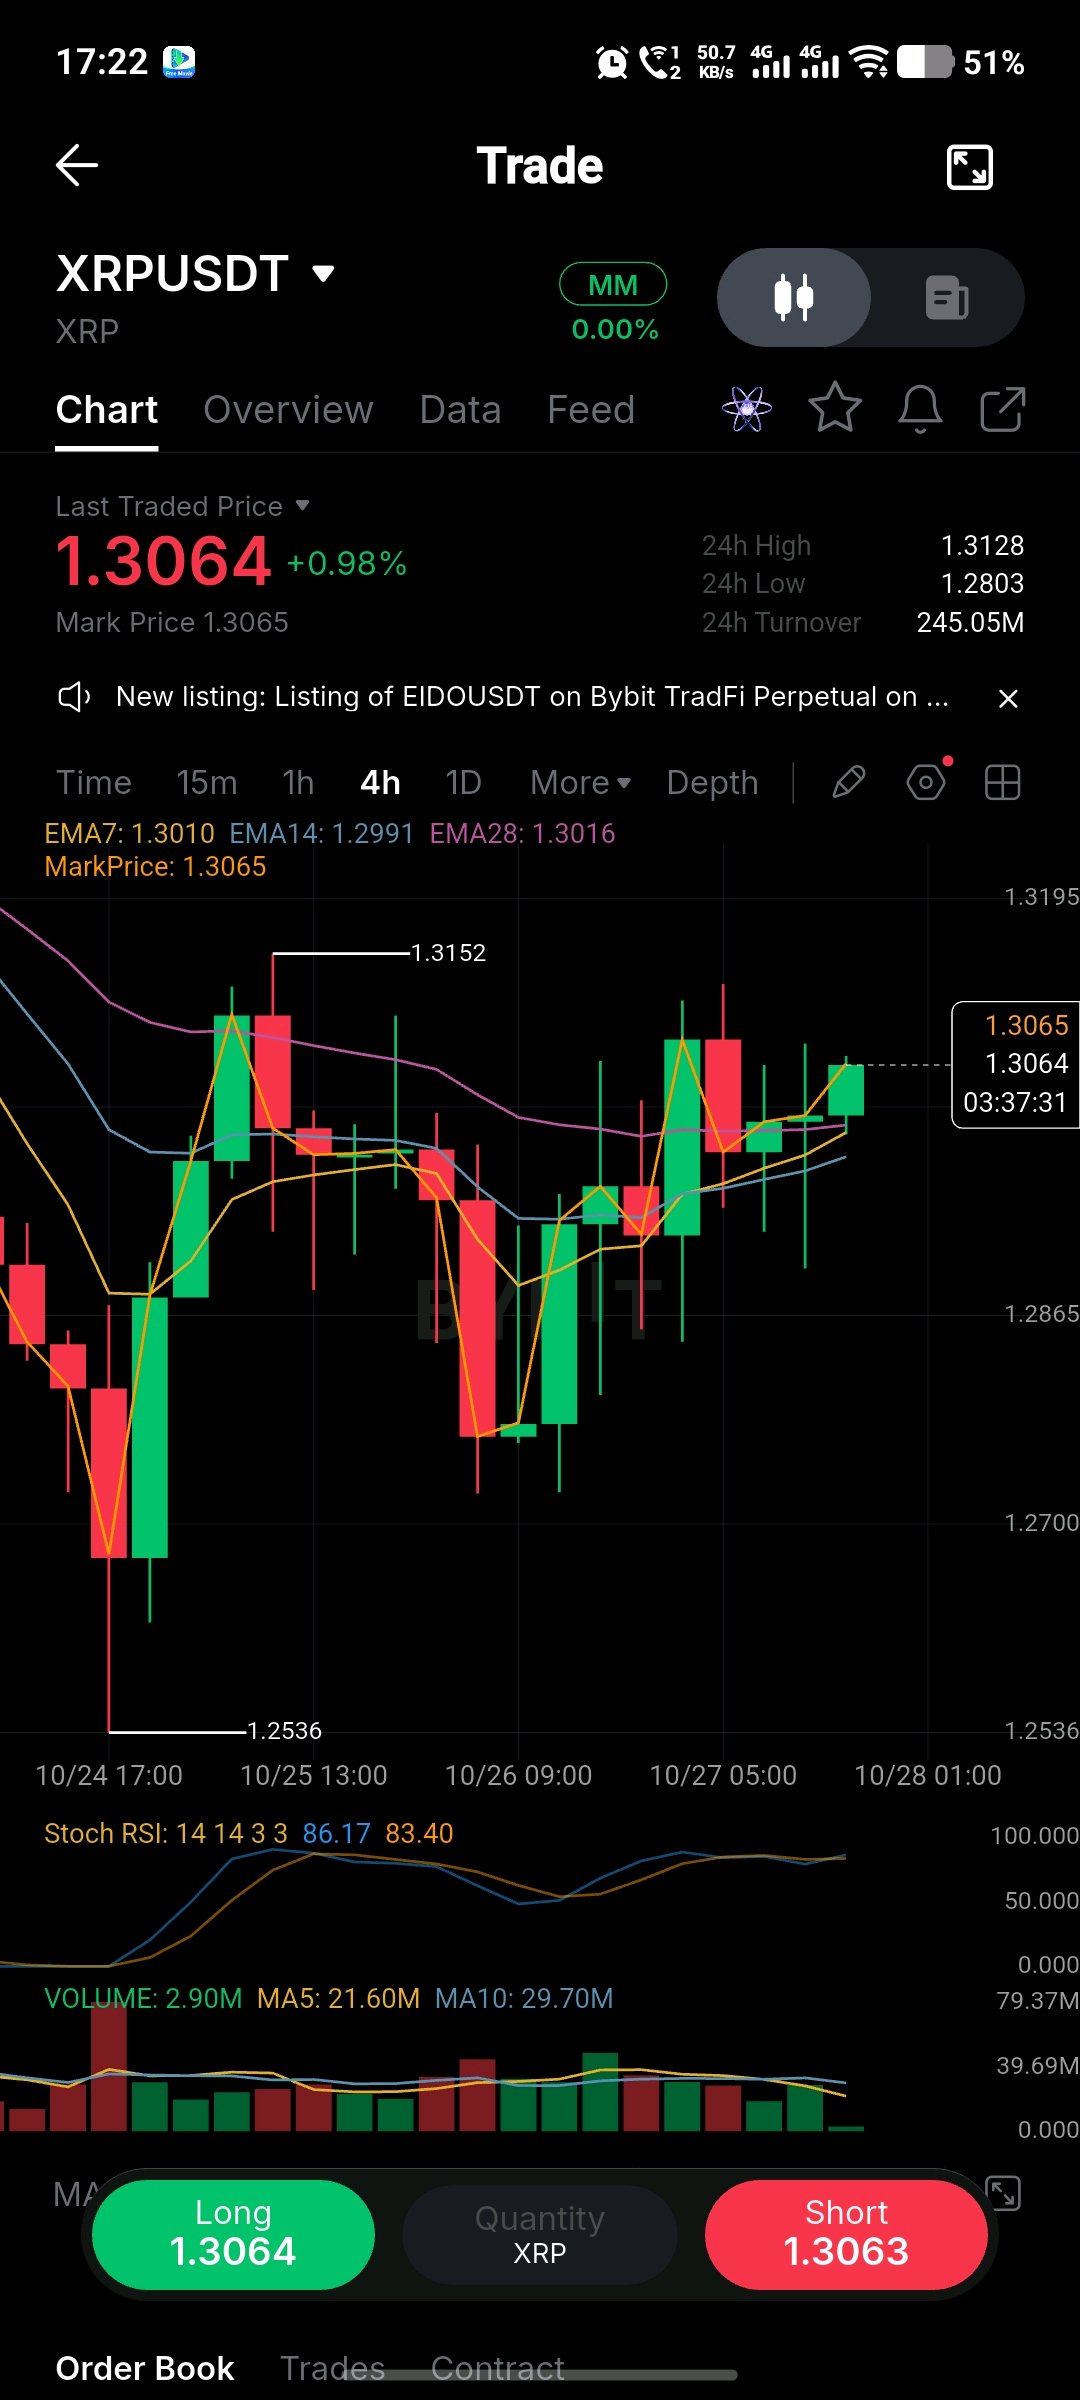
$XRPUSDT Market Update_ Currently momentum is building right near the 24h top at 1.3128, while price keeps floating above MA7, MA14 and MA28 cluster. Strength is clearly with buyers, but you know the drill: jumping into a vertical green bar with zero retest is a quick way to get trapped. Let the market reset and look for a controlled dip. #ByXIMPACT 📍 Entry: 1.2991 - 1.3040 🎯 TP1: 1.3128 🎯 TP2: 1.3200 🎯 TP3: 1.3350 🛑 SL: 1.2910 If 4h closes clean below 1.2950, this bullish idea fails. Trade the chart, not the emotion. 🚀 #ByXIMPACT $XRPUSDT

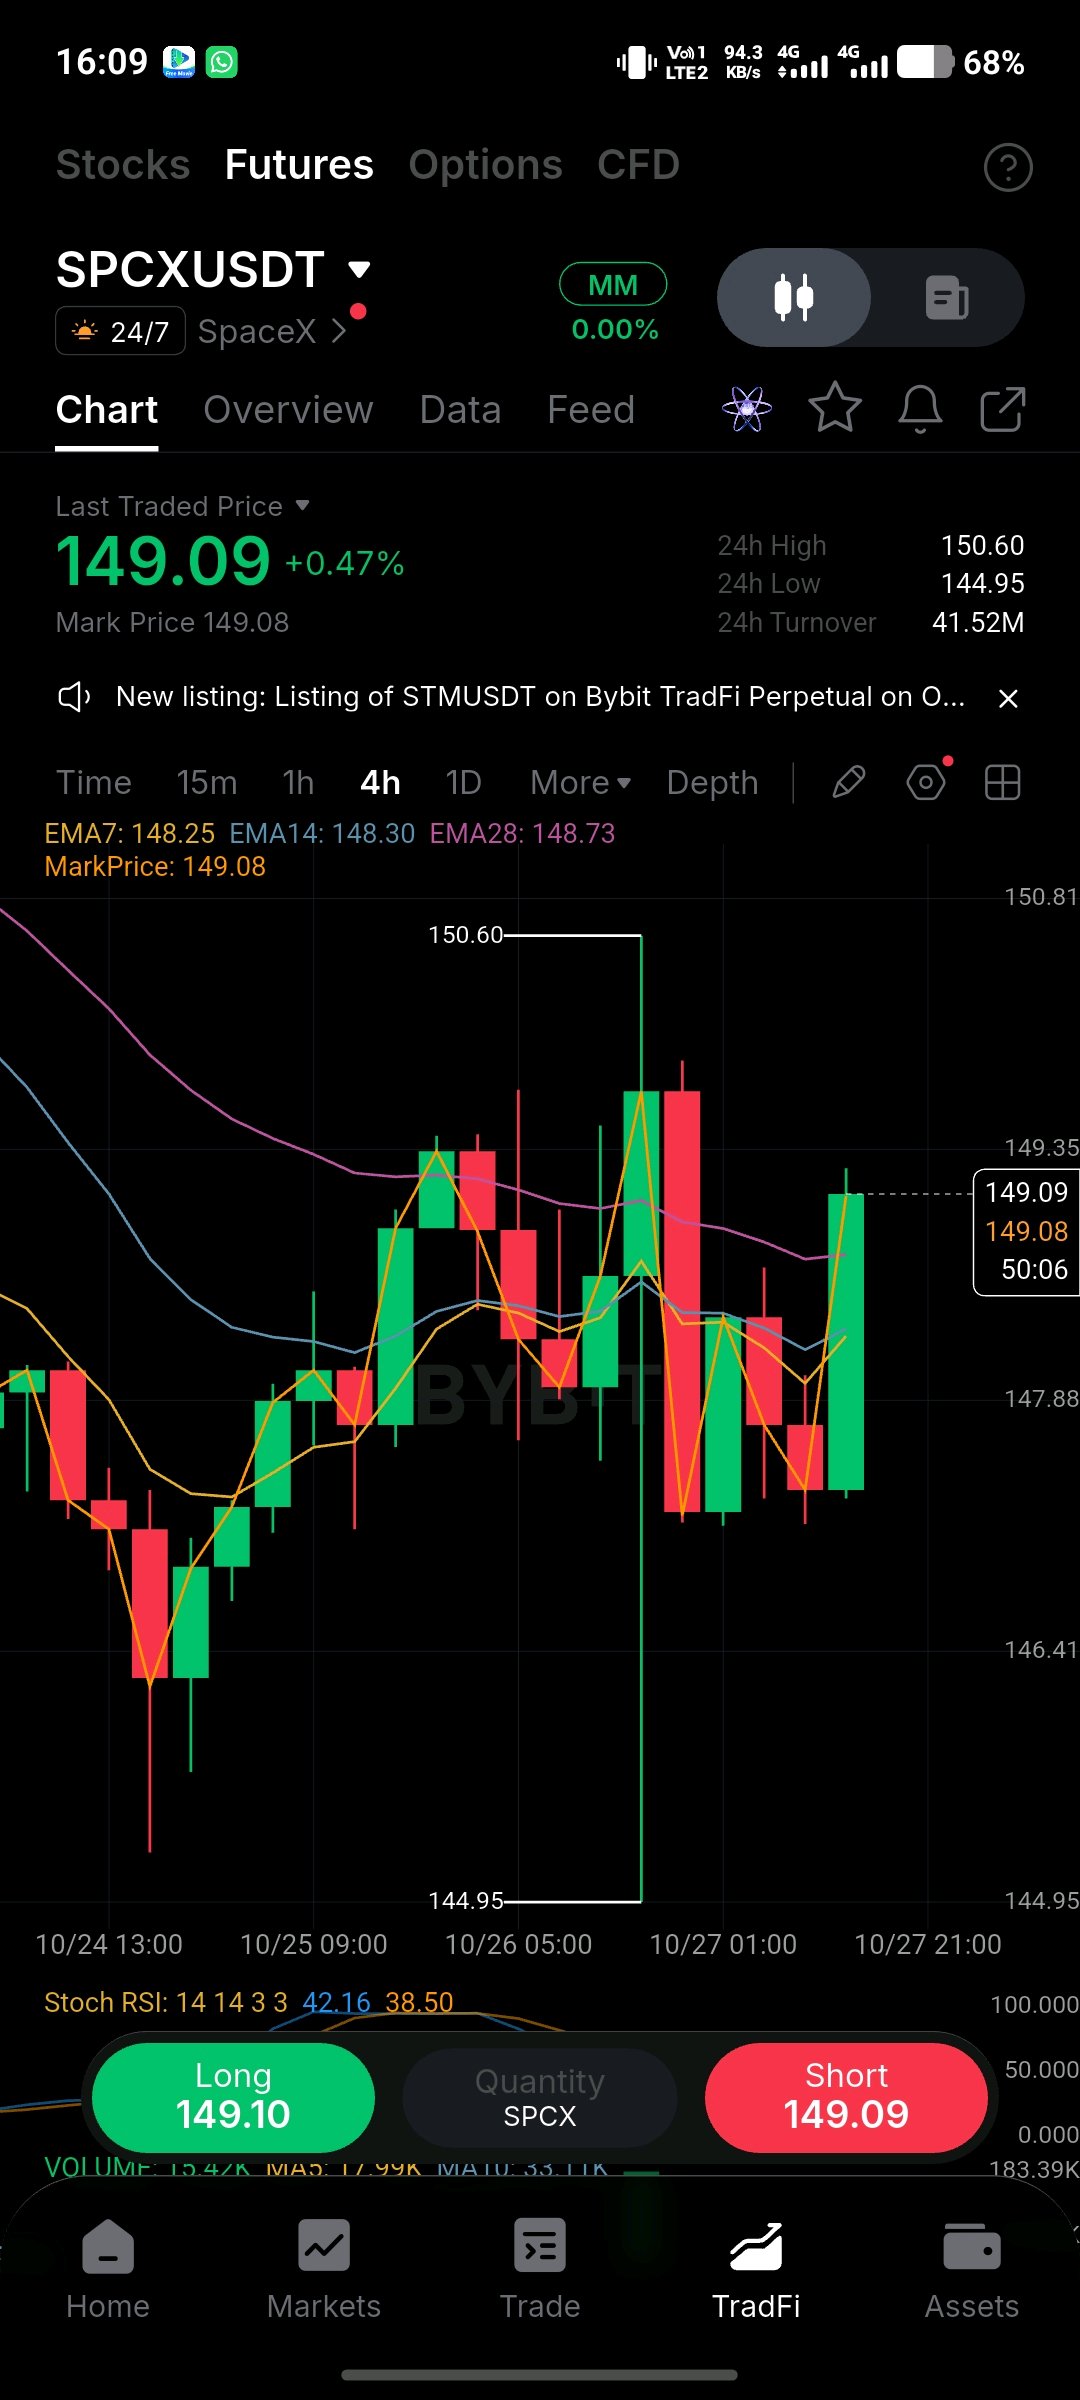
$SPCXXUSDT IS BACK ABOVE $149 — BUT THE $150.60 REJECTION STILL MATTERS $SPCXXUSDT is showing renewed buying interest on the 4H chart, recovering to $149.09 (+0.47%) after a sharp and volatile move toward the $144.95 low. The latest green candle has pushed price back above the short-term EMA cluster, putting buyers in a stronger position for now. But this is a recovery attempt, not a confirmed breakout yet. 📊 What the chart is telling us - EMA7: $148.25 - EMA14: $148.30 - EMA28: $148.73 - Stoch RSI: 42.16 / 38.50 - Resistance: $149.35, then $150.60 - Support: $147.00–$147.50, followed by $146.40 The short-term momentum is improving as Stoch RSI turns upward, while price has reclaimed all three EMAs. However, the moving averages remain tightly grouped, suggesting the market is still deciding its next direction. The previous rejection near $150.60 is the key obstacle bulls need to overcome. 🎯 My game plan Bullish continuation: A sustained 4H close above $149.35 could open a retest of $150.60. A convincing breakout may extend toward $151.50–$152.00. Pullback opportunity: If price loses $148.25–$148.70, watch $147.00–$147.50 for a potential reaction. A deeper breakdown could expose $146.40 and, if selling accelerates, $144.95. Risk control: Avoid chasing the current green candle. Wait for a confirmed breakout or a controlled retest, and define invalidation before entering. SPCX is a tokenized SpaceX-related market instrument on Bybit, so liquidity and tracking risks deserve extra attention. 💬 Would you trade the reclaim toward $150.60, or wait for SPCX to retest $147.50 first? #ByXIMPACT $SPCXXUSDT

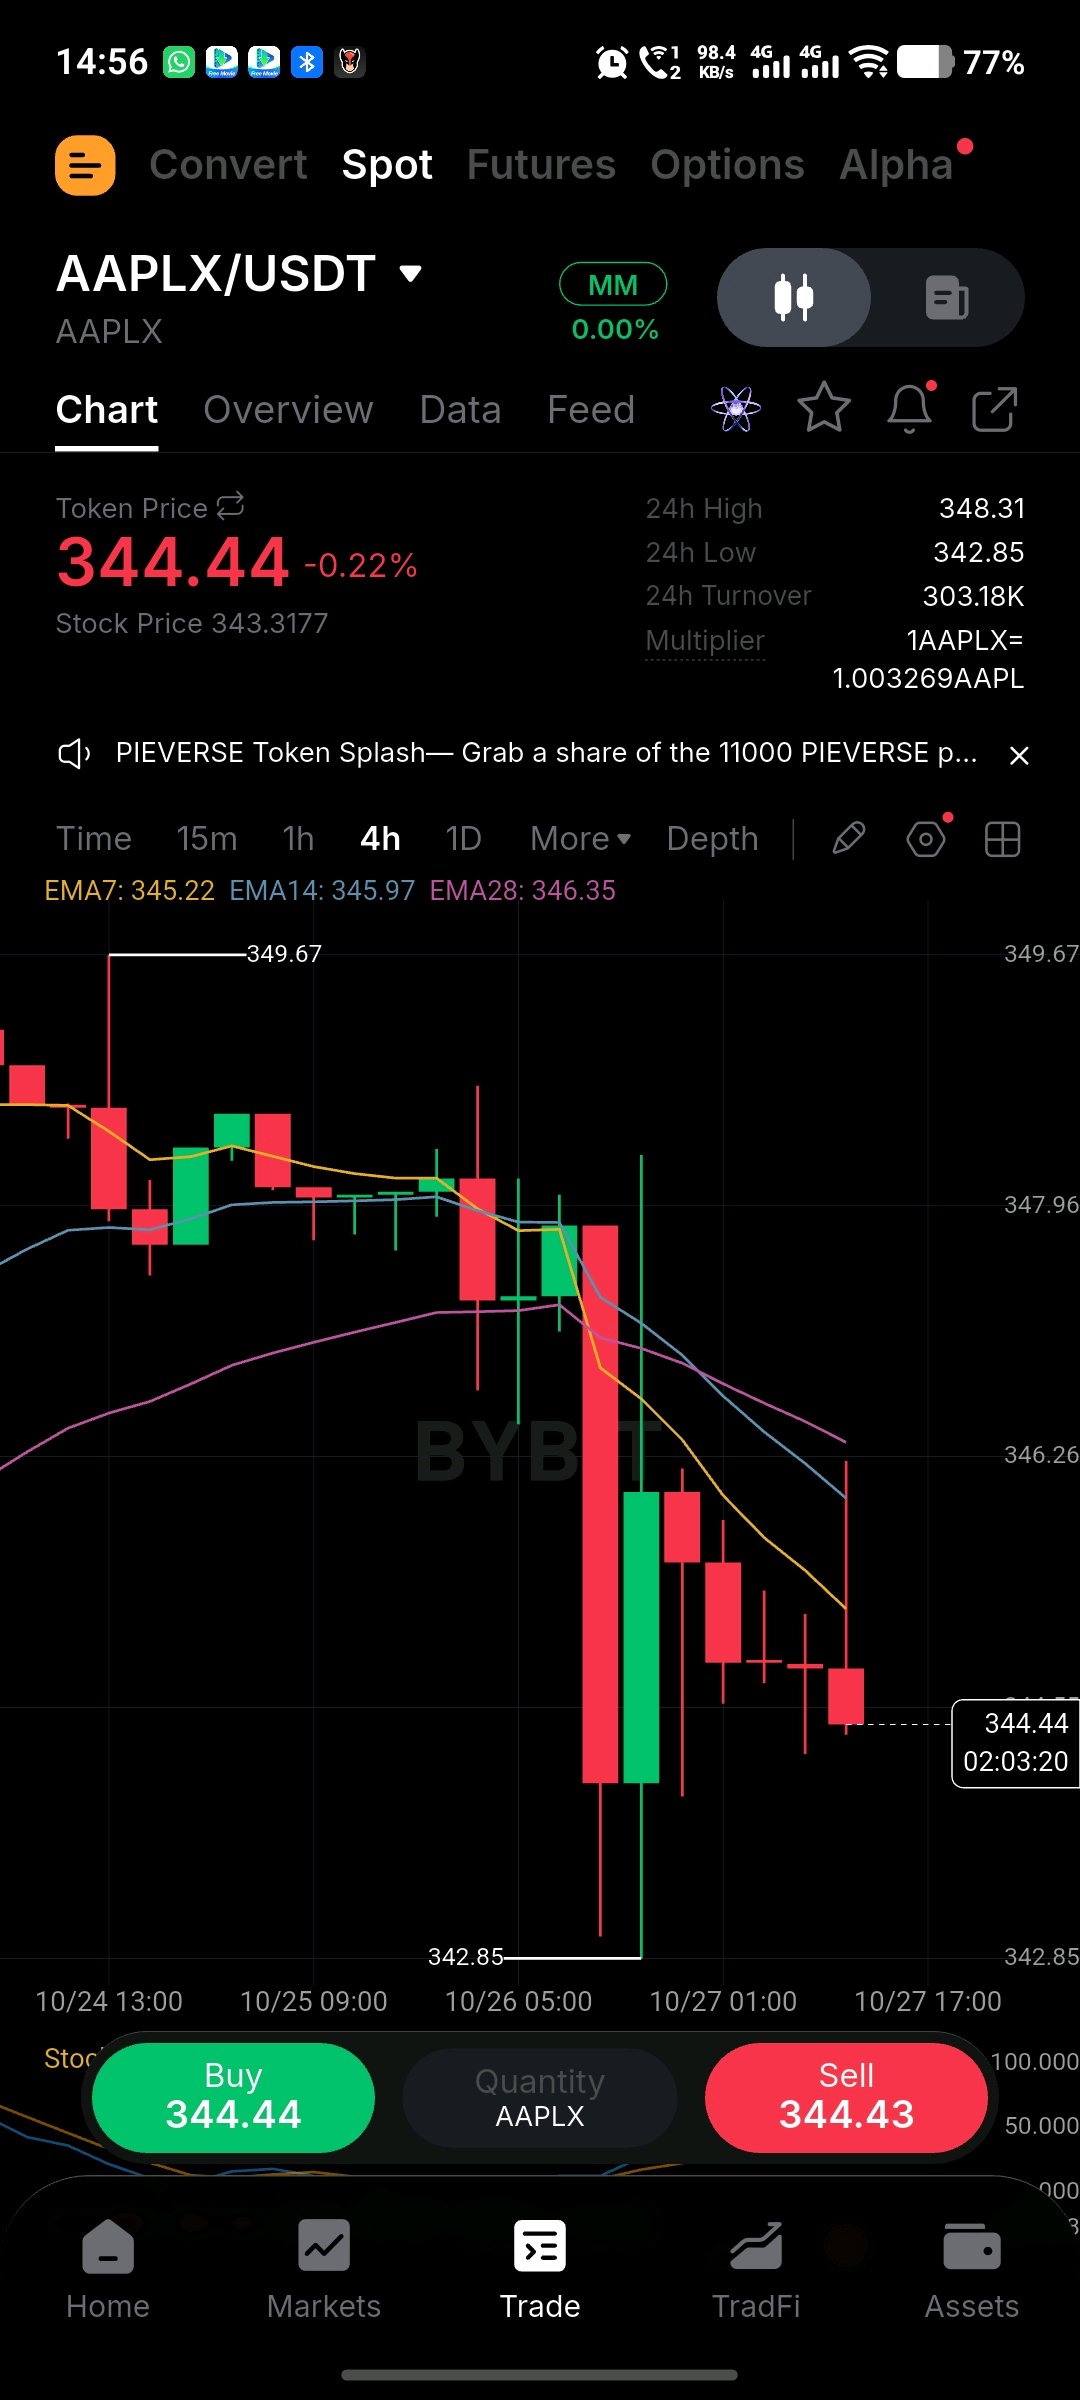
After that heavy drop from 349.67 to 342.85, price is trying to stabilize just below EMA cluster, buyers need to step in soon 👀 Buy setup I'm watching for this stock token, $AAPLXUSDT at 344.44 -0.22% , Stock Price 343.3177, 24h High 348.31 Low 342.85, Turnover 303.18K, Multiplier 1AAPLX = 1.003269 AAPL. 🟢 Buy Setup A: ~ Entry: 342.85 - 343.50 zone on strong reversal wick or 4h close above 344.00 ~ SL: Below 342.30 ~ Target 1: 345.22 EMA7, Target 2: 345.97 EMA14, Target 3: 346.35 EMA28 🟢 Buy Setup B - Trend flip: ~ Entry: Break and retest above 346.35 EMA28 ~ SL: 345.22 ~ Target: 348.31 24h High, then 349.67 📊 Context: ~ EMA7 345.22 , EMA14 345.97 , EMA28 346.35 all above price 344.44 - downtrend short term, so first setup is counter trend scalp, second is trend reversal ~ Last breakdown swept liquidity at 342.85 with long wick, shows buyers defended low once, could double bottom ~ Current price 344.44 needs to hold above 343.50 to keep bounce alive Risk: Below 342.85 invalidates quick longs. #ByXIMPACT $AAPLXUSDT

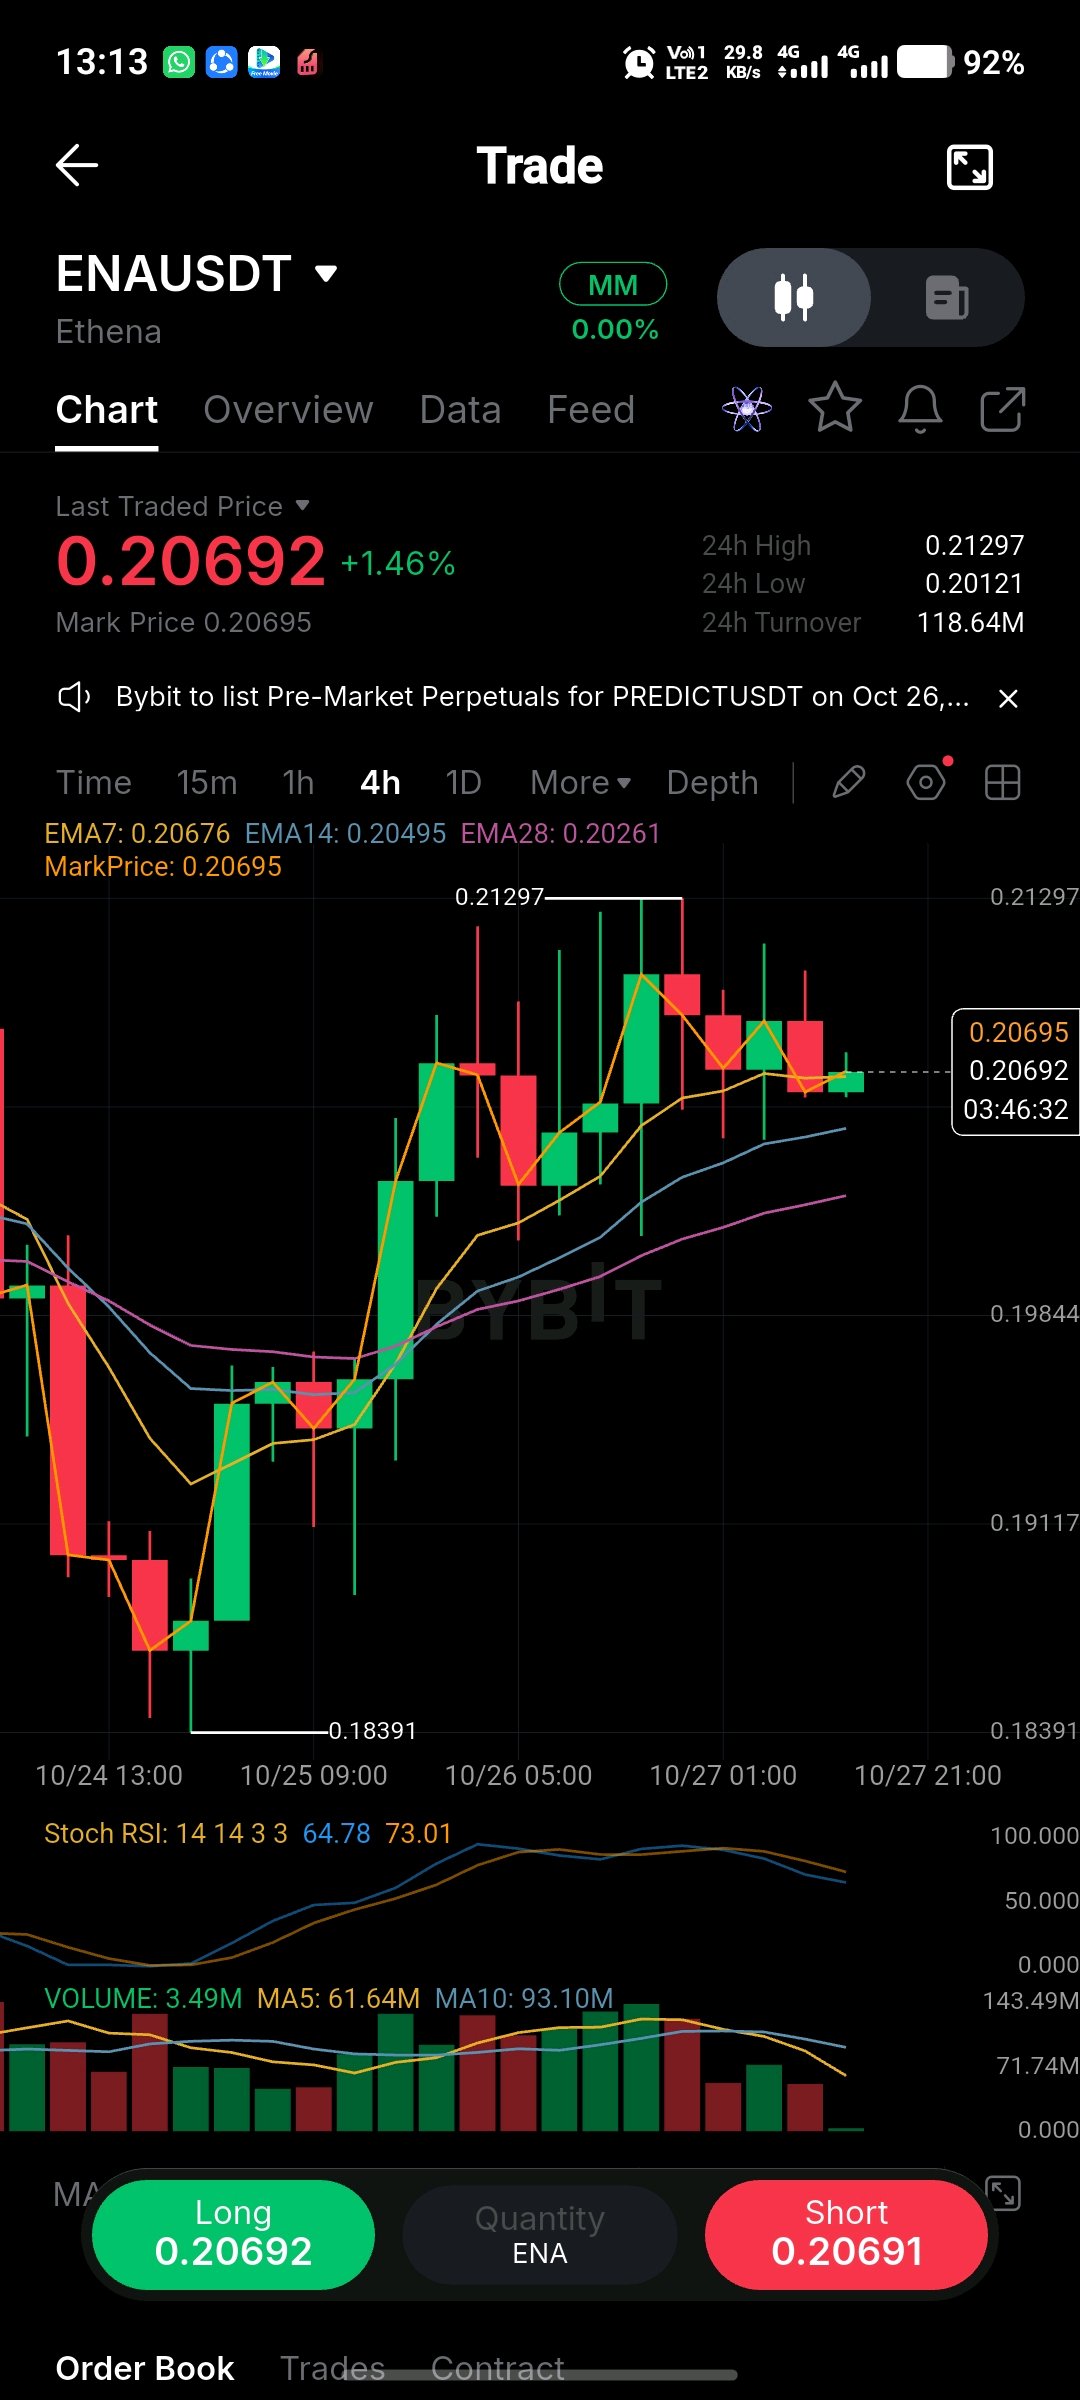
Nice recovery structure after that sweep to 0.18391, now price is digesting gains below 0.21297 top What I'm watching for Ethena is how it reacts around EMA cluster. $ENAUSDT trading at 0.20692 +1.46% , Mark 0.20695, 24h High 0.21297 Low 0.20121, Turnover 118.64M. 📍 Entry Zone: 0.20495 - 0.20676 ~ confluence of EMA14 + EMA7 🛑 SL: 4h close below 0.20261 EMA28 or 0.20121 24h low 🎯 Targets: 0.21297 -> 0.2180 -> 0.2240 📊 Context: ~ Stoch RSI: 64.78 / 73.01 rolling down from highs, still above 50 so momentum not dead ~ Volume: 3.49M vs MA5 61.64M MA10 93.10M - low volume pullback after high volume impulse on 10/25 ~ Trend holds bullish while above EMA28 0.20261 Invalidation if volume spikes bearish below 0.20261, then wait. #ByXIMPACT $ENAUSDT

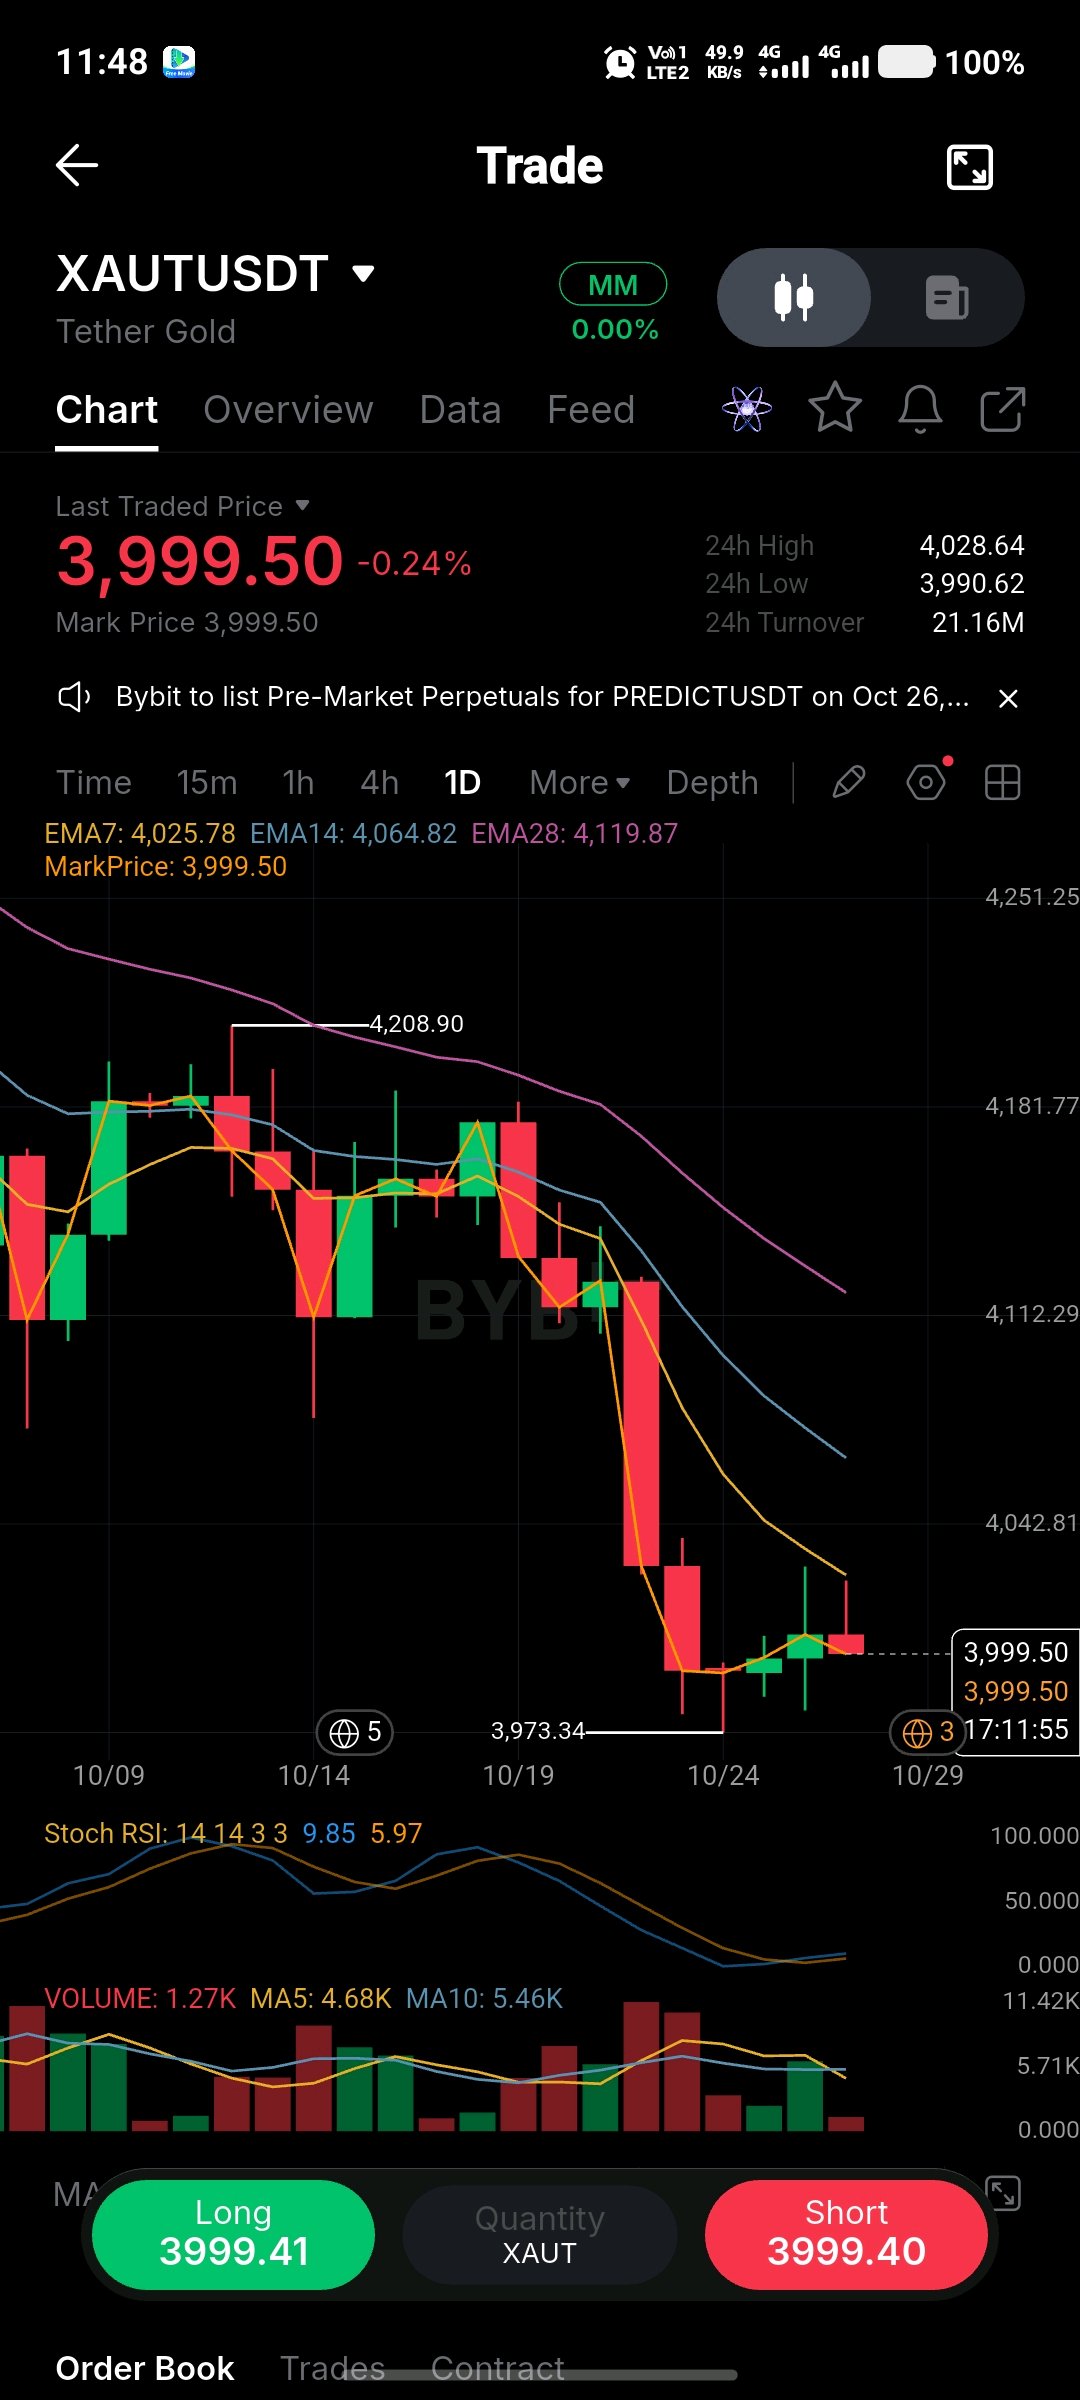
The market topped out near 4,208.90 and then kept making lower highs before a brutal red candle washed Tether Gold down to 3,973.34. Right now $XAUTUSDT is hovering around 3,999.50 -0.24% , trying to defend the psychological 4k mark. Mark price is 3,999.50, 24h high 4,028.64 and low 3,990.62. 📊 EMA picture: EMA7 at 4,025.78 is the first resistance, followed by EMA14 4,064.82 and EMA28 4,119.87. Price trading below all three, so trend is still down, but the gap is squeezing which usually hints at seller exhaustion. 🧠 Stoch RSI 9.85 / 5.97 - deep oversold zone, blue line starting to curl. Last two times we were here we got a quick 80-100 point bounce. 📊 Volume: 1.27K vs MA5 4.68K and MA10 5.46K - panic volume from Oct 22-23 is gone, now its dead quiet, meaning sellers are done but buyers are not aggressive yet. 🎯 Plan: Entry 3,990 - 4,000 SL below 3,970 daily close TP1 4,025, TP2 4,064, TP3 4,119 If 3,973.34 breaks with a daily close, this bounce idea fails and 3,900 opens. #ByXIMPACT $XAUTUSDT

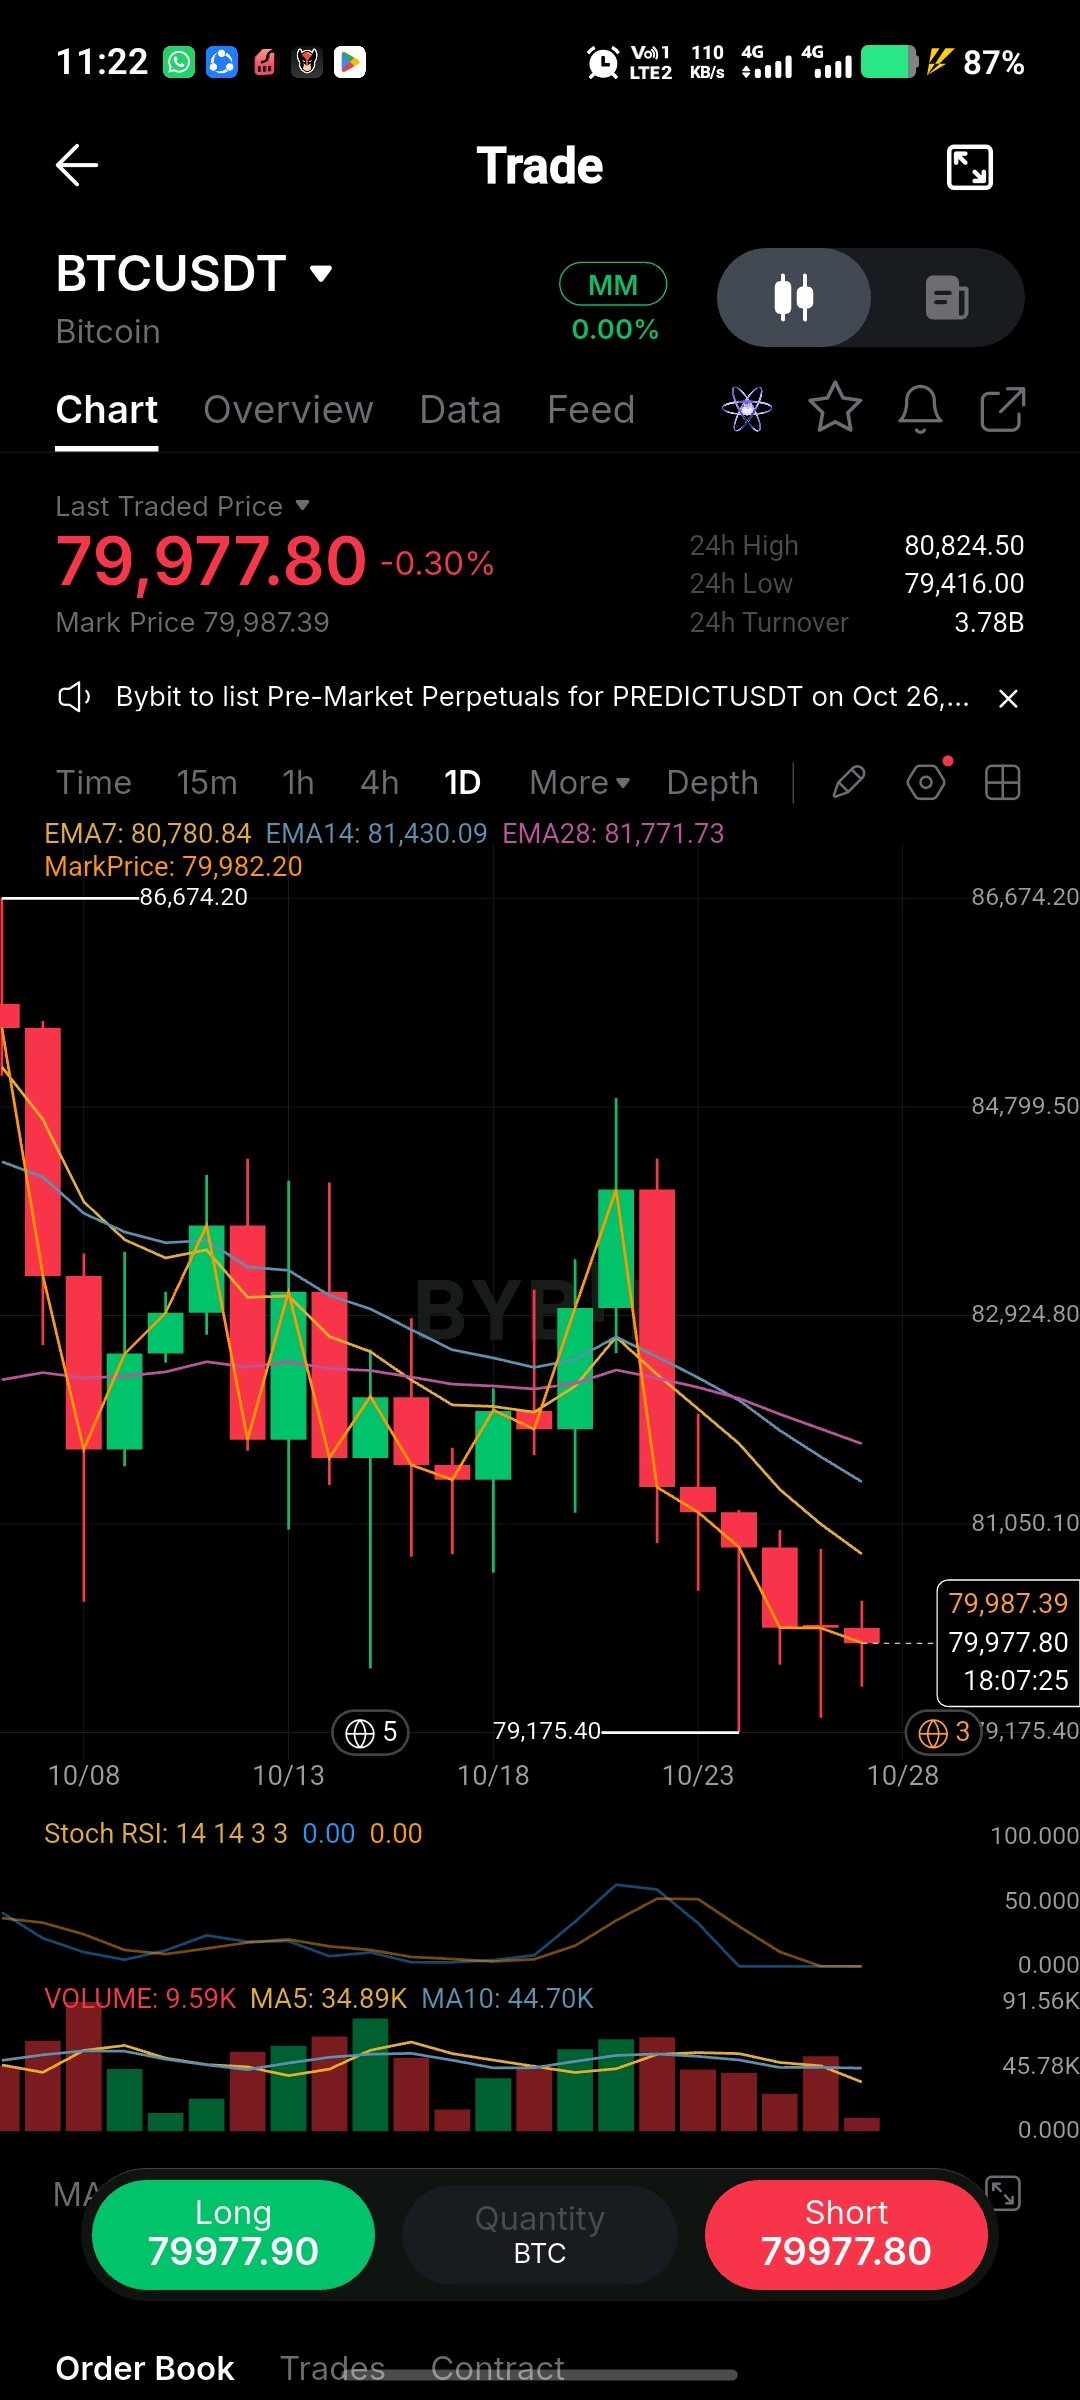
$BTCUSDT trading at 79,977.80 -0.30% after brutal week. Mark 79,987.39, 24h high 80,824.50 low 79,416.00, turnover 3.78B. Big picture from 86,674.20 top down to 79,175.40 low. 📊 What I'm Watching: EMA stack full bearish - EMA7 80,780.84, EMA14 81,430.09, EMA28 81,771.73. Price under all 3 and EMA7 pushing down. Last bounce to 84k+ got sold into EMA cluster, now making lower lows. Structure: 86k -> 81k -> 84k fakeout -> 79k breakdown. Stoch RSI: 0.00 / 0.00 - absolute zero, historical capitulation level. Every time we hit 0/0 on BTC daily, bounce came within 1-3 candles, but trend stays down until EMA reclaim. Volume: 9.59K vs MA5 34.89K vs MA10 44.70K - heavy selling volume dried up now, buyers not stepping yet but sellers exhausted too. Last red candles volume decreasing. 🎯 My Plan: Bullish scenario: Need daily close above 80,780 (EMA7) for relief rally. If that holds, quick long to 81,430 and 81,770. Bearish scenario: Current setup is sell on rally. Any move to 80,500-80,800 is short opportunity with invalidation above 81,800. Downside target 79,175 low break then 77,500. ⚠️ What would invalidate bearish view? 4H close above 81,050 and volume push above 40K. For now: No long chase at 79,977. Either wait for 79,175 retest with bullish divergence or wait for EMA7 reclaim. Patience play boss, 79k is psychological but oversold bounce setup building. #ByXIMPACT $BTCUSDT $BTCUSDC

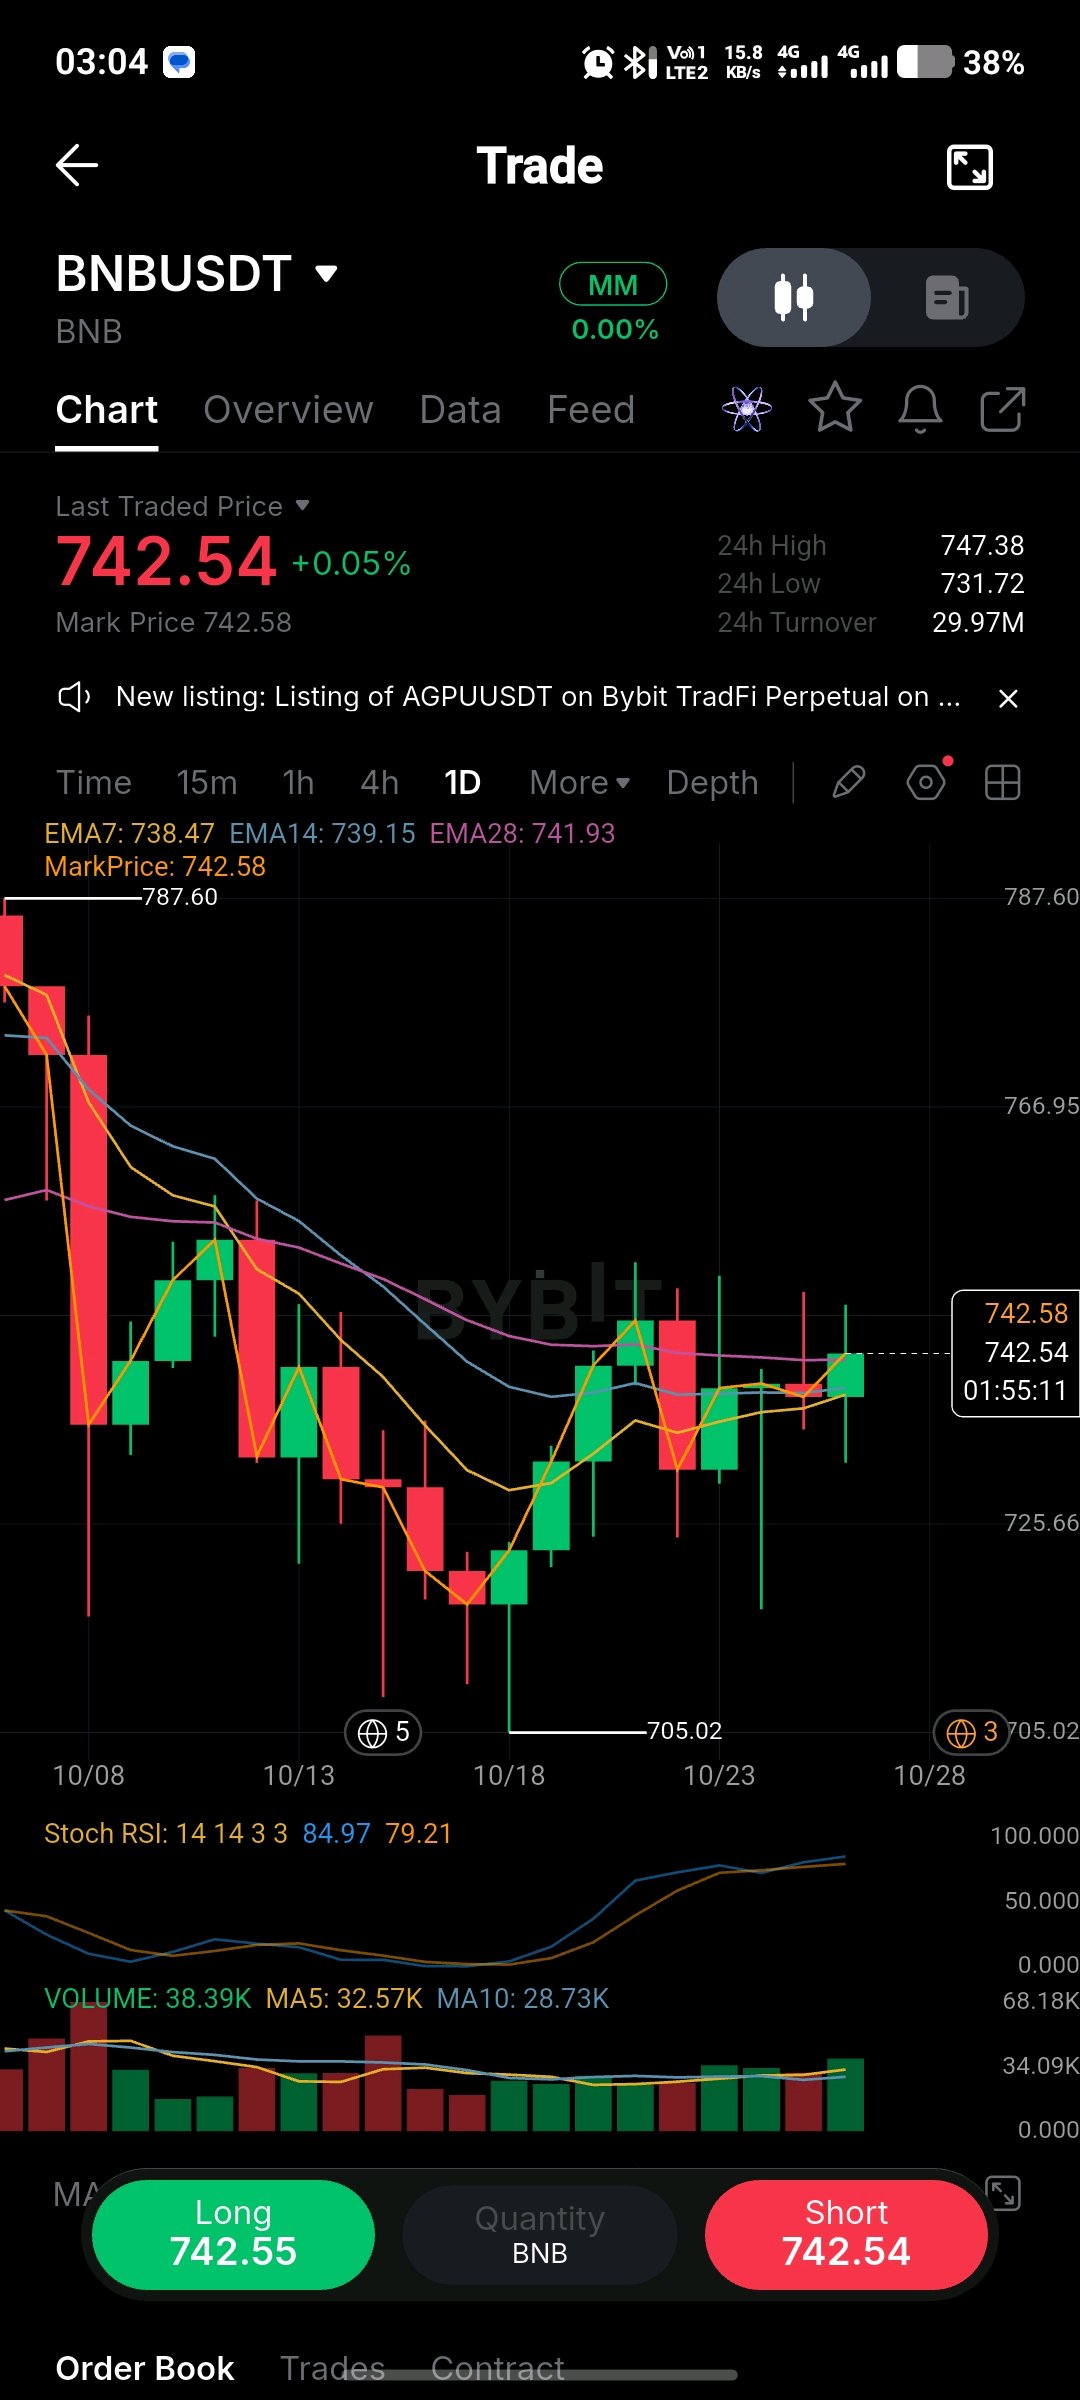
$BNBUSDT just printed +0.05% recovery into 742.54 and this push above EMA28 is what matters. 📊 Structure: Price flushed from 787.60 top down to 705.02 low on 10/18, then made higher low and higher high pattern. Now sitting at 742.58 mark, above EMA7 738.47, EMA14 739.15, EMA28 741.93 - bullish alignment after long time. This is first time after downtrend that price closed above all 3 EMAs. 🧠 What caught my attention isn't the 0.05%, it's the volume + Stoch RSI combo. Stoch RSI 84.97 / 79.21 - overbought zone, same level where last rejection came at 754 area. Volume 38.39K vs MA5 32.57K and MA10 28.73K - real buying, not fake pump. 🎯 My read: short-term momentum bullish, but chasing here is risky. Invalidation is structural: 4H/1D close below 738.00 (EMA7) would tell me this breakout failed and back to chop 720-735. For long, ideal entry: 736.00 - 740.00 zone, with invalidation at 732.00 (below 24h low 731.72). First target 747.38 (24h high), then 760, then 787.60 top. Risking ∼6 points from 739 midpoint to 732 gives roughly 1:2.5 to TP1 and 1:6+ to 760. What would change my mind? If price loses 731.72 and Stoch RSI crosses down sharply below 70, then momentum dead and short setup opens to 715. Are you buying this EMA breakout, or waiting for 736 retest like me? #ByXIMPACT $BNBUSDT

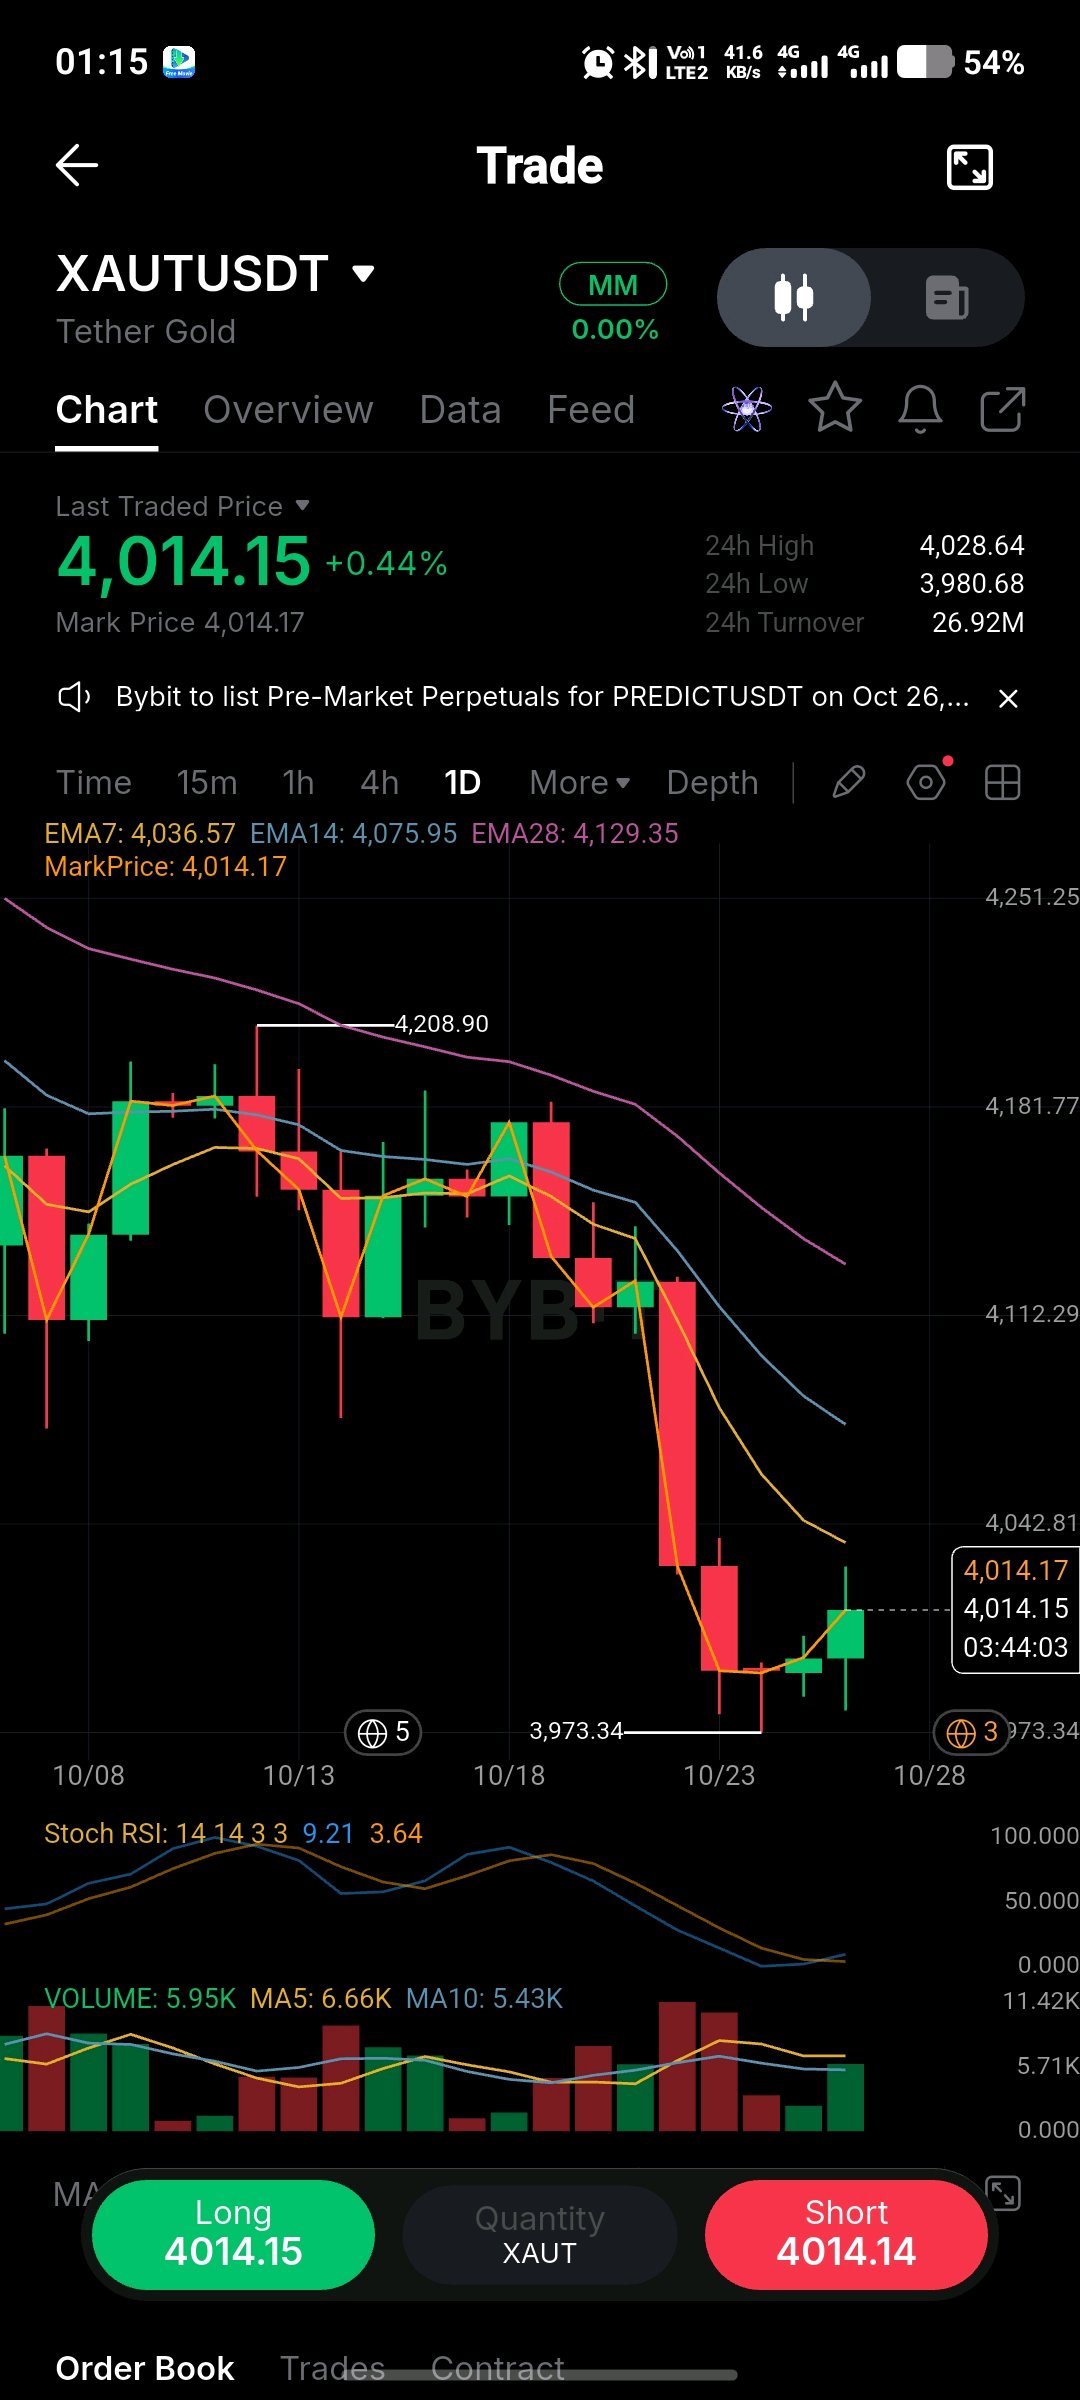
$XAUTUSDT last 4014.15 +0.44% after big dump. Mark 4014.17, 24h high 4028.64, low 3980.68, turnover 26.92M. Structure is down after rejection at 4208.90. 📊 EMA read: EMA7 4036.57, EMA14 4075.95, EMA28 4129.35 - price below all 3, EMA7 acting as first resistance. Last big red candle washed from 4120 to 3973.34 low. 🧠 Stoch RSI 9.21 / 3.64 - extreme oversold, same as SOL chart, bounce trying but not confirmed. 📊 Volume: 5.95K vs MA5 6.66K / MA10 5.43K - volume spike on dump day then drying, now green volume building again. 🎯 Plan - counter trend bounce, not trend long: Entry Zone: 3990 - 4015 (current base, low risk) Invalidation: 3970 (below 3973.34 low daily close) Targets: TP1: 4036 (EMA7) TP2: 4075 (EMA14) TP3: 4130 (EMA28 + breakdown zone) 🟢 Risk: 25-45 points risk for 60 / 120 points gain. R:R approx 1:2.2 to TP2. ⚠️ Bearish again if: daily close below 3973.34 - then next 3900-3850 open. No FOMO long at top, small bounce play only. #ByXIMPACT $XAUTUSDT

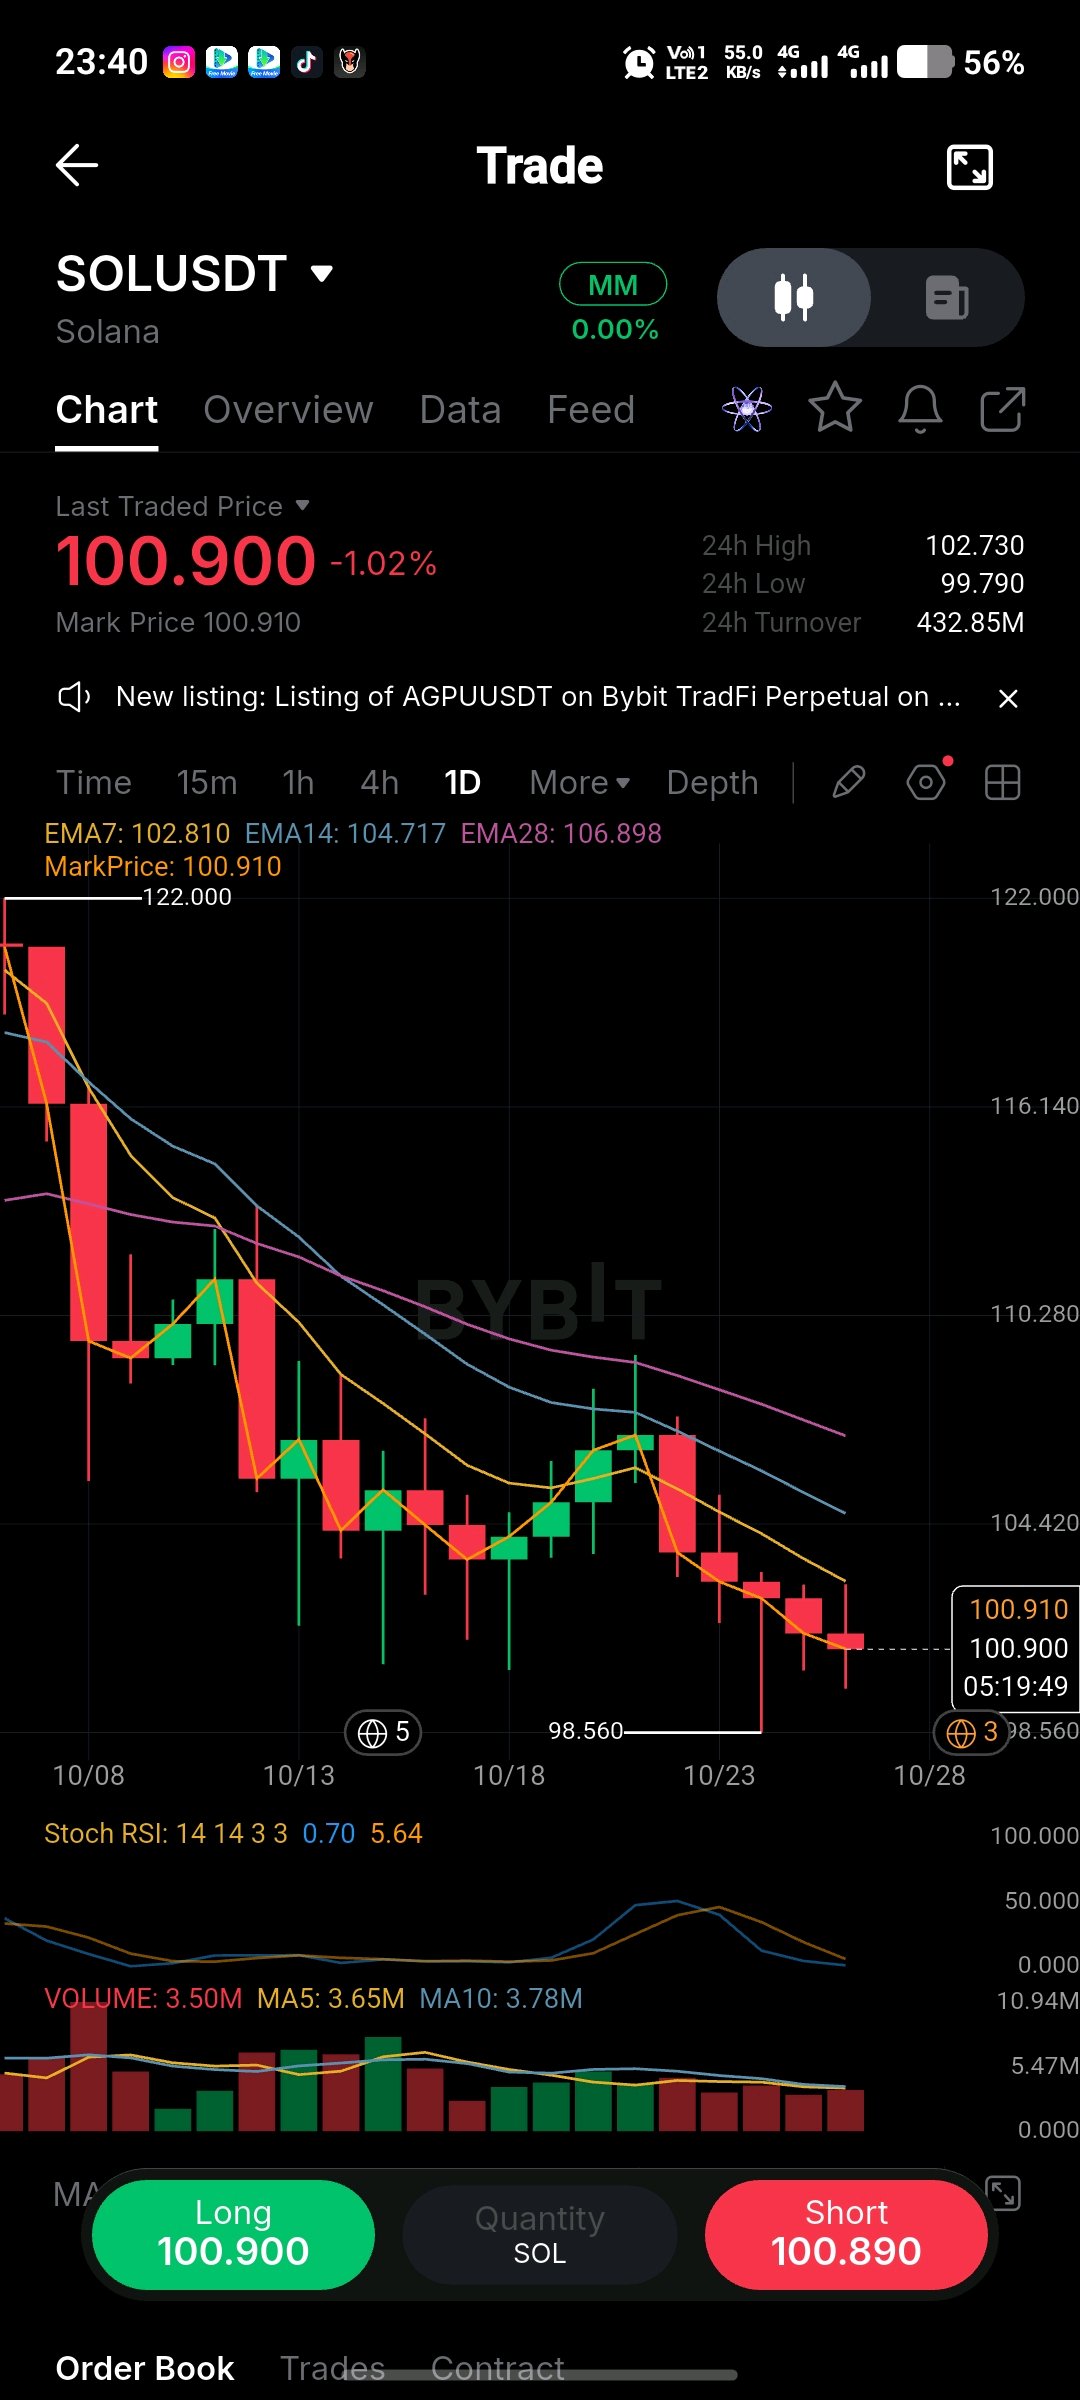
$SOLUSDT is trading at 100.90 -1.02% after failing to hold EMA zone. Last traded 100.90, mark 100.91, 24h high 102.73, low 99.79, turnover 432.85M. 📉 What I'm Watching: Price came from 122.00 top and made lower highs. EMA7 102.81, EMA14 104.71, EMA28 106.89 - all above price, full bearish alignment. Recent bounce from 98.56 failed at EMA cluster around 106-107 and got rejected with long red candle. Stoch RSI: 0.70 / 5.64 - extreme oversold on daily, blue line near 0. This is capitulation zone, but no reversal signal yet. 📊 Volume: 3.50M vs MA5 3.65M and MA10 3.78M - volume drying during drop, sellers getting weak. 🎯 My Plan: This is sell on rally setup, not long yet. Entry Zone: 102.80 - 104.50 (EMA7 + EMA14 retest) Stop Loss: 106.90 (above EMA28 and recent swing high) Targets: TP1: 98.56 (recent low) TP2: 95.00 TP3: 92.00 🟢 Alternative long only if: Daily close above 104.80 with Stoch RSI cross up - then long to 108.50 Risk: Oversold bounce can come anytime, so short size small rakho. No chasing at 100.90. #ByXIMPACT $SOLUSDT

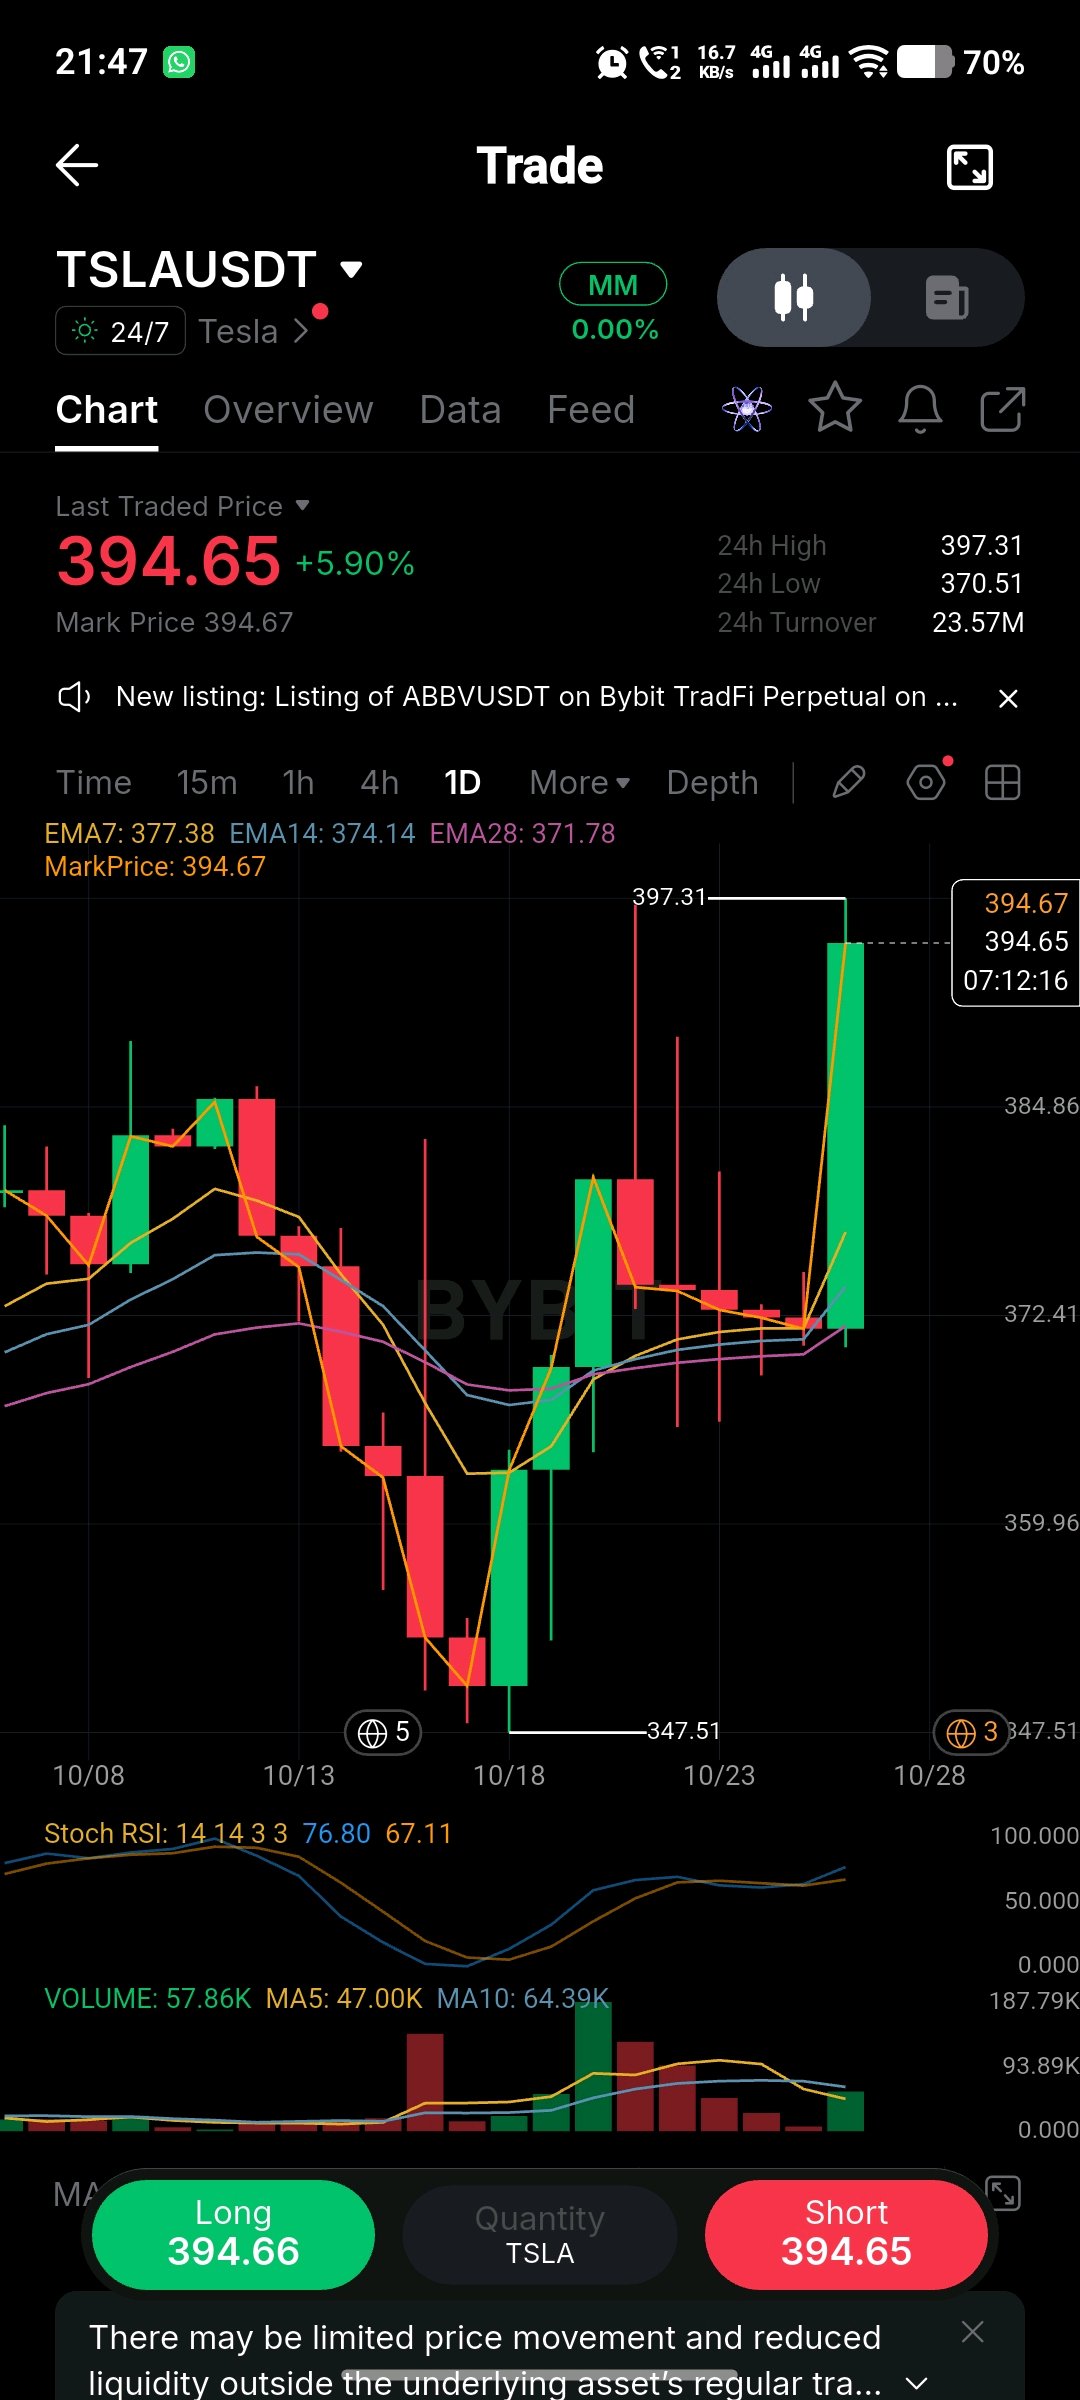
$TSLAXUSDT: THE BREAKOUT LOOKS STRONG — BUT IS IT SAFE TO CHASE? I've learned one expensive lesson the hard way — a massive green daily candle can create excitement, but excitement is not a trading strategy. $TSLAXUSDT just exploded from the $370.51 low toward $397.31 high and is now holding around $394.65, up +5.90% with 23.57M turnover. That kind of vertical move after days of sideways near $371-$372 is a classic short squeeze and FOMO trap. WHAT I'M WATCHING The key question is whether buyers can defend this breakout. Price is trading far above EMA7 $377.38, EMA14 $374.14 and EMA28 $371.78 — all stacked bullish, but also showing extreme extension. Stoch RSI at 76.80 / 67.11 is deep in overbought territory. Volume 57.86K confirms interest, but chasing here is risky. After such an impulse, I want to see price establish support above $384.86 before thinking about a long entry. 🎯 POTENTIAL TRADE PLAN 🟢 Bullish Scenario: If TSLAUSDT reclaims and holds above $395-$397.31 with strong volume, a confirmed recovery could open $405 and $412. Sustained break above daily high needs follow-through, not just a wick. 🔴 Bearish Scenario: Rejection around $397.31 is very likely. Losing $384.86 quickly weakens the structure, and a breakdown below $371.78 EMA28 with selling pressure opens the door back to $359.96 and $347.51 swing low. ENTRY, STOP-LOSS & TARGETS I would not blindly reuse an old entry at the top. Latest feed shows $394.65, so this original setup needs reassessment. I would wait for a confirmation pullback, define invalidation below $370.51, and only then calculate a proper risk/reward setup. THE LESSON The biggest mistake is not missing the breakout, it's entering too late at the peak. A pullback is not automatically a buy, and a breakout is not automatically a win. Price structure, volume, and risk must agree before you click long. What do you think, is this TSLA move going to hold above $397 or is a sharp mean-reversion coming? #ByXIMPACT $TSLAXUSDT

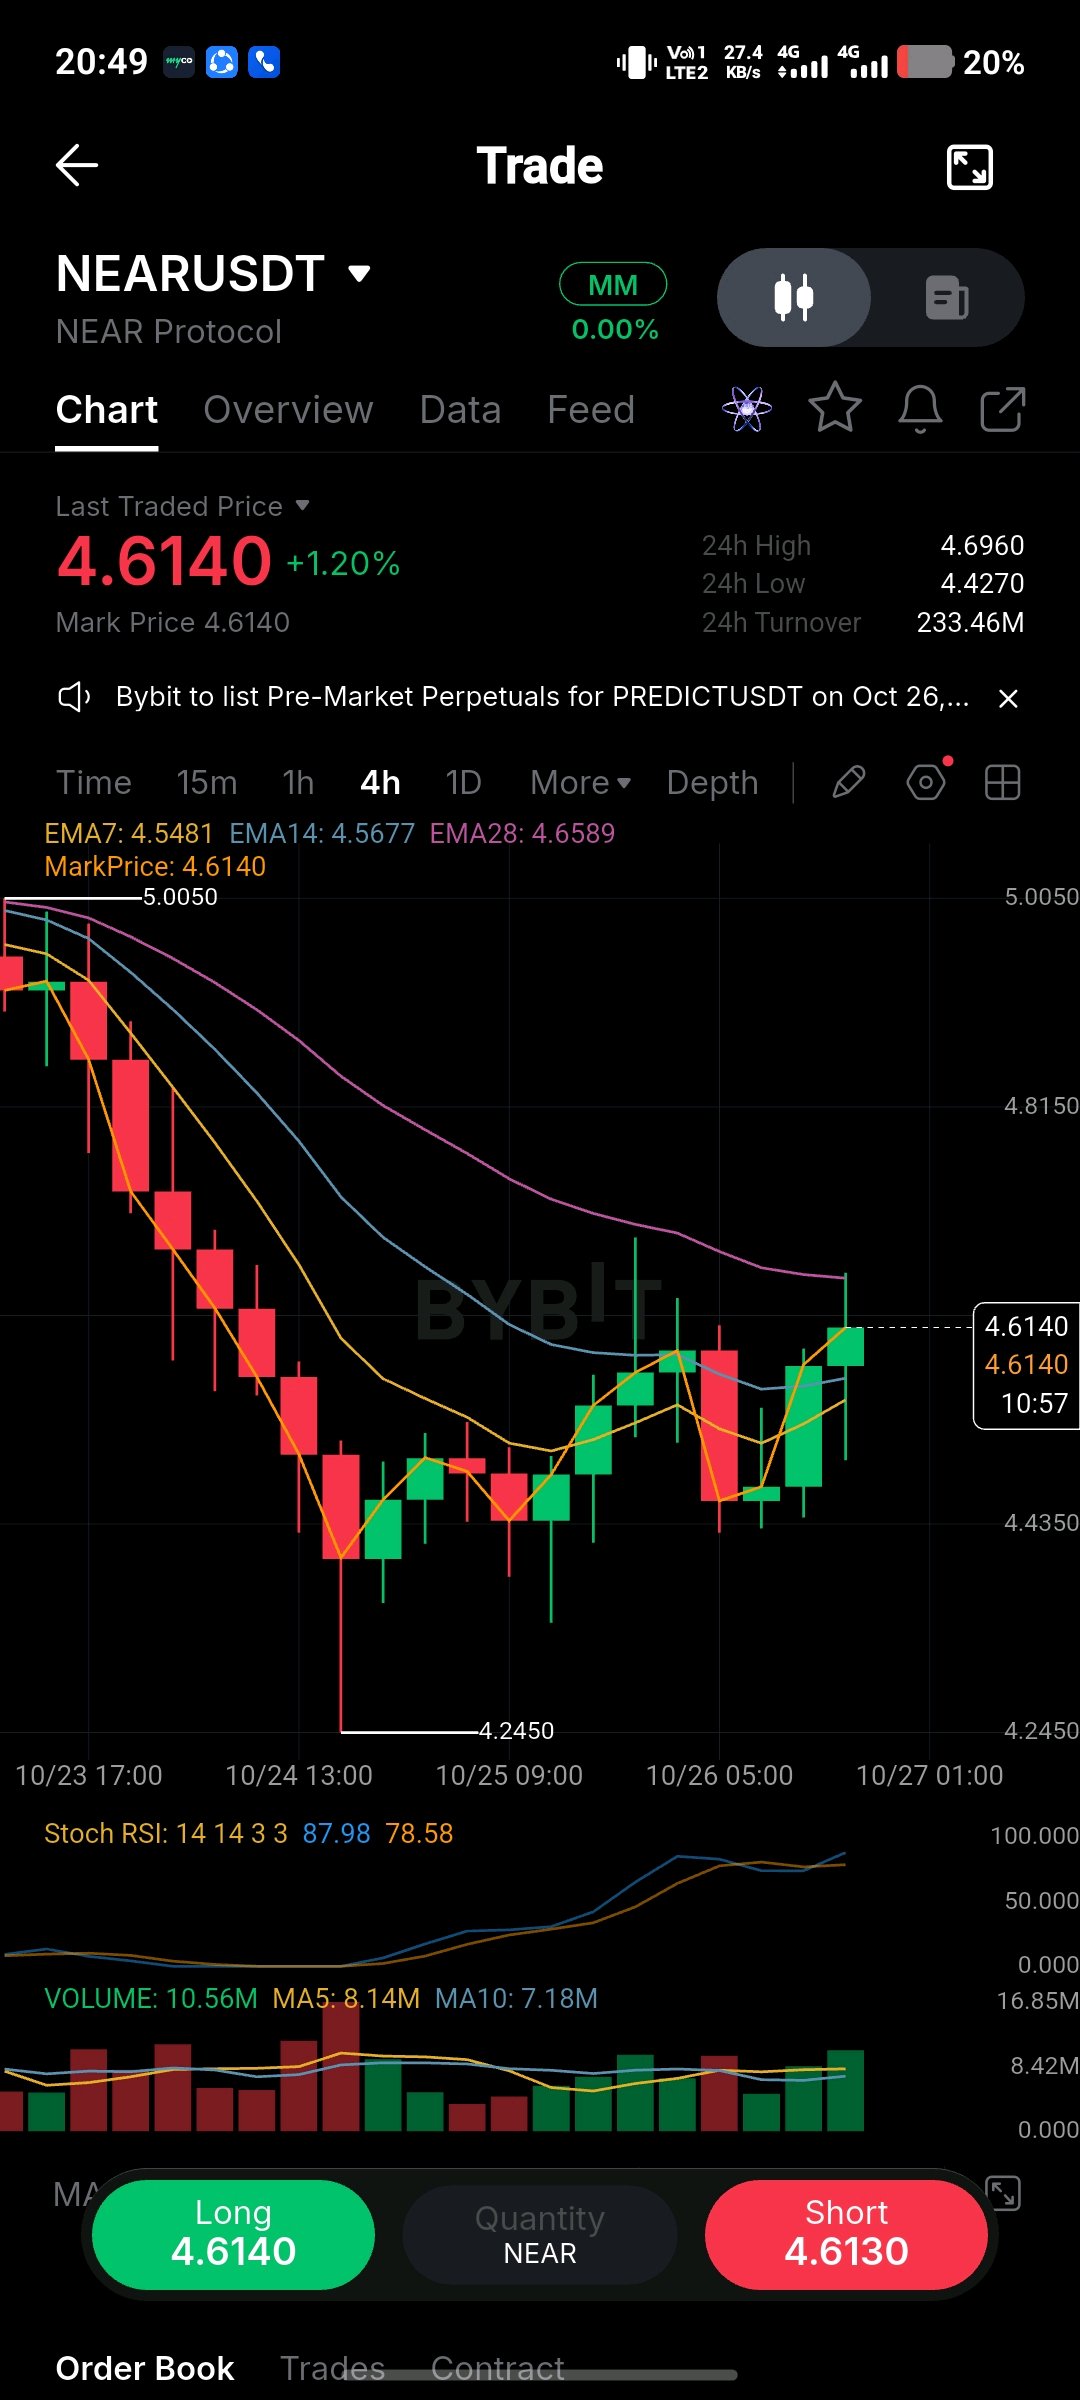
$NEARUSDT Prints 4.6140 Near 4.6960 Daily High After Bounce From 4.2450 Bottom $NEARUSDT last 4.6140 +1.20% ∼ 4.61 USD. 24h high 4.6960 low 4.4270 turnover 233.46M. EMA7 4.5481 EMA14 4.5677 EMA28 4.6589 MarkPrice 4.6140. Chart extremes marked 5.0050 top / 4.2450 bottom. Stoch RSI 87.98 / 78.58 overbought momentum. Volume 10.56M MA5 8.14M MA10 7.18M with Long 4.6140 / Short 4.6130. 4H Chart Movement 10/23 17:00 drop from 5.0050 top with heavy red cascade into 10/24 13:00 flush to 4.2450 low with long wick capitulation. Base formation 10/24 to 10/25 09:00 around 4.30-4.40 with green small bodies. First recovery attempt 10/25 09:00 onward pushing to 4.55, rejection at 10/26 05:00 back to 4.43. Final impulse 10/26 05:00 to 10:27 01:00 with two strong greens printing 4.6140 at 10:57, now tagging below EMA28. Structure Levels Resistance: 4.6589 / 4.6960 / 5.0050 chart top Current: 4.6140 / 4.6140 Support: 4.5677 / 4.5481 / 4.4270 / 4.2450 Setup Context Bias: Bullish momentum but facing EMA28 resistance Entry: Buy on retest 4.5677 - 4.5481 EMA14/EMA7 zone Break Up: 4H close above 4.6589 / 4.6960 Break Down: 4H close below 4.5481 EMA7 Path Projection: 4.6140 -> 4.6589 -> 4.6960 upside, else 4.5677 -> 4.4270 downside Reason Behind Zones EMA7 4.5481 > EMA14 4.5677 turning up, but EMA28 4.6589 still overhead as supply. Price 4.6140 over both short EMAs shows short-term strength. Stoch RSI 87.98 / 78.58 at top signals stretched move, may need cooldown before breaking 4.6960. Volume 10.56M > MA5 8.14M > MA10 7.18M confirms real buying fuel behind last green candles. Invalidation Risk Close below 4.2450 low destroys recovery structure and reopens 4.00. Holding above 4.5481 keeps path open toward 4.6960. Will NEAR break 4.6589 EMA28 to challenge 4.6960 from 4.6140 or pull back to 4.56 first? #ByXIMPACT $NEARUSDT

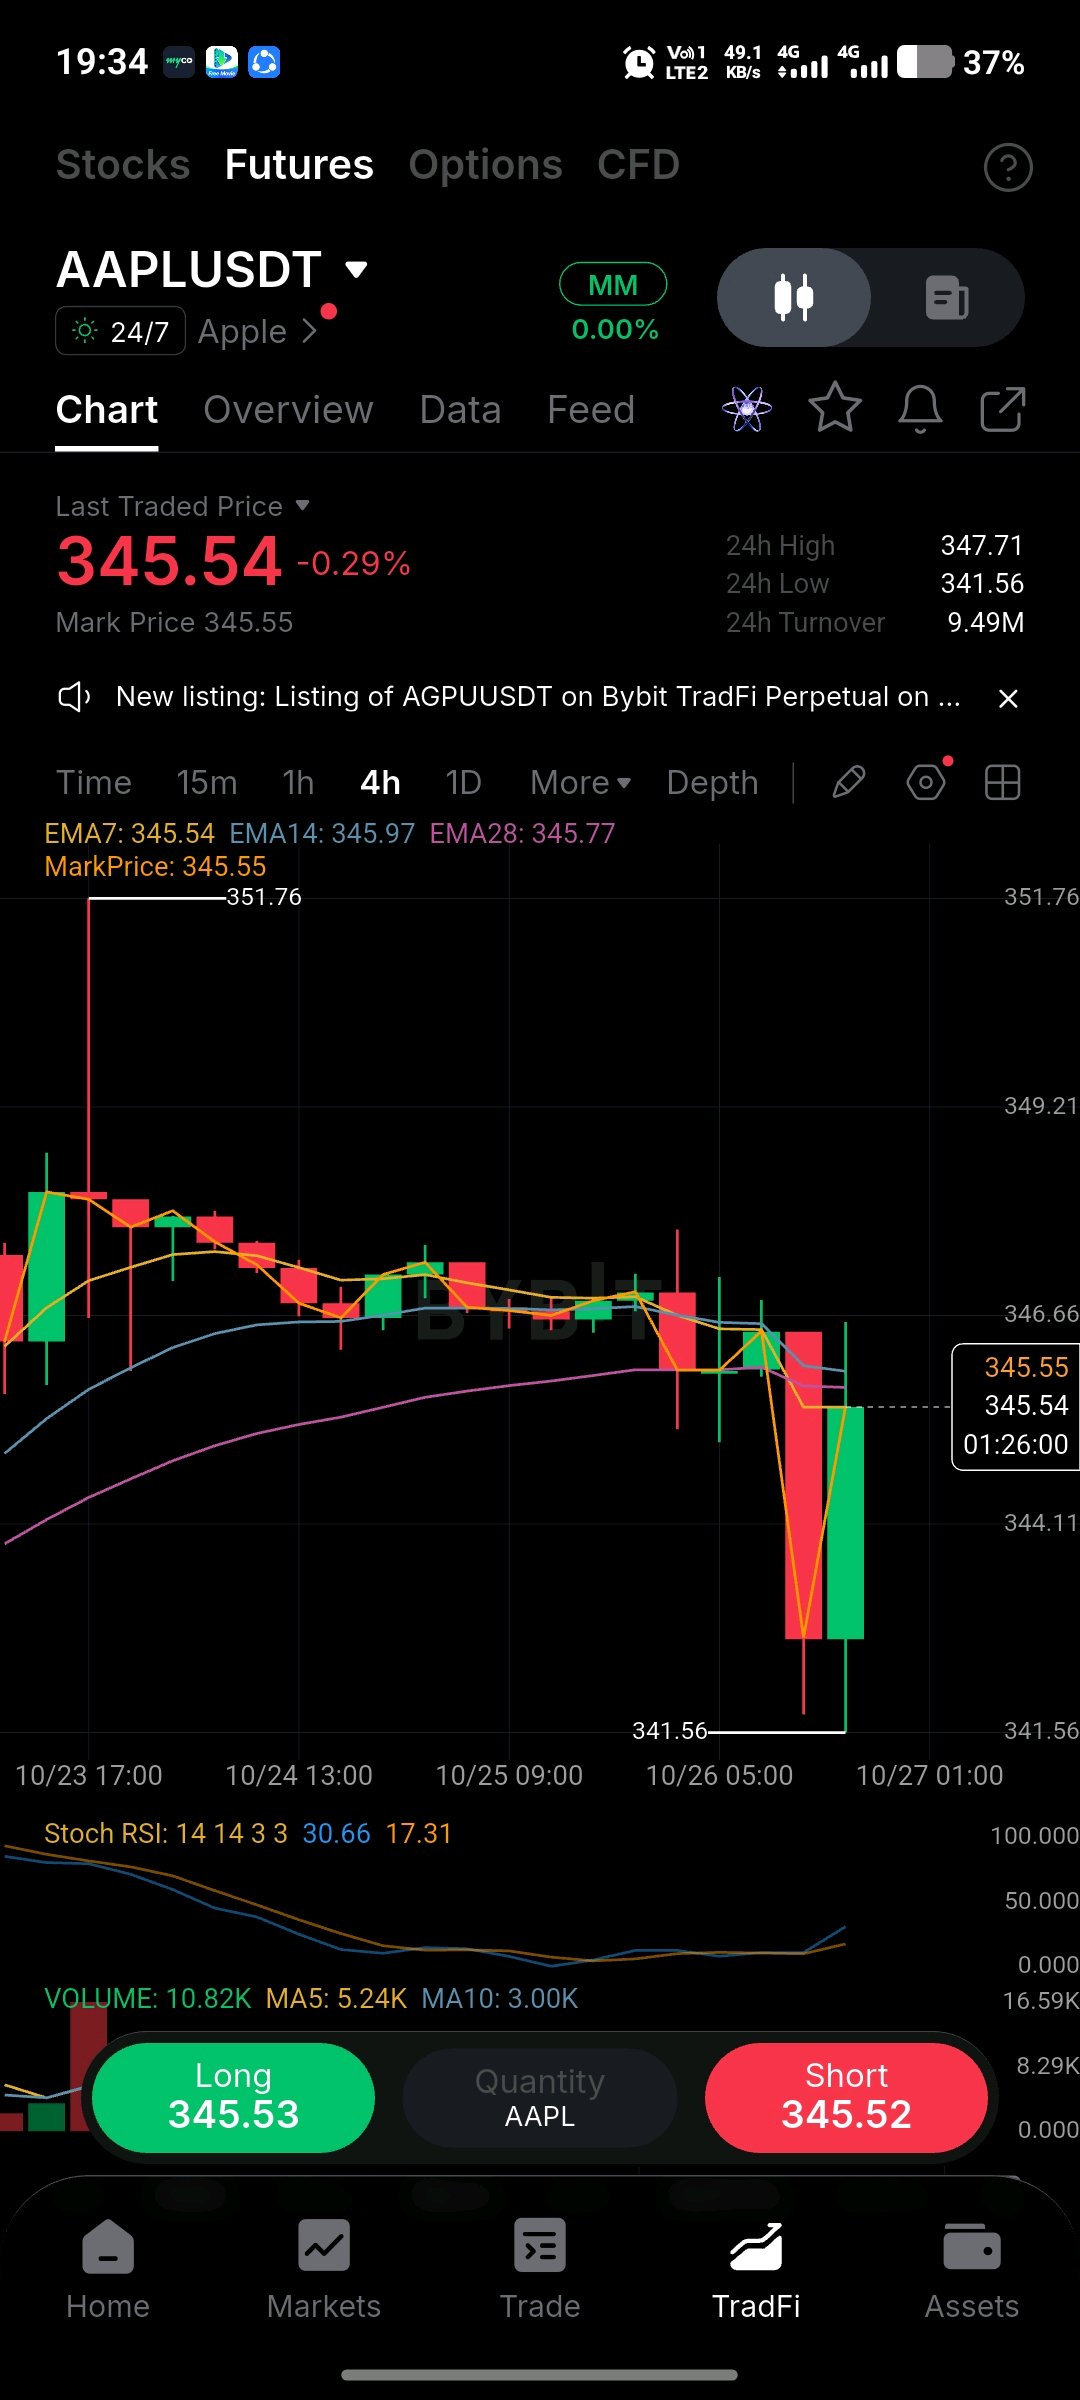
$AAPLXUSDT Defends 341.56 Low After Sharp Flush — Is 345.54 Launching Back To 347.71?_ AAPL/USDT now at 345.54 -0.29% with Mark Price 345.55, sitting just off the 24h low. The 4H shows a hard rejection from 351.76 top down to 341.56 low marked on 10/26 05:00, then a strong V-recovery on 01:26:00 candle closing at 345.54. 24h High 347.71 / Low 341.56 / Turnover 9.49M frames the current range. 🔍 What I'm Watching EMAs compressing at top: EMA7: 345.54 EMA14: 345.97 EMA28: 345.77 Current: 345.54 / Mark 345.55 Chart extremes: 351.76 top / 341.56 bottom Stoch RSI: 30.66 / 17.31 curling up from oversold Volume: 10.82K MA5: 5.24K MA10: 3.00K - buying volume 2x average Long 345.53 / Short 345.52 tight spread Price 345.54 is pinning EMA7 345.54, trying to reclaim EMA14 345.97 and EMA28 345.77. Stoch RSI 30.66 / 17.31 just crossed up from bottom, momentum reset done. Volume 10.82K vs MA5 5.24K / MA10 3.00K confirms dip buyers stepped in at 341.56. 🧭 Two Levels, Two Different Stories Above 345.77 - 345.97: Hold over EMA28 345.77 / EMA14 345.97 opens 346.66 -> 347.71 24h High -> 349.21. Break over 351.76 targets new high. Below 345.54 - 341.56: If AAPL fails under EMA7 345.54 and 341.56 low, it retests 341.56 and opens 340.00. Losing 341.56 invalidates V-recovery. 🎯 My Execution Map No chasing the green candle yet. Pullback long: 342.50 - 341.56 low retest zone Breakout long: 4H close over 345.97 / 347.71 Invalidation: 4H close under 341.56 Targets: 345.54 -> 345.97 -> 347.71 -> 351.76 EMA7 345.54 is the pivot. Staying above keeps bounce alive to 347.71, dropping under flips back to 341.56 risk. 💬 AAPL holding 345.54 after defending 341.56 — are you looking for continuation to 347.71 or fade into EMA resistance? #ByXIMPACT $AAPLXUSDT

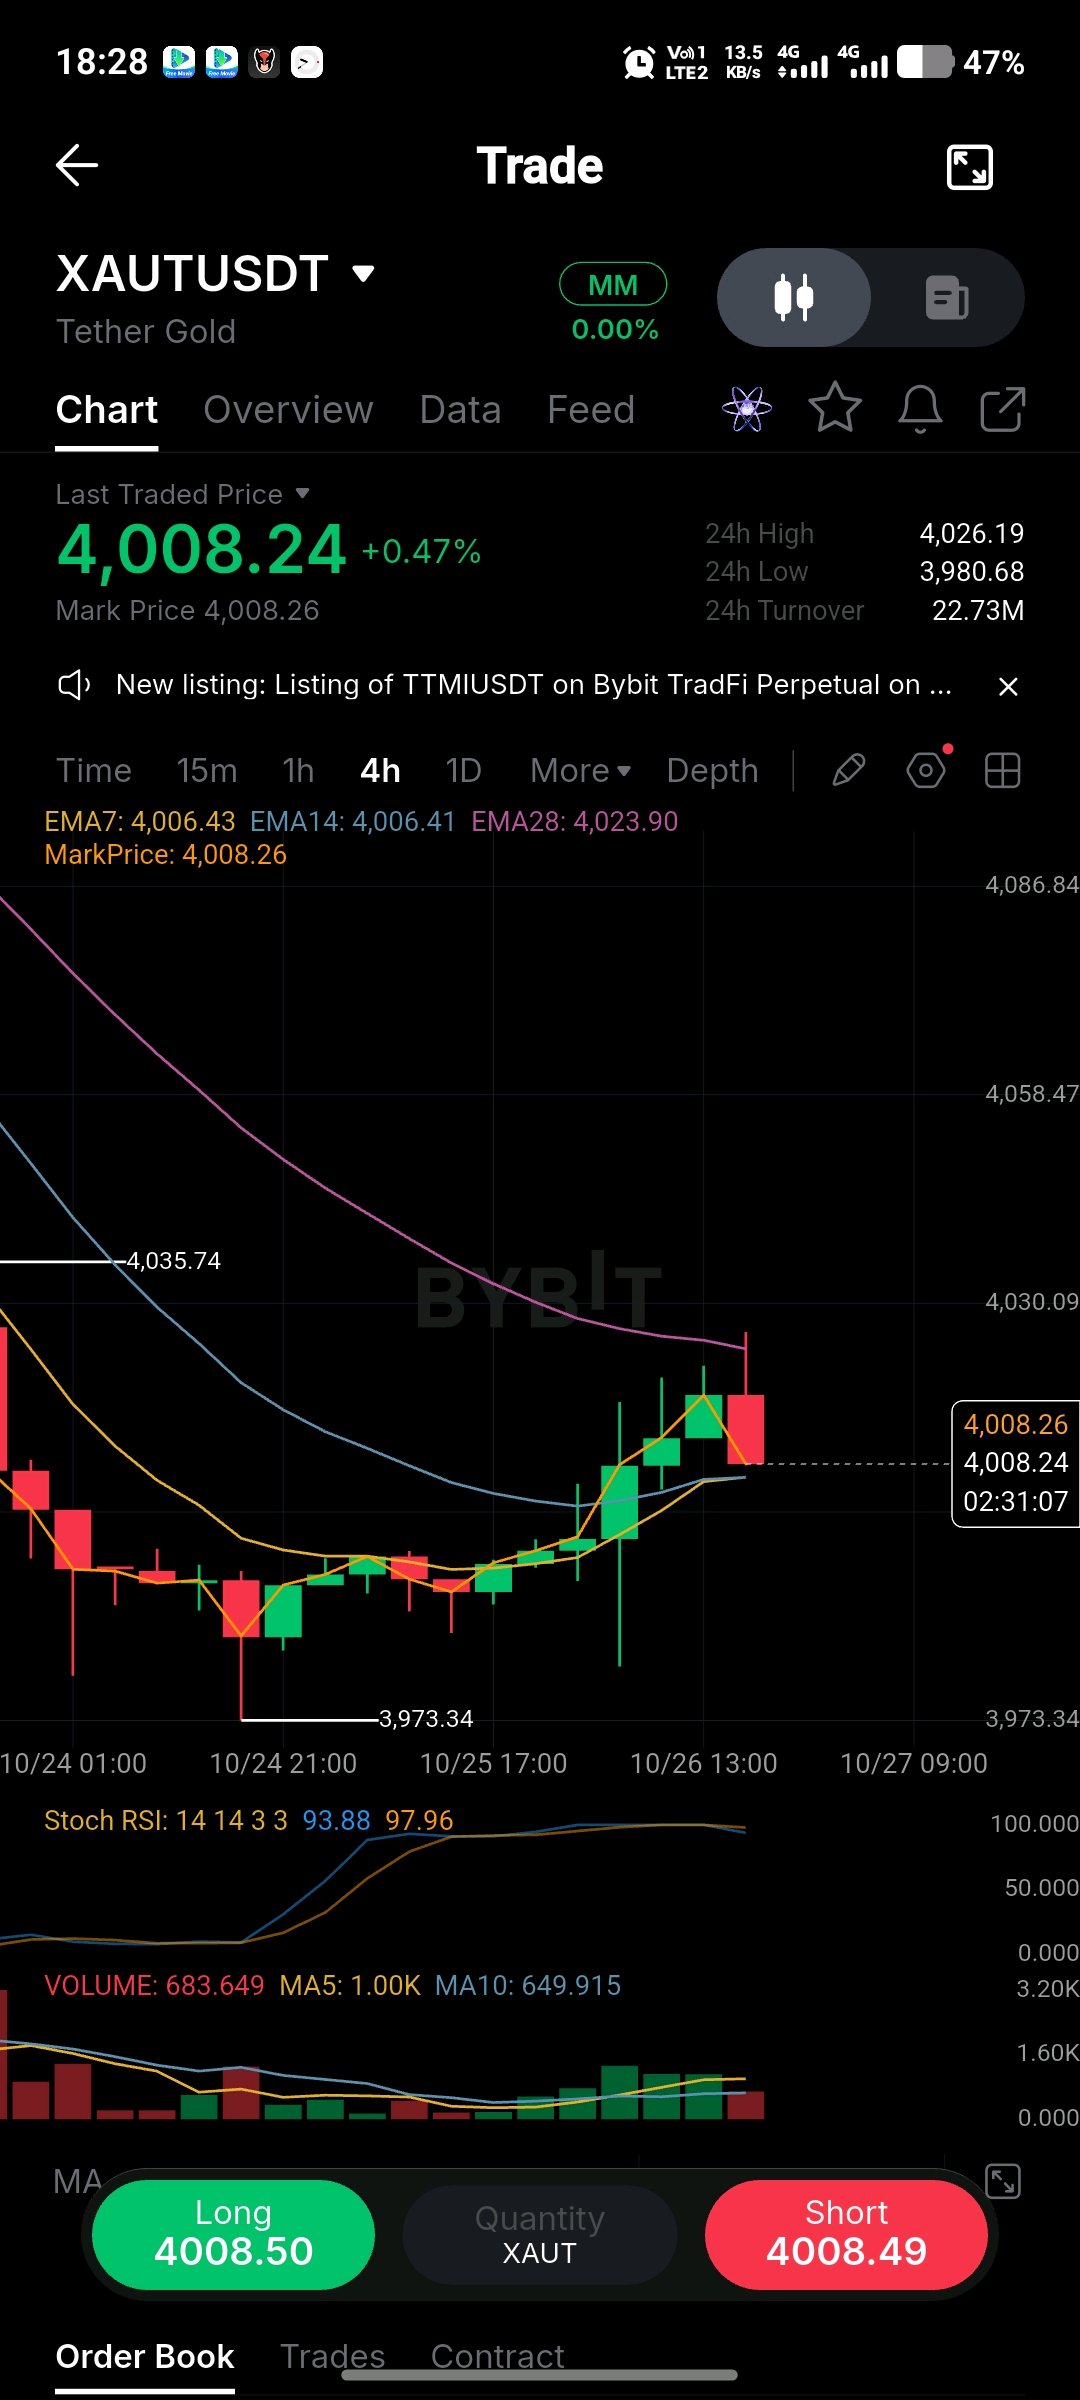
$XAUTUSDT Pushes To 4008.24 Near 4026.19 After Bounce From 3973.34 $XAUTUSDT last 4,008.24 +0.47% ∼4008.24 USD. 24h high 4,026.19 low 3,980.68 turnover 22.73M. EMA7 4,006.43 EMA14 4,006.41 EMA28 4,023.90 MarkPrice 4,008.26. Chart extremes marked 4,035.74 top / 3,973.34 bottom. Stoch RSI 93.88 / 97.96 extremely overbought. Volume 683.649 MA5 1.00K MA10 649.915. 4H Chart Structure 10/24 01:00 top near 4,035.74 with rejection, then drop to 3,973.34 low on 10/24 21:00 long wick. Sideways grind 10/24 21:00 to 10/25 17:00 between 3,980 and 4,000. Breakout start 10/26 01:00 to 13:00 with three green 4H candles pushing to 4,026.19 intraday, then pullback candle at 02:31:07 printing 4,008.24 / 4,008.26 just over EMA7/EMA14. Levels To Watch Resistance: 4,026.19 / 4,035.74 / 4,023.90 EMA28 Current: 4,008.24 / 4,008.26 Support: 4,006.43 / 4,006.41 / 3,980.68 / 3,973.34 Trade Map Bias: Bullish above 4,006.41 but extended Long zone: 4,006.43 - 4,006.41 EMA7/EMA14 support Break Up: 4H close above 4,026.19 / 4,035.74 Break Down: 4H close below 4,006.41 Projection: 4,008.24 -> 4,026.19 -> 4,035.74 if holds, else 4,006.41 -> 3,980.68 Why Zones Matter Price barely over EMA7 4,006.43 and EMA14 4,006.41 while EMA28 4,023.90 still above price, so resistance overhead. Stoch RSI 93.88 / 97.96 maxed out signals topping risk under 4,026.19. Volume 683.649 vs MA5 1.00K and MA10 649.915 around average, not yet explosive for breakout. Invalidation Hold below 3,973.34 low invalidates bullish recovery and opens down to 3,950. Above 4,035.74 clears path to 4,086. Is XAUT breaking 4026.19 from 4008.24 or rejecting at 4023.90 EMA28? #ByXIMPACT $XAUTUSDT

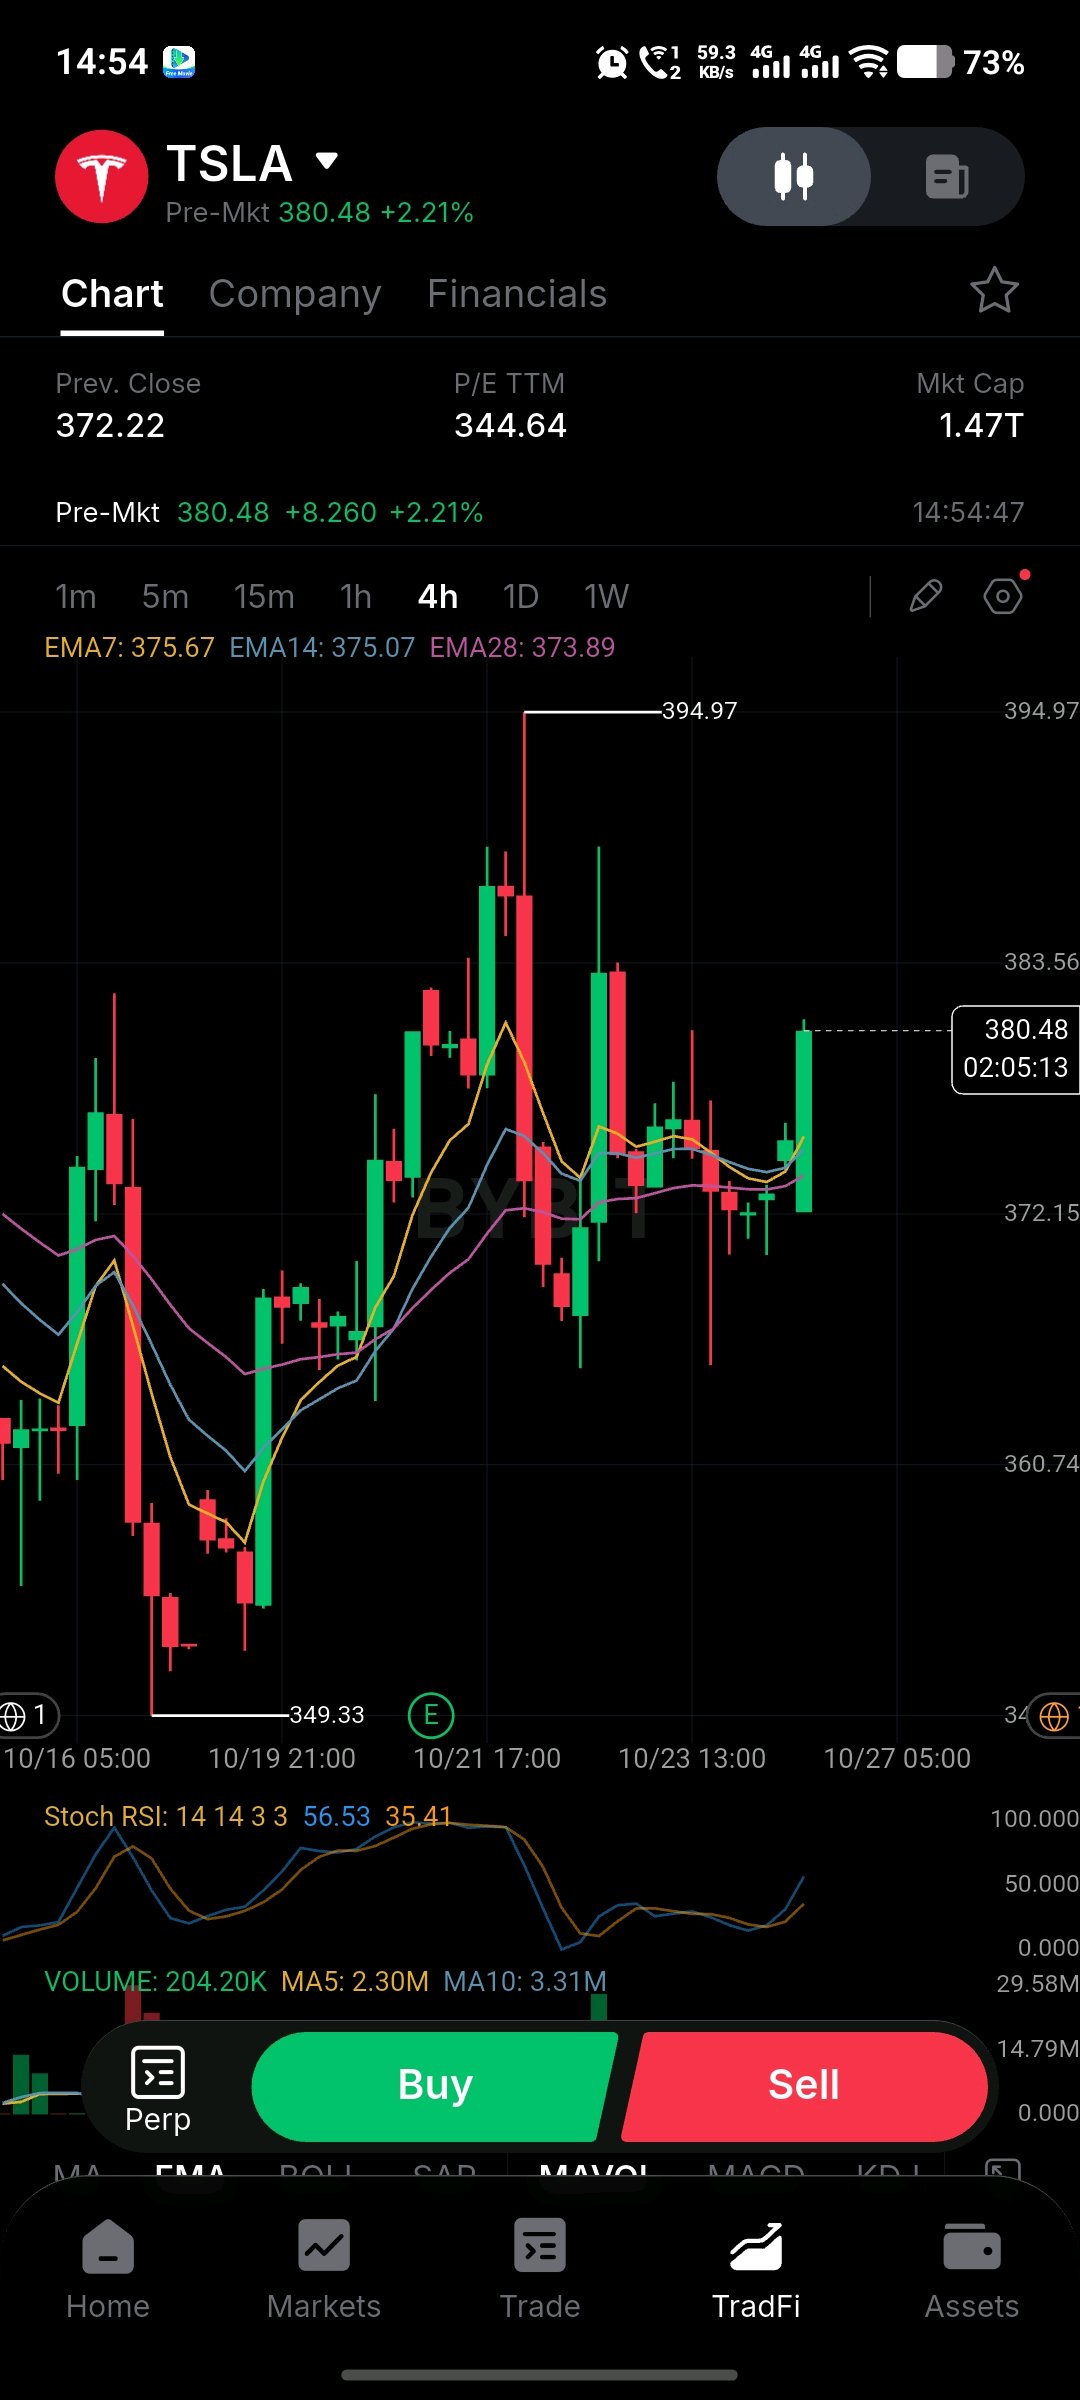
TSLA JUMPS TO $380.48 PRE-MKT AFTER $394.97 FAKEOUT — COMEBACK TO $394? Tesla is back at $380.48 Pre-Mkt, +8.260 +2.21% from Prev. Close $372.22 on the 4H TradFi chart. The defining move was the spike to $394.97 at 10/22 01:00 then brutal reversal down to $349.33 low marked 10/19-10/20. Current 4H at 02:05:13 shows $380.48 green hammer reclaiming EMA cluster. 🔍 What I’m Watching EMAs flipped bullish again: EMA7: $375.67 EMA14: $375.07 EMA28: $373.89 Current: $380.48 Pre-Mkt Mkt Cap: 1.47T Chart extremes: $394.97 top / $349.33 bottom Stoch RSI: 56.53 / 35.41 bullish cross up Volume: 204.20K MA5: 2.30M MA10: 3.31M P/E TTM: 344.64 Price $380.48 is now above EMA7 $375.67, EMA14 $375.07, EMA28 $373.89, turning short-term momentum up. Stoch RSI 56.53 / 35.41 crossed bullish from oversold, room to push. Volume 204.20K still below MA5 2.30M / MA10 3.31M, so pre-mkt move needs regular session volume confirmation. 🧭 Two Levels, Two Different Stories Above $380.48 – $394.97: Hold over $380.48 opens gap toward $383.56 → $394.97 top. Break over $394.97 targets $400+ psychological. Below $375.67 – $373.89: If TSLA slips under EMA7 $375.67 / EMA28 $373.89, it returns to $372.22 prev close and $365 zone. Losing $360.74 invalidation level retests $349.33 low. 🎯 My Execution Map Not chasing pre-mkt spike blindly. Momentum long: $375.67 – $373.89 EMA support retest Breakout long: 4H close over $394.97 Invalidation: 4H close under $349.33 Targets: $380.48 → $383.56 → $394.97 Key is EMA7 $375.67. Staying above it keeps recovery alive toward $394.97. Dropping under flips back to $349.33 risk. TSLA at $380.48 pre-mkt — are you eyeing $394.97 reclaim or fade back to $375? #ByXIMPACT $TSLAXUSDT

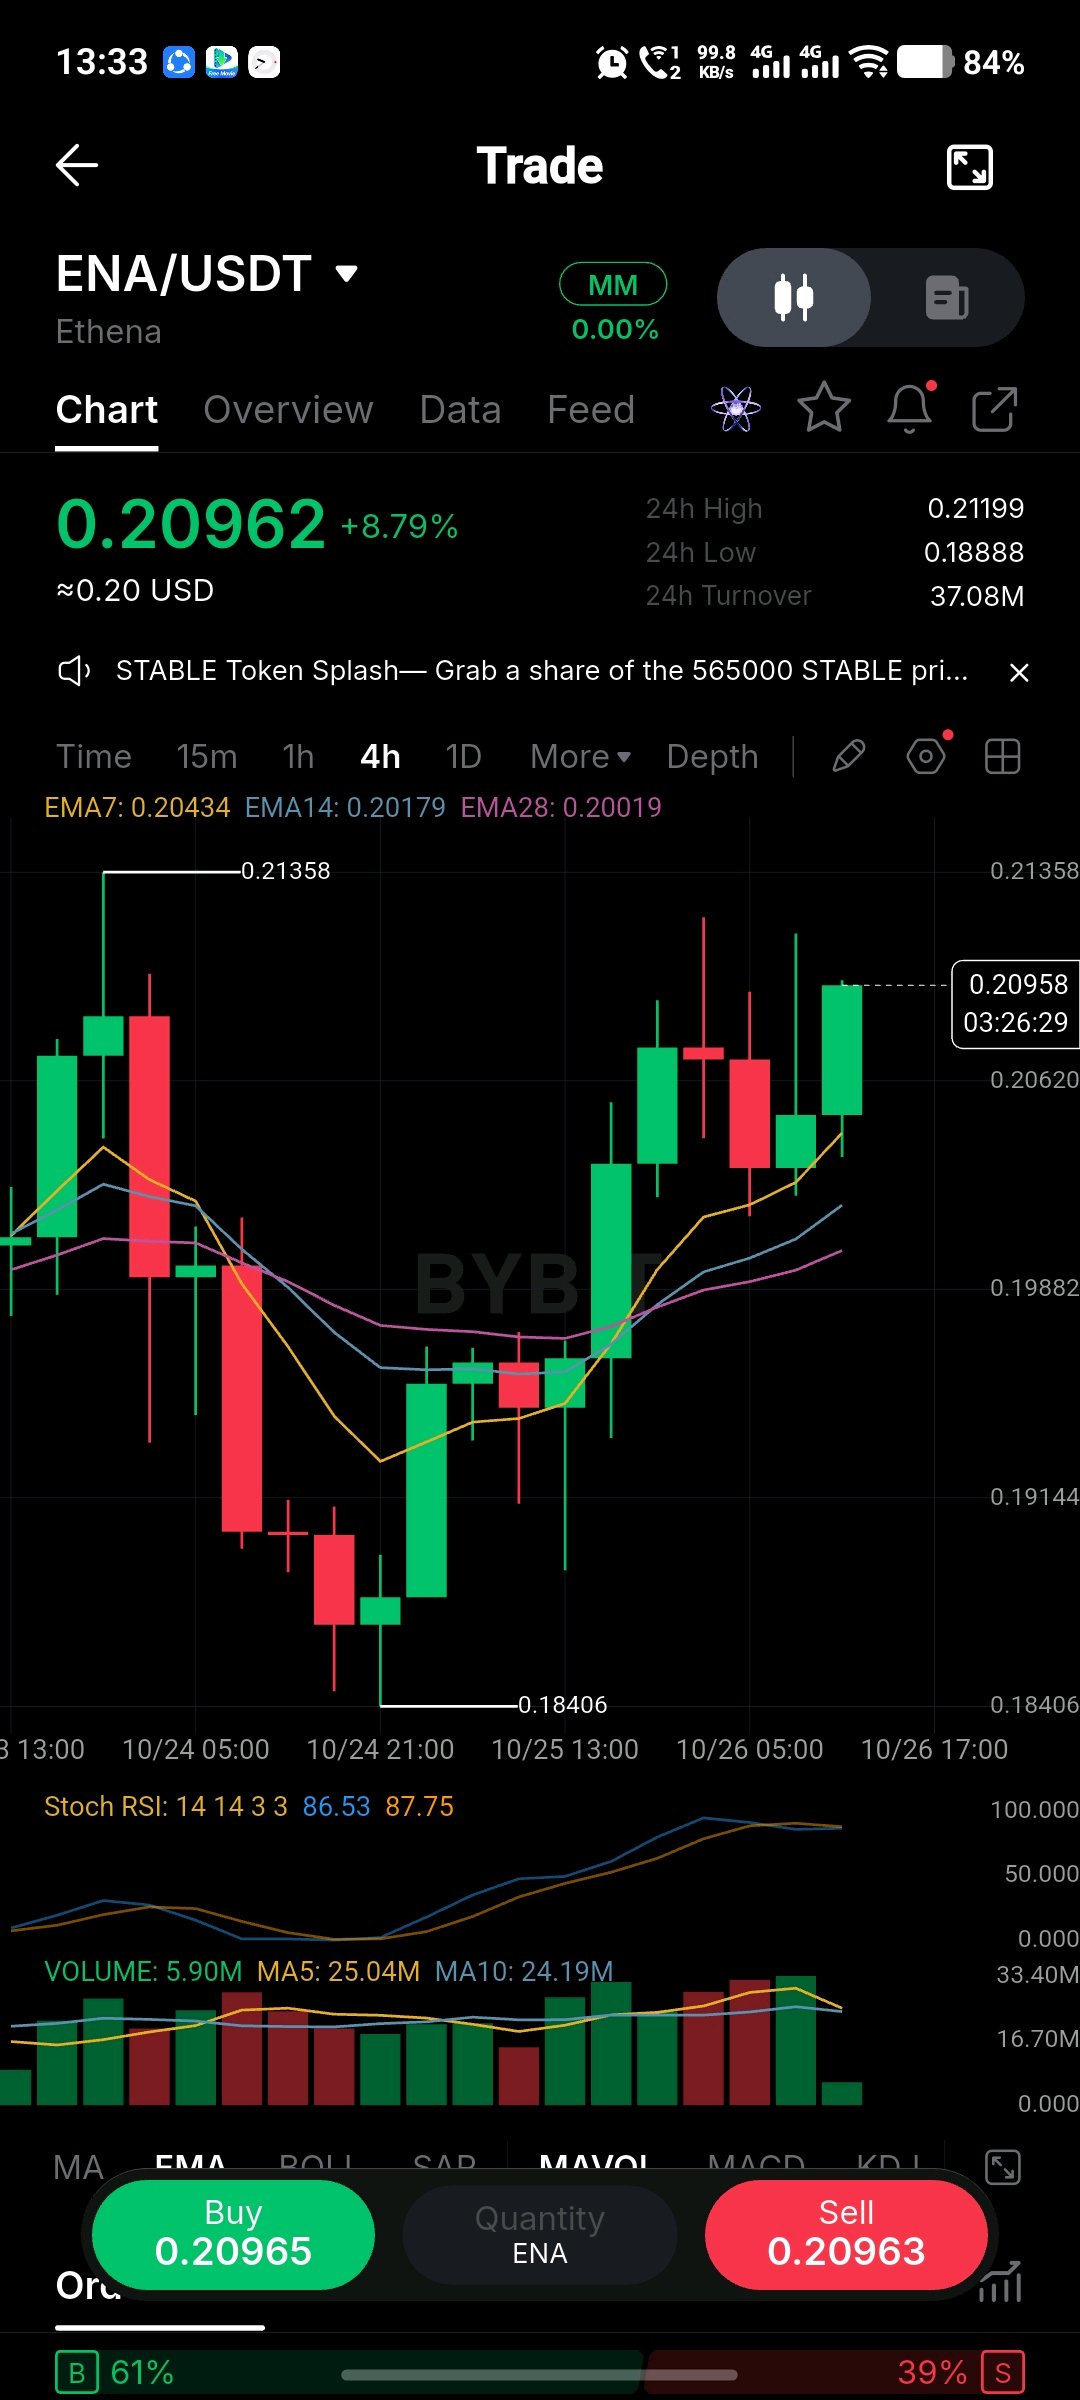
$ENAUSDT Breaks To 0.20962 Near 0.21199 High After Reclaim From 0.18406 $ENAUSDT last 0.20962 +8.79% ∼0.20 USD. 24h high 0.21199 low 0.18888 turnover 37.08M. EMA7 0.20434 EMA14 0.20179 EMA28 0.20019 MarkPrice 0.20958. Chart extremes marked 0.21358 top / 0.18406 bottom. Stoch RSI 86.53 / 87.75 overbought high. Volume 5.90M MA5 25.04M MA10 24.19M. 4H Chart Movement 10/23 spike to 0.21358 with wick rejection, then flush on 10/24 05:00 to 13:00 down to 0.18406 low with double red candles. Base at 0.18406 on 10/24 21:00, then green recovery from 10/25 05:00 onward. Three successive pushes: 10/25 13:00 lift, 10/26 01:00 to 05:00 run to 0.21100 area, pullback at 10/26 09:00, and final green 4H at 03:26:29 printing 0.20958 / 0.20962 back near high. Structure Levels Resistance: 0.21199 / 0.21358 / 0.21358 chart top Current: 0.20962 / 0.20958 Support: 0.20434 / 0.20179 / 0.20019 / 0.18888 / 0.18406 Setup Context Bias: Bullish above 0.20434 EMA7 but stretched Entry: Buy on retest 0.20434 - 0.20179 EMA7/EMA14 zone Break Up: 4H close above 0.21199 / 0.21358 Break Down: 4H close below 0.20019 EMA28 Path Projection: 0.20962 -> 0.21199 -> 0.21358 upside, else 0.20434 -> 0.20179 downside Reason Behind Zones EMA stack bullish 0.20434 > 0.20179 > 0.20019 with price over all three, trend up. Stoch RSI 86.53 / 87.75 near 90 signals overbought, upside may stall under 0.21358 without reset. Volume 5.90M vs MA5 25.04M MA10 24.19M very low, indicating latest push lacks volume fuel and needs expansion above 25.04M. Invalidation Risk Close below 0.18406 low wipes recovery structure and opens drop to 0.17. Holding above 0.20434 keeps momentum toward 0.21199. Does ENA clear 0.21199 from 0.20962 or reject back to 0.20434 first? #ByXIMPACT $ENAUSDT

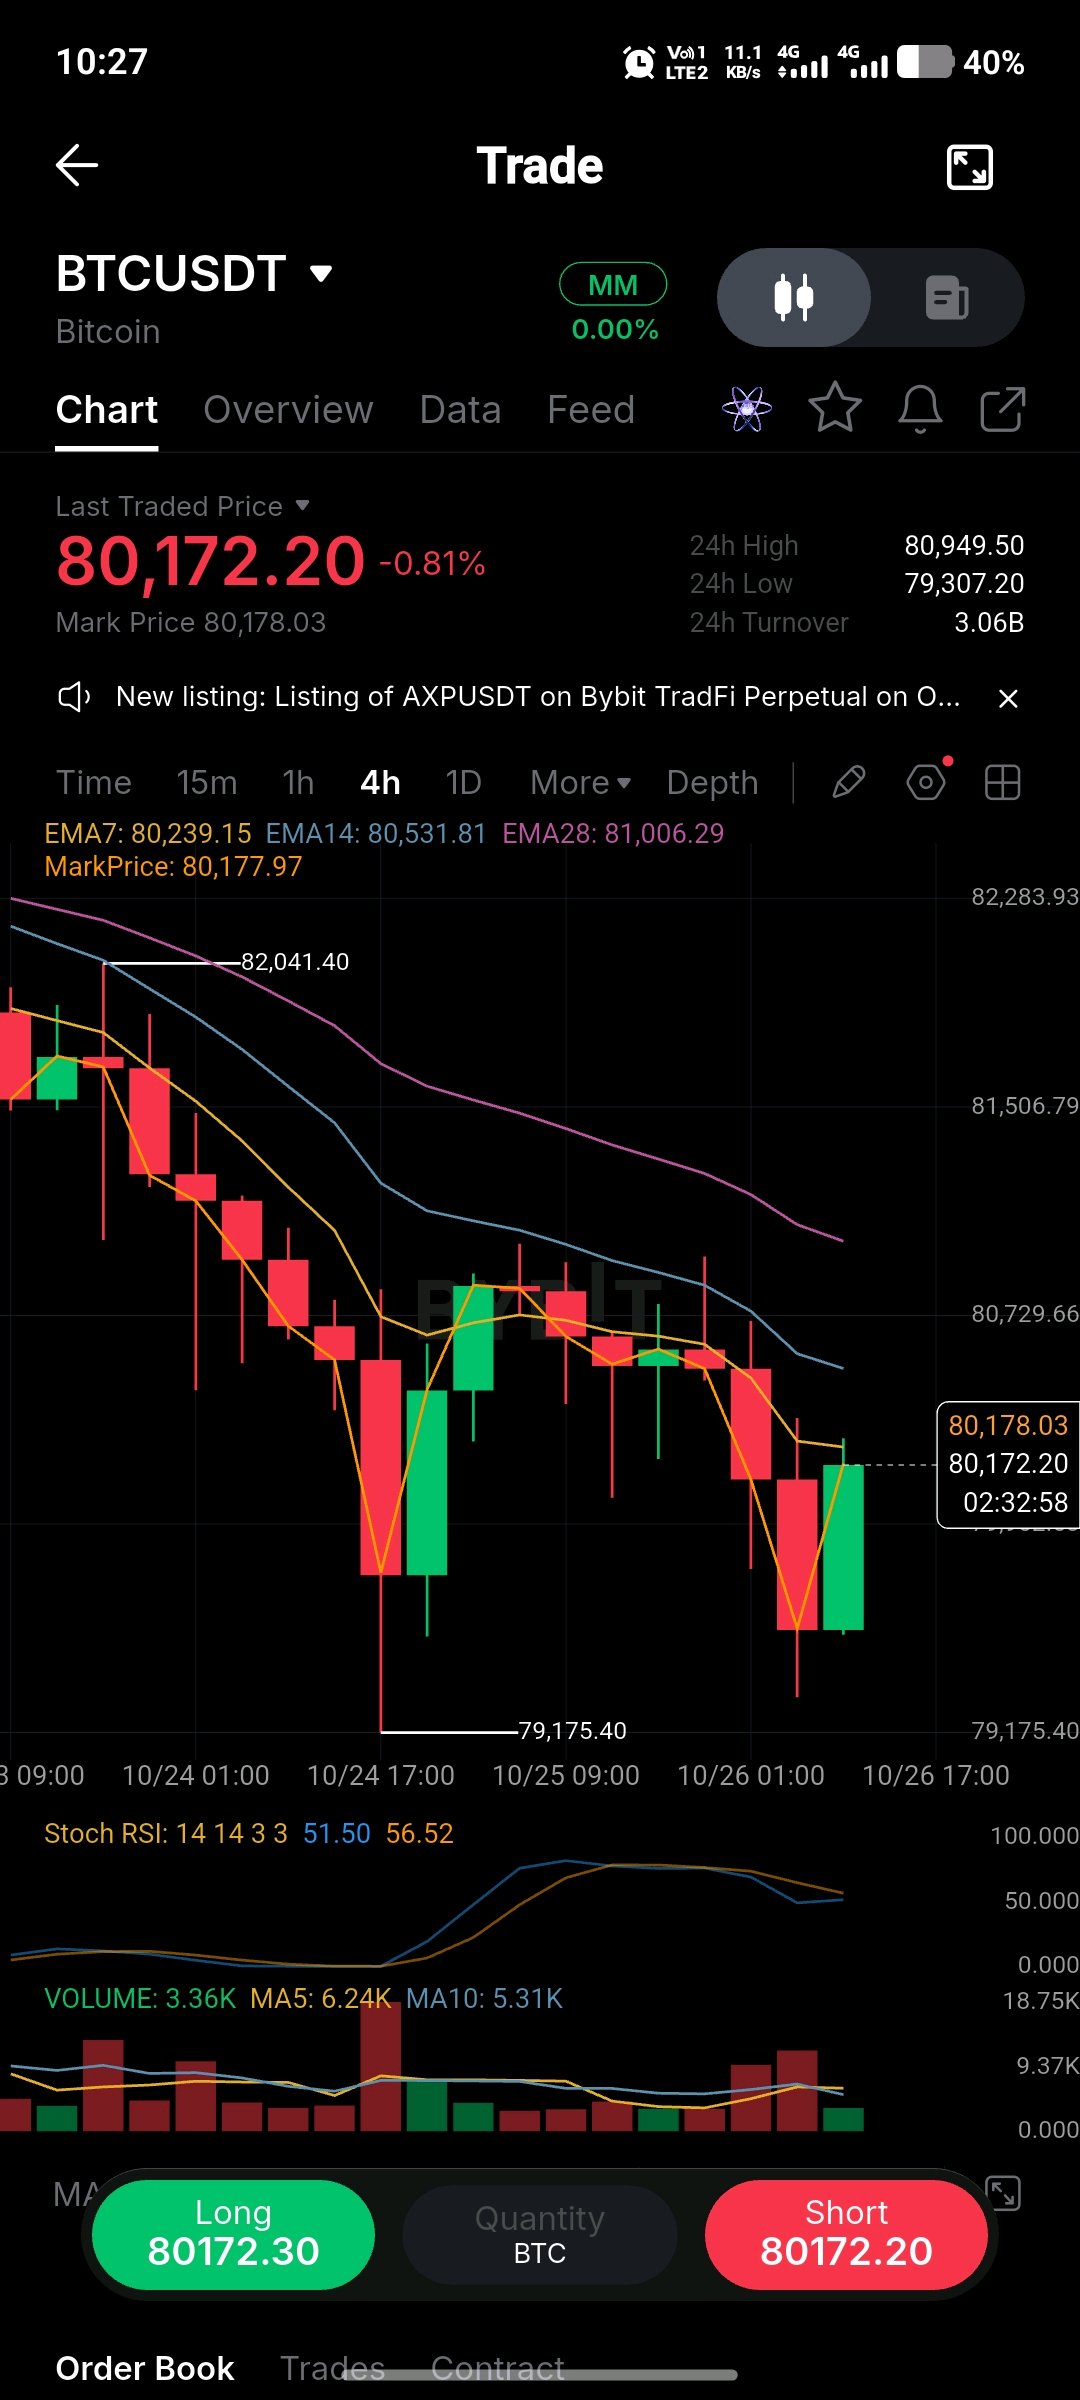
$BTCUSDT BOUNCES TO $80,172 AFTER $79,175 WICK — IS $82,041 STILL CEILING? Bitcoin is printing $80,172.20, -0.81%, Mark Price $80,178.03 on the 4H chart after defending double bottom. The structure defining this week was the breakdown from $82,041.40 at 10/23 21:00 into a violent flush to $79,175.40 on 10/24 17:00 with that long wick, then a second sweep of same $79,175.40 on 10/26 01:00. Current 4H at 02:32:58 shows $80,172.20 / $80,178.03 trying to reclaim EMAs. 🔍 What I’m Watching EMA stack still bearish above price: EMA7: $80,239.15 EMA14: $80,531.81 EMA28: $81,006.29 Current: $80,172.20 Mark: $80,177.97 24h High: $80,949.50 Low: $79,307.20 Turnover: 3.06B Chart extremes: $82,041.40 high / $79,175.40 low Stoch RSI: 51.50 / 56.52 flattening after overbought Volume: 3.36K MA5: 6.24K MA10: 5.31K Price is just under EMA7 $80,239.15 and below EMA14 $80,531.81 / EMA28 $81,006.29, so recovery is not confirmed yet. Stoch RSI 51.50 / 56.52 coming off highs, momentum pausing. Volume 3.36K < MA5 6.24K / MA10 5.31K, so green bounce from $79,175 lacks strong follow. 🧭 Two Levels, Two Different Stories Above $80,239 – $81,006: 4H close over EMA7 $80,239.15 then EMA14 $80,531.81 opens path to EMA28 $81,006.29 and 24h high $80,949.50, then $82,041.40. Below $79,307 – $79,175: Losing 24h low $79,307.20 and chart low $79,175.40 triggers breakdown toward $78,500 – $78,000. 🎯 My Execution Map No long chase at $80,172 under EMAs. Confirmation long: $80,239 4H close above EMA7 Rejection short: $80,531 – $81,006 EMA14/28 band Invalidation: 4H close under $79,175.40 Targets: $80,239 → $80,949 → $82,041 / downside $79,307 → $79,175 EMA7 $80,239.15 is make or break. Holding over it keeps double bottom alive to $80,949. Failing it retests $79,175. $BTCUSDT stuck at $80,172 — do you see a reclaim of $82,041 or another sweep of $79,175? #ByXIMPACT $BTCUSDT

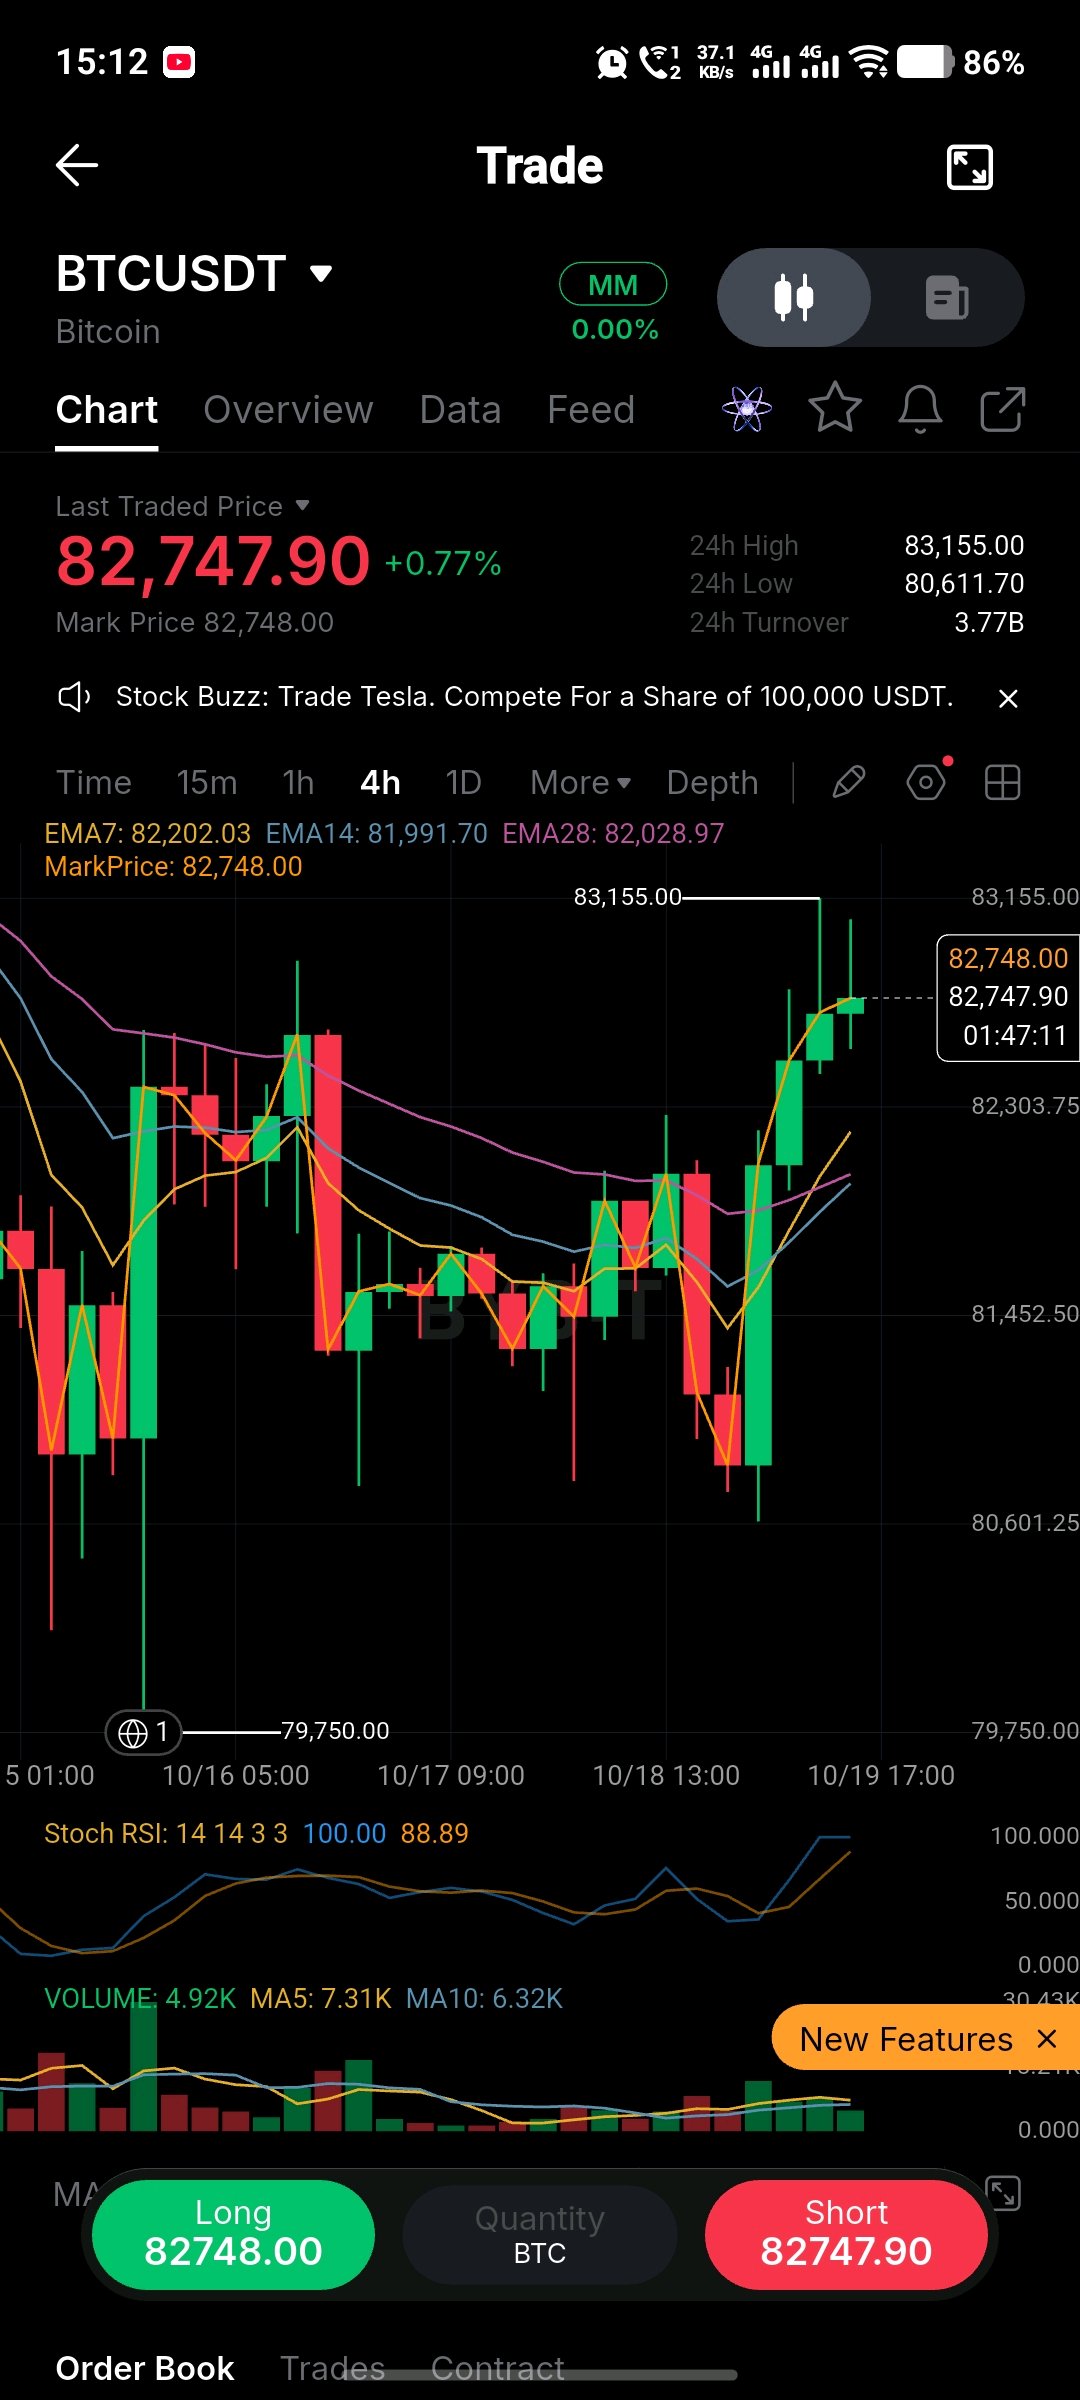
BTC Holds 82747.90 Near 83155.00 High After Bounce From 80611.70 $BTCUSDT last 82,747.90 +0.77% ∼82747.90 USD. 24h high 83,155.00 low 80,611.70 turnover 3.77B. EMA7 82,202.03 EMA14 81,991.70 EMA28 82,028.97 MarkPrice 82,748.00. Chart extremes marked 83,155.00 top / 79,750.00 bottom. Stoch RSI 100.00 / 88.89 fully overbought. Volume 4.92K MA5 7.31K MA10 6.32K. 4H Chart Flow Base near 79,750.00 around 10/15 13:00, then sharp green spike at 10/16 05:00 followed by red rejection. Consolidation 10/16 13:00 to 10/18 13:00 between 81,000 and 82,200 with EMAs flat. On 10/18 21:00 to 10/19 05:00 breakdown to 80,611.25 area, then three straight green 4H candles from 10/19 09:00 pushing to 83,155.00 at 10/19 17:00. Current candle at 01:47:11 printing 82,747.90 / 82,748.00 holding just under wick high. Core Zones Resistance: 83,155.00 / 83,155.00 24h high Current: 82,747.90 / 82,748.00 Support: 82,202.03 / 82,028.97 / 81,991.70 / 80,611.70 / 79,750.00 Execution Framework Bias: Bullish above 82,202.03, extended near top Long idea: 82,202.03 - 81,991.70 EMA7/EMA14 support on retest Break Up: 4H close above 83,155.00 Break Down: 4H close below 81,991.70 Move Map: 82,747.90 -> 83,155.00 -> 83,500 if breaks, else 82,202.03 -> 80,611.70 Why Levels Work Now Price > EMA7 82,202.03 > EMA28 82,028.97 > EMA14 81,991.70 shows bullish flip on 4H. Stoch RSI 100.00 and 88.89 maxed overbought signals late push, risk of pullback while under 83,155.00. Volume 4.92K < MA5 7.31K < MA10 6.32K, so move up lacks volume confirmation, needs expansion above 7.31K for continuation. Failure Case Daily close under 80,611.70 invalidates recovery and opens drop to 79,750.00. Above 83,155.00 squeeze can extend toward 84,000. Is BTC breaking 83155.00 from 82747.90 or topping before pullback to 82202.03? #ByXIMPACT $BTCUSDT
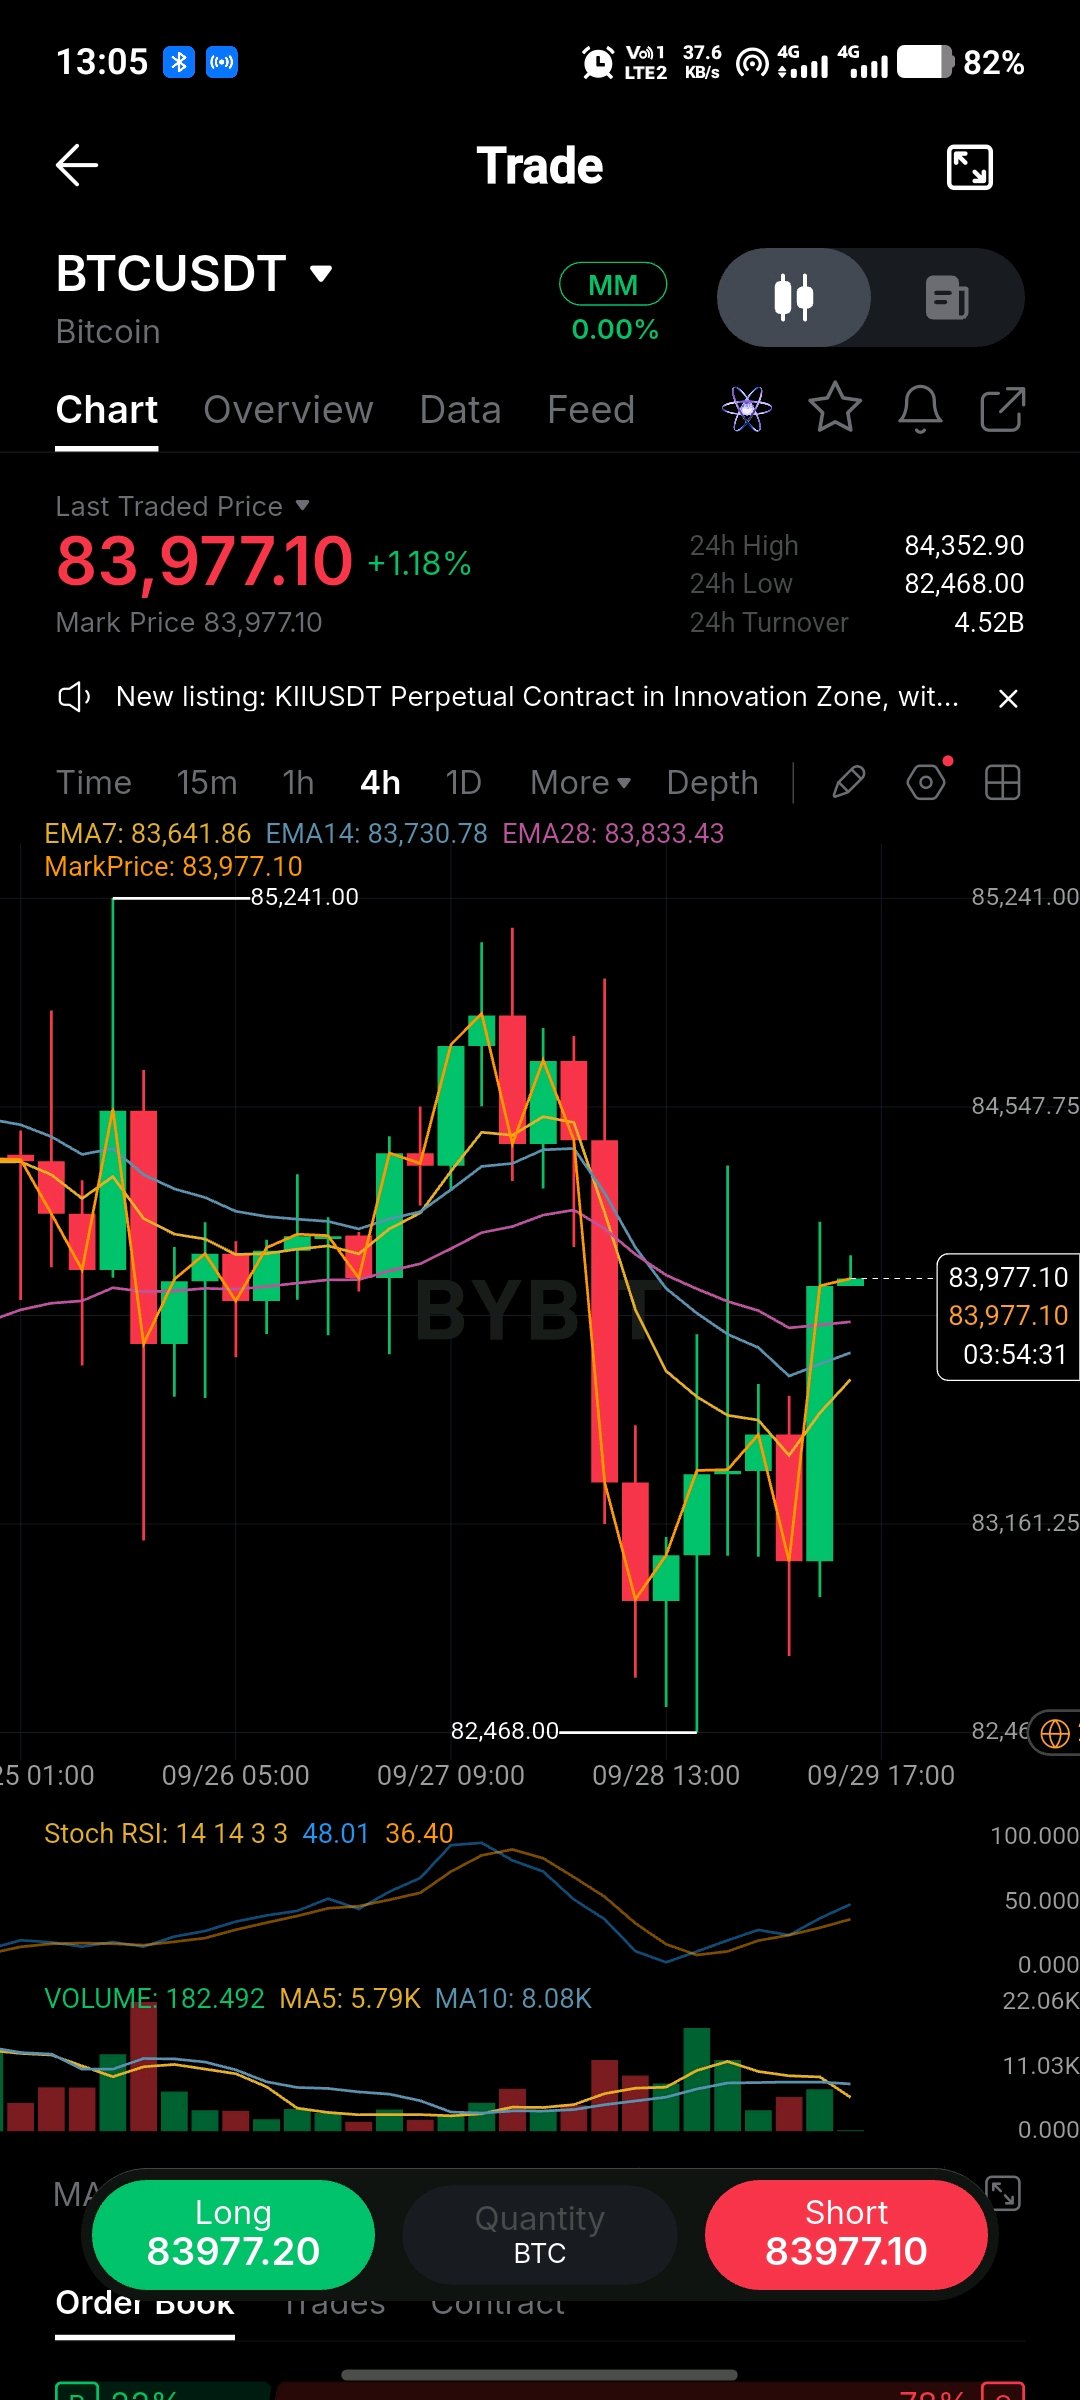
BTC RECLAIMS $83,977 AFTER $82,468 CRASH — SHORT SQUEEZE OR FAKE PUMP? $BTCUSDT is trading at $83,977.10, +1.18%, Mark Price $83,977.10 on the 4H chart, recovering after brutal selloff. The move that shaped this chart was the spike to $85,241.00 on 09/26 01:00 then flush to $82,468.00 low on 09/28 13:00-17:00 with massive red 4H candle. Current 4H at 03:54:31 shows $83,977.10 / $83,977.10 trying to push back above EMA cluster. 🔍 What I’m Watching EMAs are compressing for next move: EMA7: $83,641.86 EMA14: $83,730.78 EMA28: $83,833.43 Current: $83,977.10 Mark: $83,977.10 24h High: $84,352.90 Low: $82,468.00 Turnover: 4.52B Chart marks: $85,241.00 top / $82,468.00 bottom Stoch RSI: 48.01 / 36.40 rising from oversold Volume: 182.492 MA5: 5.79K MA10: 8.08K Price is just over EMA7 $83,641.86, EMA14 $83,730.78 and EMA28 $83,833.43, flipping short-term bullish again. Stoch RSI 48.01 / 36.40 curling up, room left to run. Volume 182.492 still well under MA5 5.79K / MA10 8.08K, so this bounce lacks strong fuel yet. Two Levels, Two Different Stories Above $83,977 – $84,352.90: 4H close over $84,352.90 reclaims 24h high. Then $84,547 → $85,241.00 retest opens. Below $83,641.86 – $83,161: If BTC fails under EMA7 $83,641.86, it slips back to $83,161 zone and retests $82,468.00 low. Losing $82,468.00 opens $81,800. 🎯 My Execution Map Not chasing $83,977 mid-recovery. Breakout confirmation: $84,352.90 4H close Pullback long: $83,730 – $83,641 EMA14/EMA7 support Invalidation: 4H close under $82,468.00 Targets: $83,977 → $84,352 → $85,241 Key is EMA28 $83,833.43. Holding above it keeps squeeze alive to $84,352. Losing it brings back $82,468. 💬 Do you think BTC holds $83,641 from $83,977 to squeeze toward $85,241 or drops back to $82,468? #ByXIMPACT $BTCUSDT

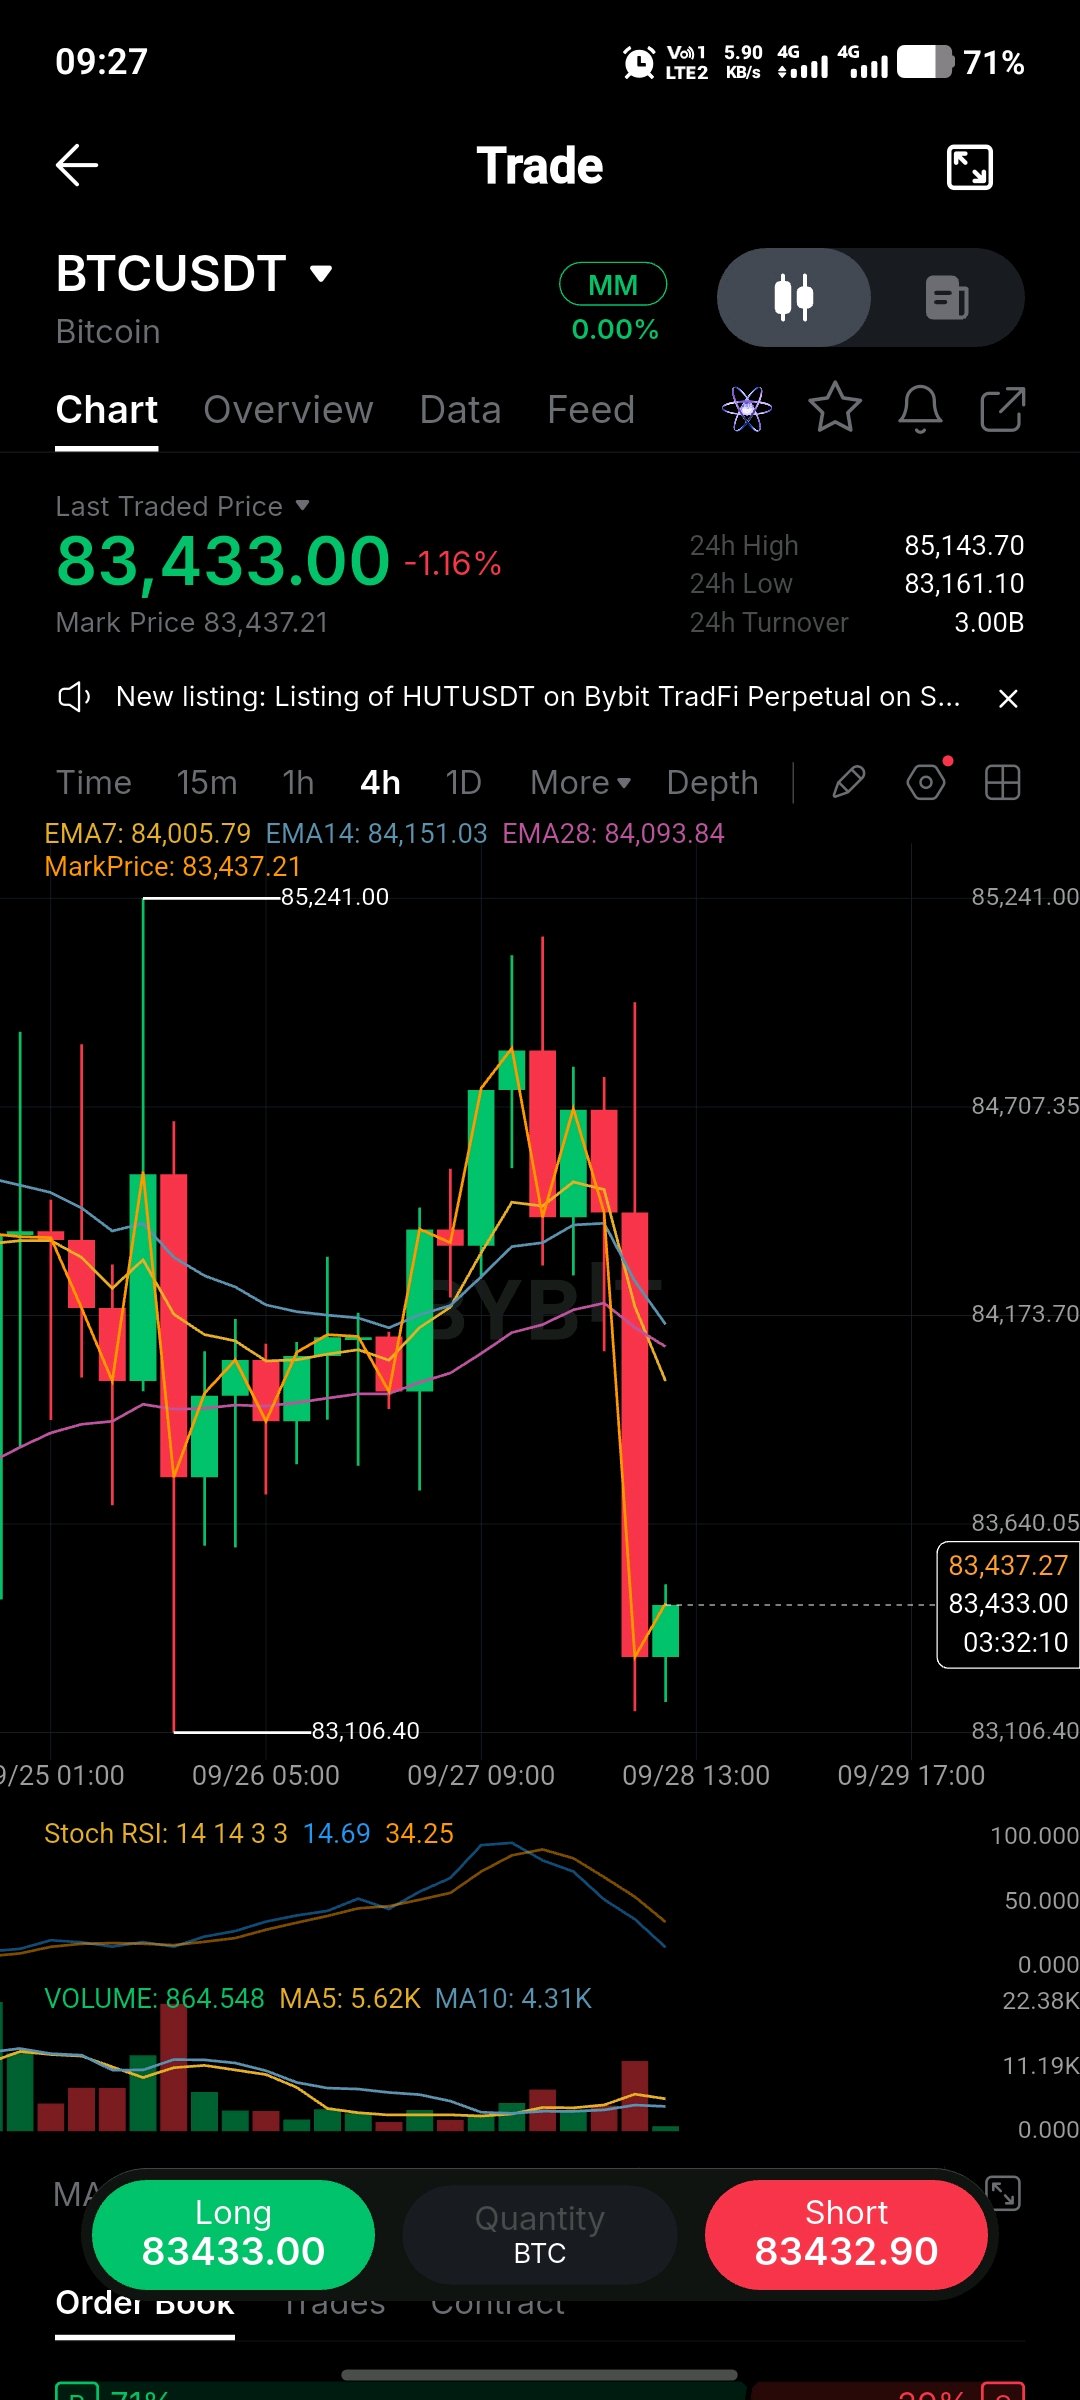
BTC Drops To 83433.00 After Rejection From 85241.00 Down 1.16% $BTCUSDT last 83,433.00 -1.16% ∼83433.00 USD. 24h high 85,143.70 low 83,161.10 turnover 3.00B. EMA7 84,005.79 EMA14 84,151.03 EMA28 84,093.84 MarkPrice 83,437.21. Chart extremes marked 85,241.00 top / 83,106.40 bottom. Stoch RSI 14.69 / 34.25 bearish cross. Volume 864.548 MA5 5.62K MA10 4.31K. 4H Chart Action Sharp wick to 85,241.00 on 09/26 03:00 followed by immediate red dump to 83,106.40 at 09/26 05:00, then slow grind up to 09/27 09:00 to 09/27 21:00 reclaiming near 85,143.70. Fresh breakdown appears on 09/28 09:00 to 13:00 with two heavy red 4H candles collapsing to 83,433.00. Current candle at 03:32:10 printing 83,433.00 / 83,437.27 well below all EMAs. Key Levels Resistance: 85,241.00 / 85,143.70 / 84,151.03 / 84,093.84 / 84,005.79 Current: 83,433.00 / 83,437.21 Support: 83,161.10 / 83,106.40 Trade Context Bias: Bearish under 84,005.79 Short idea: 84,005 - 84,151 retest rejection Break Down: 4H close under 83,106.40 Break Up: 4H close over 84,151.03 Path: 83,433.00 -> 83,106.40 -> 83,161.10 if weak, else 84,005.79 -> 85,143.70 Reason For Zones Price under EMA7 84,005.79, EMA14 84,151.03, EMA28 84,093.84 indicates momentum flipped. Stoch RSI 14.69 and 34.25 oversold, possible bounce but trend down until reclaim. Volume 864.548 vs MA5 5.62K MA10 4.31K shows selling volume cooling, but turnover 3.00B still high meaning liquidity active. Invalidation Scenario Hold below 83,106.40 opens extension to 82,500. Recovery above 84,151.03 would cancel bear case and aim for 85,241.00. Is BTC going to lose 83106.40 from 83433.00 or will bulls defend 83161.10 for reversal? #ByXIMPACT $BTCUSDT #BybitAIBestReplies #MakeYourMove