DAVID
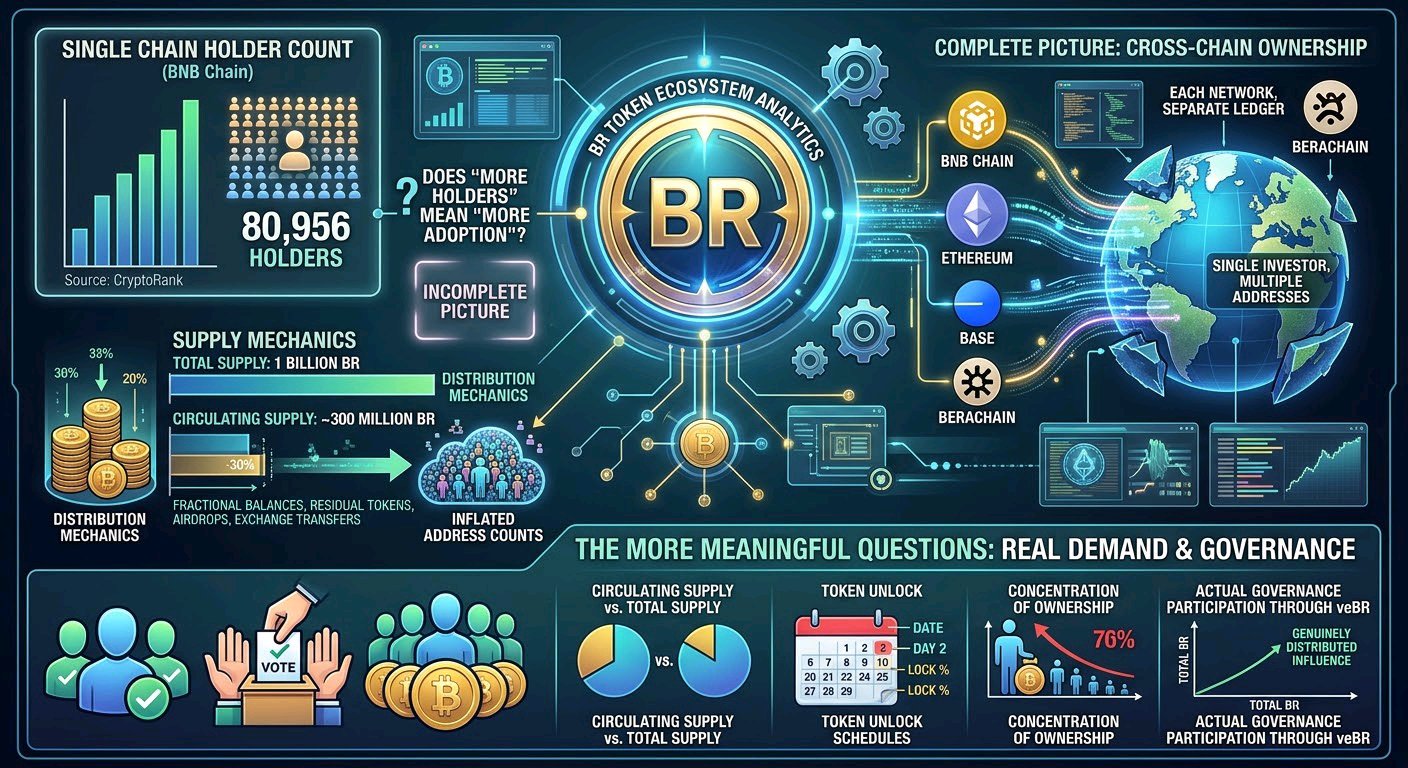
Bedrock’s BR token currently has approximately 80,956 holders on BNB Chain, with 1 billion BR in total supply, according to CryptoRank’s live holder tracker as of October 27, 2026. That’s a substantial address count for a governance token built around liquid restaking — although “more holders” and “more meaningful participation” are not the same thing. "Source: CryptoRank" holders) Here’s the part that matters if you’ve ever looked at a holder-growth chart and assumed it represented organic demand: BR is deployed across BNB Chain, Ethereum, Base and Berachain, so a single-chain holder count is not a complete picture of ownership across the ecosystem. Each network maintains its own ledger, and an address holding BR on one chain is not automatically evidence of a separate investor. Fractional balances, residual tokens from swaps, airdrops and exchange-related transfers can also inflate address counts without representing meaningful new demand. Bedrock’s token distribution is particularly important here: reported supply data shows 1 billion BR in total supply, while circulating supply is approximately 300 million. A rising holder count could reflect broader participation, but it could also reflect distribution mechanics and small-balance wallets. I can’t confirm the cause of any specific holder-count change from aggregate data alone. For BR, the more meaningful questions concern circulating supply, token unlocks, concentration of ownership and actual governance participation through veBR. Those metrics help distinguish wider distribution from genuinely distributed influence. If BR’s holder count keeps growing, how much does that tell you about adoption when the number of addresses says nothing by itself about how much supply they control or how actively they participate? #ByXIMPACT $BRUSDT
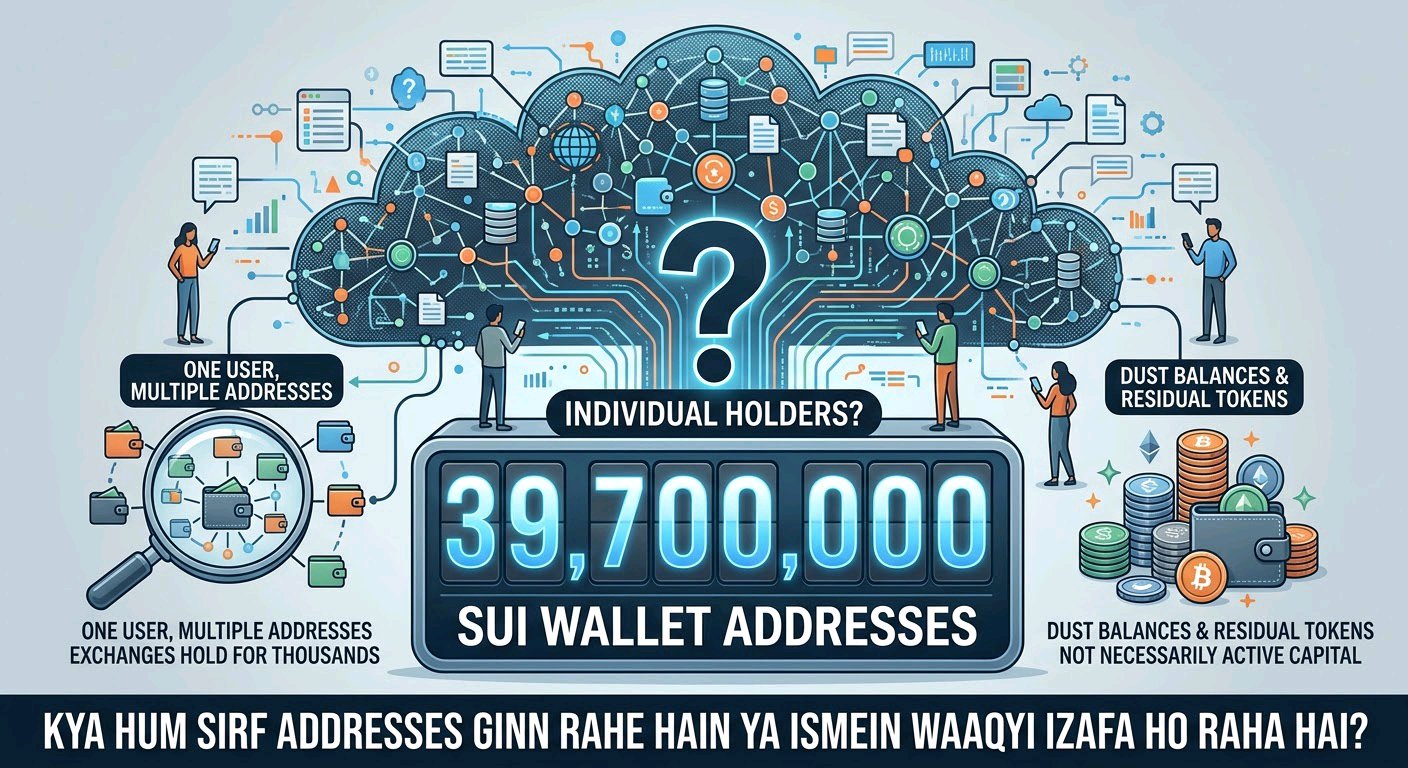
SUI’s holder count currently stands at approximately 39.7 million addresses, according to Token Terminal’s latest available weekly metric as of October 27, 2026. That is a substantial address base for a network built around high-throughput transactions and low fees. The irony is that a network designed to make blockchain activity cheaper can also make raw participation numbers considerably easier to inflate. Here’s the part that matters if you’ve ever looked at a growing holder chart and assumed it meant organic demand: Token Terminal counts unique addresses holding a non-zero balance of native SUI, not verified individual investors. One person can control multiple wallets, while exchanges and custodians can hold assets on behalf of thousands of customers. Sui’s object-based architecture also means that wallet activity and ownership patterns do not necessarily map neatly to the number of independent users. Dust balances, residual tokens from swaps, incentive distributions and newly created wallets can all contribute to the count without representing meaningful new capital. That makes holder growth a useful adoption signal, but a weak standalone measure of demand. I couldn’t verify a reliable, comparable 24-hour holder-count change from the available data, so attributing a specific increase or decrease to accumulation, distribution or wallet cleanup would be speculation. The more useful question is whether those addresses are actually using the network, supplying liquidity, paying transaction fees or holding economically meaningful balances. Sui’s own tokenomics documentation sets a maximum supply of 10 billion SUI, with circulating supply changing as scheduled token releases occur. Those figures, alongside active addresses, transaction activity, fees and DeFi liquidity, offer a more complete picture than holder counts alone. Next time someone uses SUI’s 39.7 million holders as proof of adoption, ask yourself: are millions of independent users actually creating demand, or are we counting addresses and calling it growth #ByXIMPACT $SUIUSDT $SUIUSDC
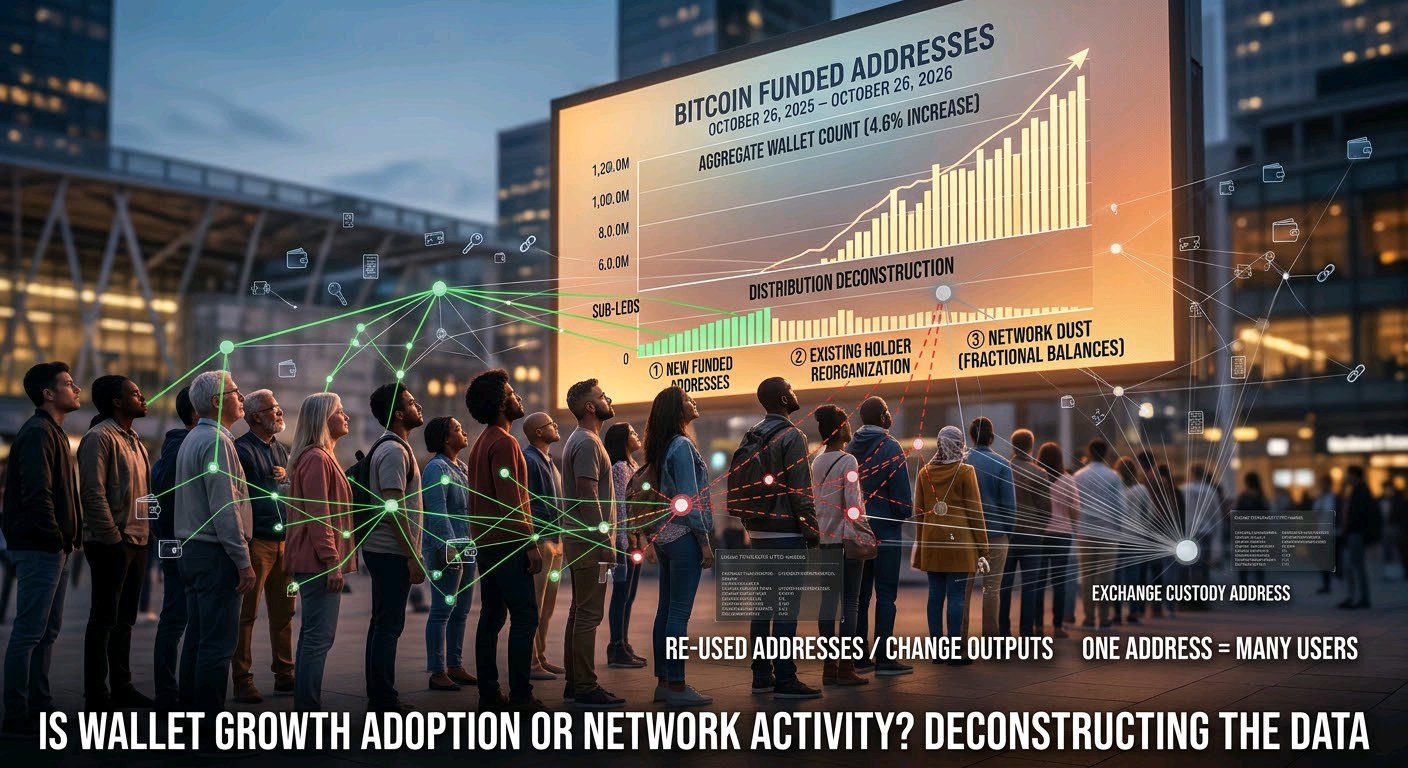
Bitcoin’s holder count needs a different kind of scrutiny than a typical multi-chain token. BTC’s core pitch is monetary scarcity, yet even a wallet-count chart can make ordinary address activity look like a change in ownership. The important distinction is between new addresses appearing on the Bitcoin ledger and new people actually accumulating bitcoin. According to Maketo’s Bitcoin address tracker, funded BTC addresses increased from 54,668,355 on October 26, 2025, to 57,206,793 on October 26, 2026 — a rise of 2,538,438 addresses, or 4.6%. On the surface, that looks like expanding participation in an asset whose defining feature is a hard supply limit. Here’s the part that matters if you’ve ever treated a rising Bitcoin wallet count as proof of organic demand: an address is not a person, and Bitcoin is not an account-based ledger in the same way as Ethereum. One individual can control thousands of addresses, while a single exchange address can represent the balances of millions of customers. Bitcoin’s UTXO model also creates new output addresses through ordinary transactions, including change outputs returned to the sender. Fractional balances, down to one satoshi, can leave tiny amounts distributed across addresses. Wallet reorganizations, exchange custody changes, and routine consolidation can all alter address statistics without representing new investors entering the market. The 2.54 million increase is real under the tracker’s definition, but interpreting it as 2.54 million new Bitcoin owners would be a mistake. Address creation is consistent with growing participation, yet it cannot establish how many independent people bought BTC, how much fresh capital entered, or whether existing holders simply reorganized their coins. I can’t confirm the cause of the increase from address counts alone, and neither can a dashboard that only reports the total. The more meaningful context is the supply itself: Bitcoin’s protocol caps issuance at 21 million BTC, while on-chain supply distribution and exchange flows help explain how existing coins are held and moved. Those metrics answer different questions from the number of funded addresses. If Bitcoin’s address count rises 4.6% while the number of actual owners remains unknown, are we measuring adoption or simply counting the architecture of the network? #ByXIMPACT $BTCUSDT
Ethereum recorded 2,251,163 addresses in Glassnode’s “New” ETH holder cohort as of October 14, 2026. That sounds like a substantial wave of new participation for an asset whose investment thesis is increasingly framed around infrastructure, settlement, and long-term utility. But address growth is not quite the same thing as adoption. Here’s the part that matters when someone points to a rising ETH holder chart as proof of organic demand: Glassnode’s metric identifies addresses that interacted with ETH for the first time in the preceding 30 days and still held a non-zero balance. It does not count unique people, verify independent investors, or measure how much capital those addresses represent. Ethereum’s ecosystem also extends across layer-2 networks, where activity and asset movements may not appear in mainnet address statistics in the same way. Then there’s the technical reality. Ethereum supports balances down to 18 decimal places, so even a tiny amount of ETH can leave an address holding a non-zero balance. Residual funds from swaps, failed transactions, airdrop-related activity, and wallet fragmentation can all complicate address-level interpretation. Exchanges and custodians can also consolidate funds across wallets without changing the underlying economic ownership. A growing address count may reflect genuine new users, routine wallet activity, or a mixture of both. I can’t confirm the cause from address data alone. The more meaningful metrics are ETH supply dynamics, staking participation, transaction fees, and sustained economic activity across Ethereum and its layer-2 ecosystem. Etherscan tracks supply and network activity, while Glassnode’s own cohort methodology distinguishes new, retained, and churned addresses for a reason: a wallet appearing on-chain is not the same as an investor committing meaningful capital. Next time someone celebrates ETH holder growth as proof of adoption, ask the question that actually matters: are more people using Ethereum economically, or are we simply counting more addresses? #ByXIMPACT $ETHUSDT
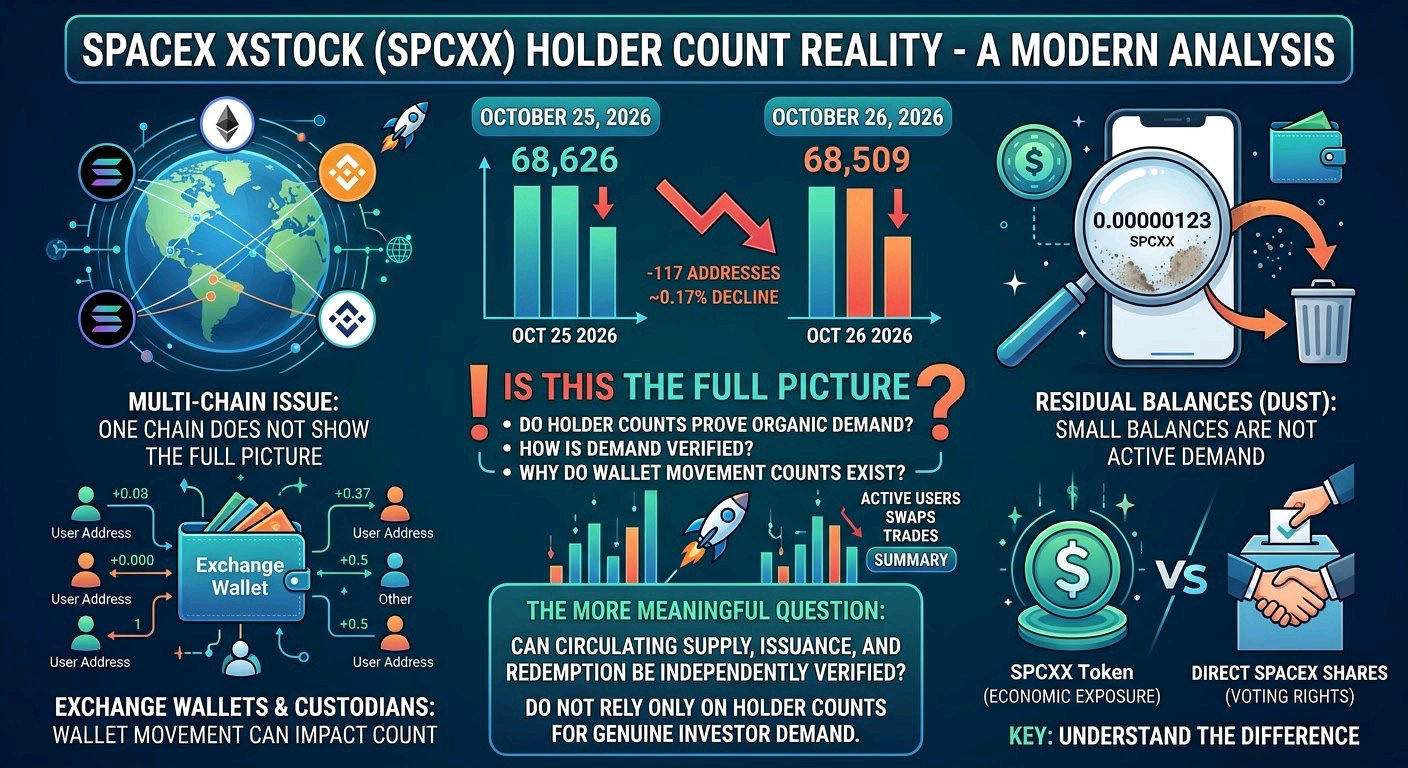
SpaceX xStock (SPCXX) saw its tracked holder count fall from 68,626 to 68,509 between October 25 and October 26, 2026 — a decline of 117 addresses, or approximately 0.17%, according to NexFlow’s historical on-chain data. Not exactly the kind of dramatic movement you would expect from an asset marketed around tokenized exposure to one of the world’s most closely watched private companies. Here’s the part that matters if you’ve ever treated a growing holder count as proof of organic demand: SPCXX exists across multiple blockchain networks, and a Solana holder tracker measures only the accounts it identifies on that network. It does not provide a complete picture of ownership across every chain or centralized exchange. With eight decimal places on Solana, small residual balances can also remain after swaps, transfers, or other transactions. Exchange wallets and custodians can further complicate the picture when assets move between accounts or are consolidated. A change of 117 addresses is therefore not evidence that 117 investors abandoned their exposure. Routine wallet activity is a plausible explanation, although I can’t confirm the cause from the holder snapshots alone. The more meaningful question is whether the token’s circulating supply, issuance and redemption records, and underlying collateral can be independently verified. SPCXX provides tokenized economic exposure to SpaceX; it is not the same as directly owning SpaceX shares or receiving shareholder voting rights. If holder counts can change with wallet activity, differ across chains, and include accounts holding negligible balances, why treat the number of addresses as a reliable measure of genuine investor demand? #ByXIMPACT $SPCXXUSDT
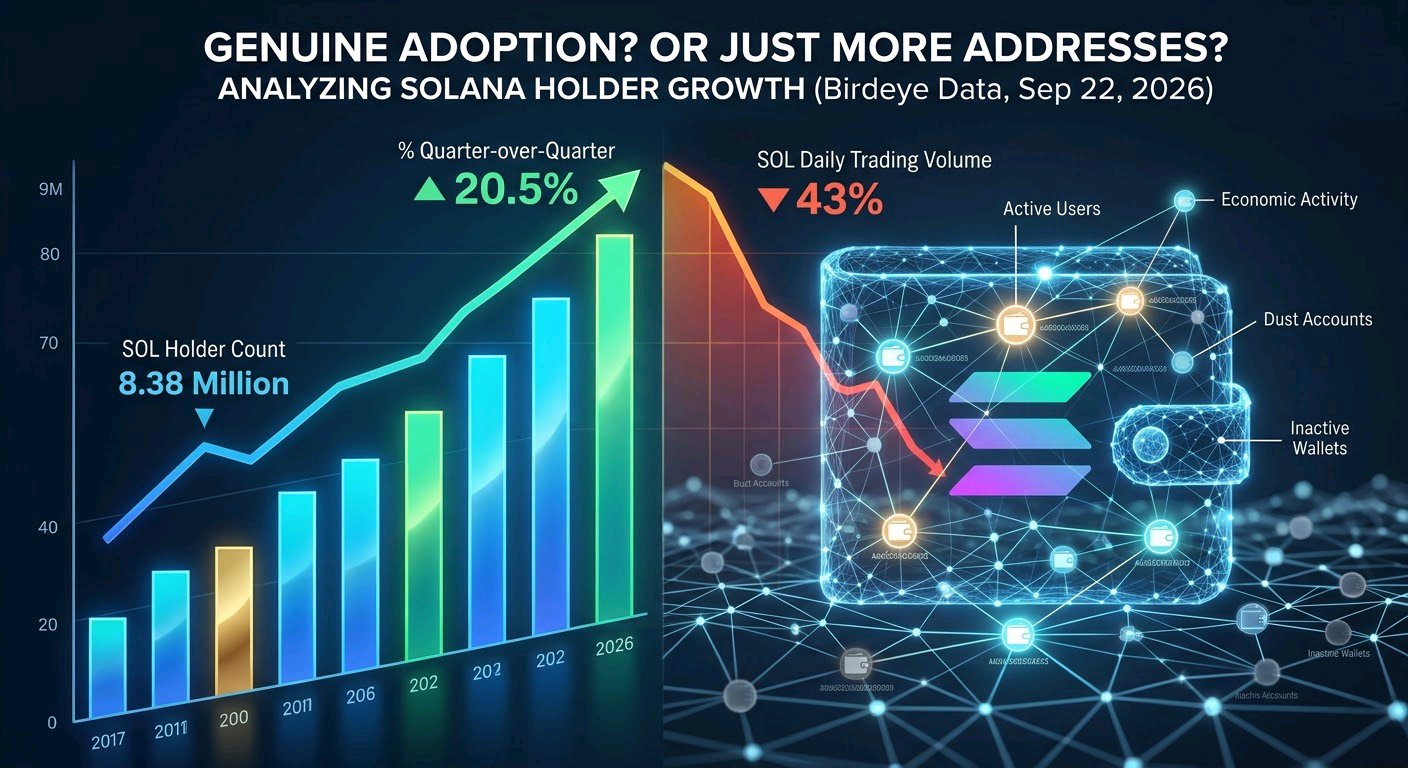
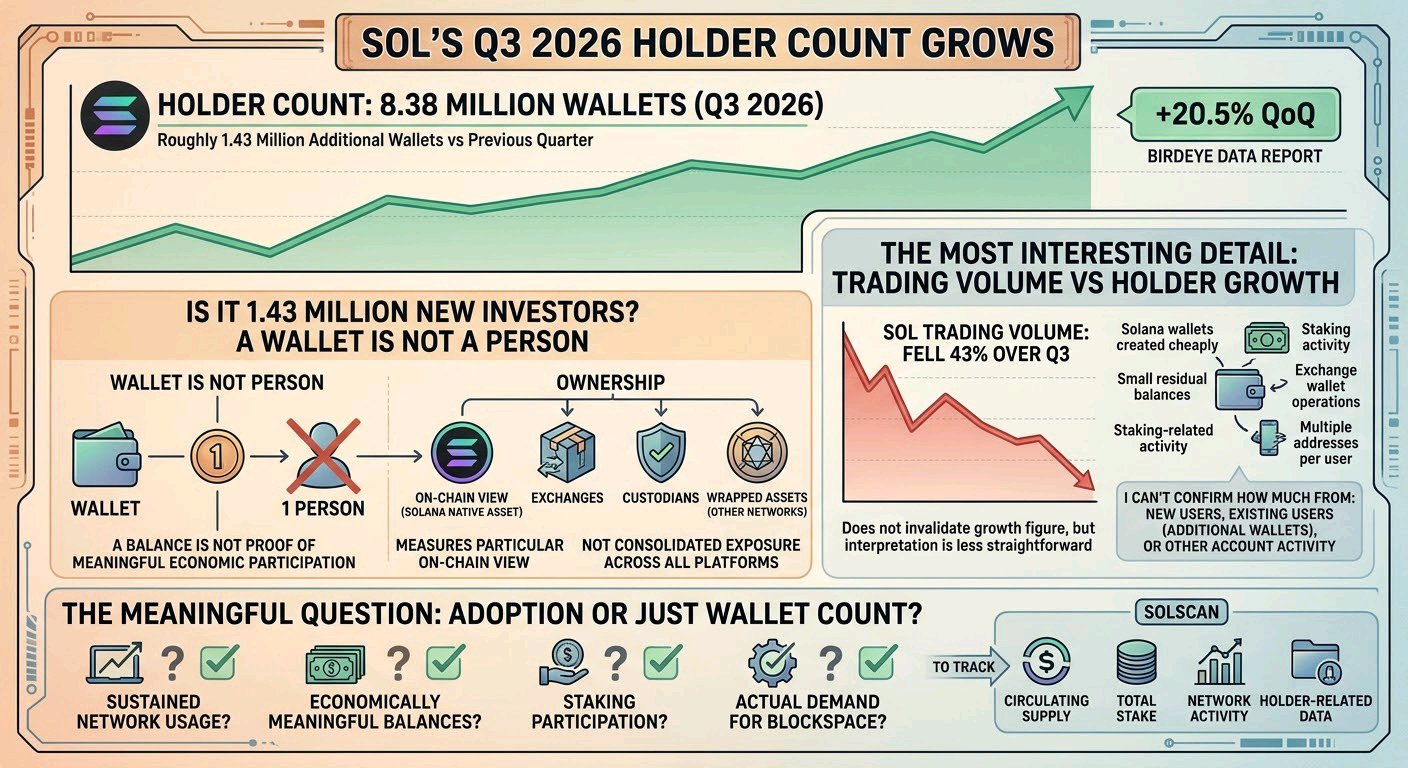
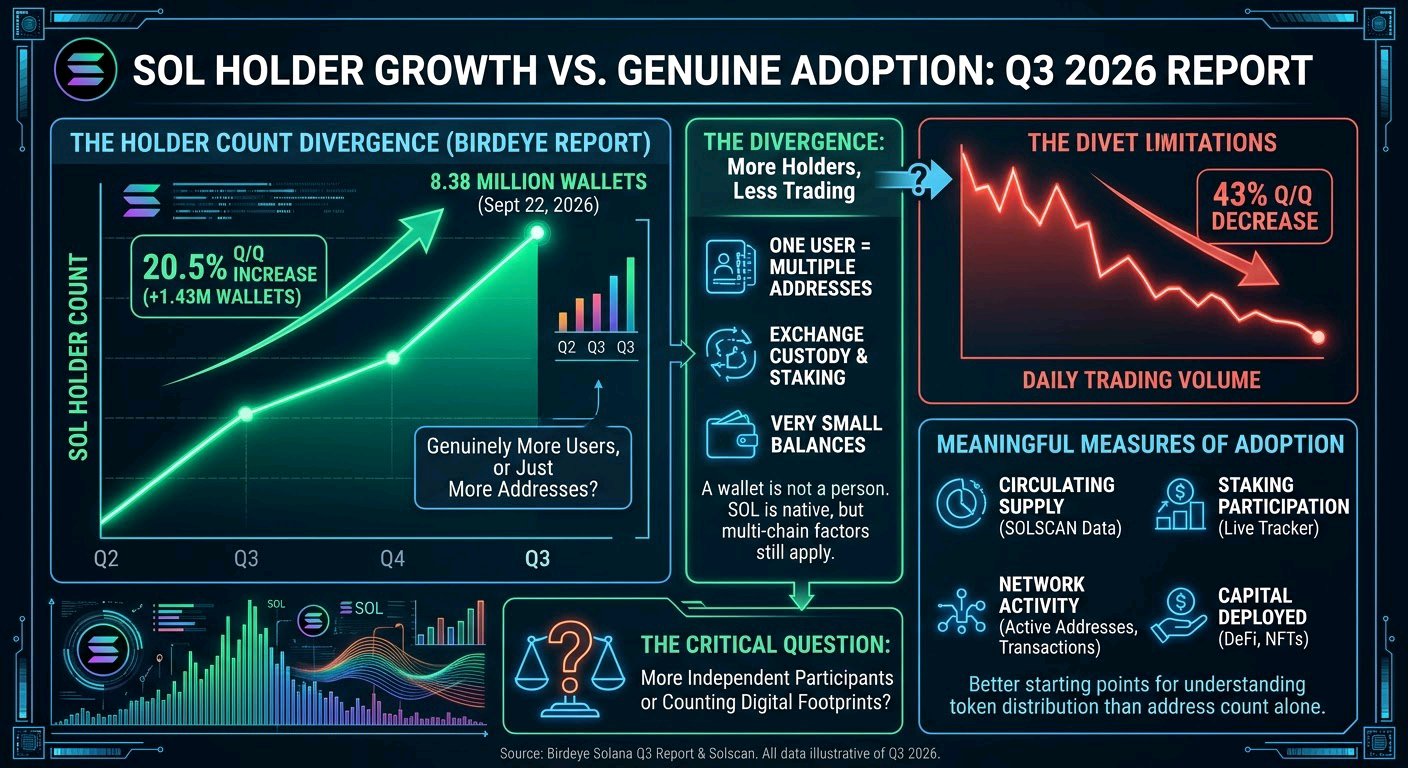
#ByXIMPACT SOL’s holder count climbed 20.5% quarter-over-quarter to 8.38 million wallets by September 22, 2026, according to Birdeye Data’s Q3 Solana report. That’s roughly 1.43 million additional wallets holding SOL, which sounds reassuring for a network whose pitch is scalable, low-cost infrastructure. More holders, however, do not automatically mean more committed users. Here’s the part that matters if you’ve ever looked at a “holder growth” chart and assumed it meant organic demand: a wallet is not a person, and a balance is not proof of meaningful economic activity. Birdeye’s report recorded holder growth even as Solana’s daily trading volume fell 43% from Q2. Those two numbers can coexist because holding and actively using SOL are different behaviors. Small residual balances, wallets created for individual applications, exchange deposit addresses, and custodial accounts can all complicate the interpretation of address-level data. Without a detailed breakdown of the counting methodology and wallet composition, it is difficult to determine how much of that 20.5% increase represents new independent participants rather than additional addresses or operational activity. I can’t confirm the cause of the increase from aggregate holder data alone. The more useful question is whether that expanding address base translates into sustained network activity, fee generation, and economically meaningful demand for SOL. Active addresses, transaction activity, fee revenue, staking participation, and supply distribution provide different pieces of that picture; none should be treated as a substitute for the others. Birdeye’s figures establish that its measured holder count increased, not that 1.43 million new people independently adopted SOL. If holder counts can rise while trading activity declines, are we measuring genuine adoption—or simply counting more addresses?$SOLUSDT
XRP Ledger recorded 4,853 new accounts in the last 24 hours as of October 26, 2026, according to XRPL Dashboard, which tracks account creation directly from the network. That is a meaningful increase in ledger activity for an asset whose core pitch is utility and payments infrastructure although new accounts are not the same thing as new buyers. Here’s the part that matters if you’ve ever looked at an XRP “holder growth” chart and assumed it meant organic demand: an account is not a person, and account creation is not proof of a purchase. The XRP Ledger requires accounts to meet its reserve requirements, and one individual can control multiple accounts while a single exchange account can hold XRP for thousands of customers. Some accounts hold only tiny balances, while others exist for operational purposes rather than independent investment. XRP also appears in wrapped or bridged forms on other networks, so counting native XRP Ledger accounts does not capture every form of XRP exposure across the broader ecosystem. A jump of 4,853 accounts in a day may indicate new participation, but it could also reflect application onboarding, automated account creation, or operational activity. I can’t confirm the cause from account-creation data alone, and neither can anyone treating that number as a direct measure of investor demand. The more useful metrics are actual payment activity, transaction volume, exchange balance changes, and XRP’s circulating supply. These provide different pieces of evidence about whether the network is being used and how the asset is distributed. The ledger recorded approximately 8.27 million funded accounts as of October 26, 2026, but that is a count of ledger accounts, not verified individual holders. Next time someone celebrates XRP holder growth as proof of adoption, are they measuring genuine economic activity or simply counting how many accounts the ledger contains? #ByXIMPACT $XRPUSDT $XRPUSDC

#ByXIMPACT Bedrock (BR) is showing a different kind of market signal on October 26, 2026: approximately 80,972 holders on BNB Chain, while the top 100 wallets control roughly 99.75% of the token supply, according to CryptoRank’s holder tracker. That is an interesting distribution for a project built around staking liquidity and governance — the infrastructure story may be broad, but token ownership deserves a closer look. The first impression is that BR has attracted a substantial address base. But holder count is not the same thing as independent ownership. BR exists across multiple networks, and BNB Chain’s holder count captures only addresses recorded against that particular token contract. It does not tell us how many unique people own BR across the entire ecosystem. There is another technical detail worth considering. The BNB Chain contract uses 18 decimal places, and BscScan records balances as tiny as 0.00000000000011643 BR. Such residual balances can remain in an address long after meaningful trading activity has stopped. Exchanges, custodians, and contract interactions can also complicate the relationship between wallet counts and actual beneficial owners. That does not prove that dust explains BR’s holder statistics, but it illustrates why an address should not automatically be counted as an active investor. I can’t confirm the cause of any holder-count movement from these snapshots alone, and I couldn’t verify a reliable, dated 24-hour holder-count change. The more useful question is whether BR’s token economics and underlying protocol activity support the narrative. DefiLlama reports a total supply of 1 billion BR, approximately 296.67 million circulating, and roughly $55,464 in protocol fees over the past 30 days. These figures offer more context than a wallet count in isolation. If holder growth can include dust balances, exchange wallets, and addresses spread across multiple chains, are we measuring genuine adoption — or simply counting entries in a ledger? $BRUSDT
SOL’s holder count rose 20.5% quarter-on-quarter to 8.38 million wallets in Q3 2026, according to Birdeye Data’s report published on September 24, 2026. That implies roughly 1.43 million additional wallets holding SOL compared with the previous quarter. Quite a result for a network whose real proposition is supposed to be fast, inexpensive settlement and usable blockchain infrastructure, not simply a growing wallet count. Here’s the part that matters if you’ve ever looked at a “holder growth” chart and assumed it meant 1.43 million new investors entering the market: a wallet is not a person, and a balance is not proof of meaningful economic participation. SOL is the native asset of Solana, so this figure is not a consolidated count of every SOL exposure across exchanges, custodians and wrapped representations on other networks. It measures a particular on-chain view of ownership, not the entire universe of people with exposure to SOL. The more interesting detail is that SOL trading volume reportedly fell 43% over the same quarter, even as holder numbers increased. That does not invalidate the growth figure, but it does make the interpretation less straightforward. Solana wallets can be created cheaply, and small residual balances, staking-related activity, exchange wallet operations and multiple addresses controlled by one user can all complicate the picture. Some tracking methodologies exclude certain minimal-balance accounts, but the exact filters vary by data provider. I can’t confirm how much of the increase came from new users, existing users creating additional wallets, or other account activity from this headline statistic alone. The more meaningful question is whether that wider wallet base translates into sustained network usage, economically meaningful balances, staking participation and actual demand for blockspace. Solscan tracks circulating supply, total stake and network activity alongside holder-related data for precisely this reason. If SOL’s holder count can rise 20.5% while trading activity falls sharply, shouldn’t we ask what those wallets are actually doing before calling the increase adoption? $SOLUSDT #ByXIMPACT
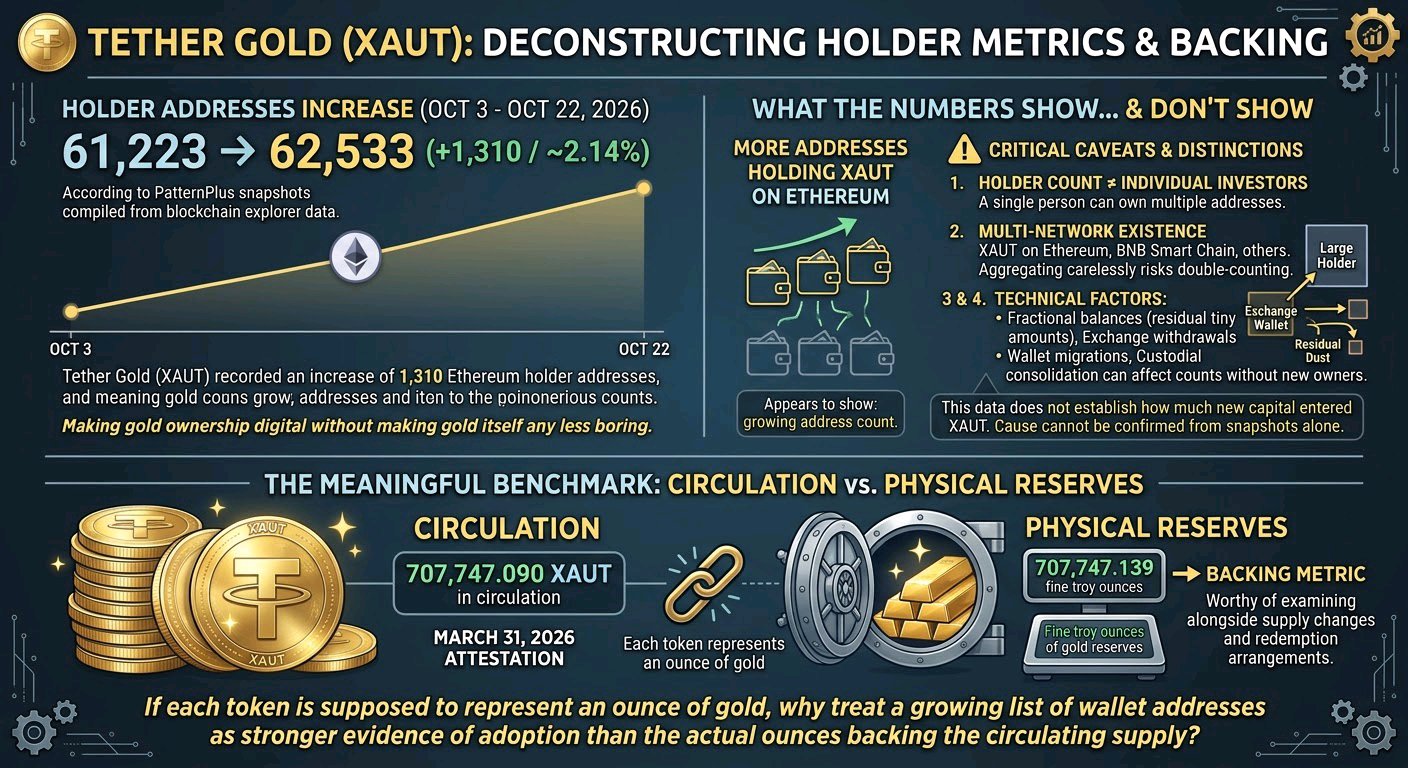
#ByXIMPACT Tether Gold (XAUT) recorded an increase of 1,310 Ethereum holder addresses, rising from 61,223 on October 3 to 62,533 on October 22, 2026 — a gain of approximately 2.14%, according to PatternPlus snapshots compiled from blockchain explorer data. Not bad for an asset whose entire pitch is making gold ownership digital without making gold itself any less boring. Here’s what that number appears to show: more addresses are holding XAUT on Ethereum. But before treating that as proof of organic adoption, there’s an important distinction to make. An Ethereum holder count is not a complete measure of XAUT ownership across every supported network, and an address is not necessarily an individual investor. The technical caveat is that XAUT exists across multiple networks, including Ethereum and BNB Smart Chain, with additional supported network deployments documented by Tether. Each ledger has its own address count, so aggregating them carelessly can double-count holders who use more than one network. Fractional balances also matter: an address can remain on a holder list because it retains a tiny residual amount after swaps, transfers or trading activity. Exchange withdrawals, wallet migrations and custodial consolidation can change address counts without representing an equivalent change in the number of people owning gold. The 2.14% increase is consistent with a growing Ethereum address count, but it does not establish how much new capital entered XAUT. I can’t confirm the cause of that increase from holder snapshots alone. The more meaningful benchmark is the relationship between XAUT in circulation and the physical gold held in reserve. In its March 31, 2026 attestation, Tether reported 707,747.090 XAUT in circulation against 707,747.139 fine troy ounces of gold reserves. That is the backing metric worth examining alongside supply changes and redemption arrangements. If each token is supposed to represent an ounce of gold, why treat a growing list of wallet addresses as stronger evidence of adoption than the actual ounces backing the circulating supply? $XAUTUSDT
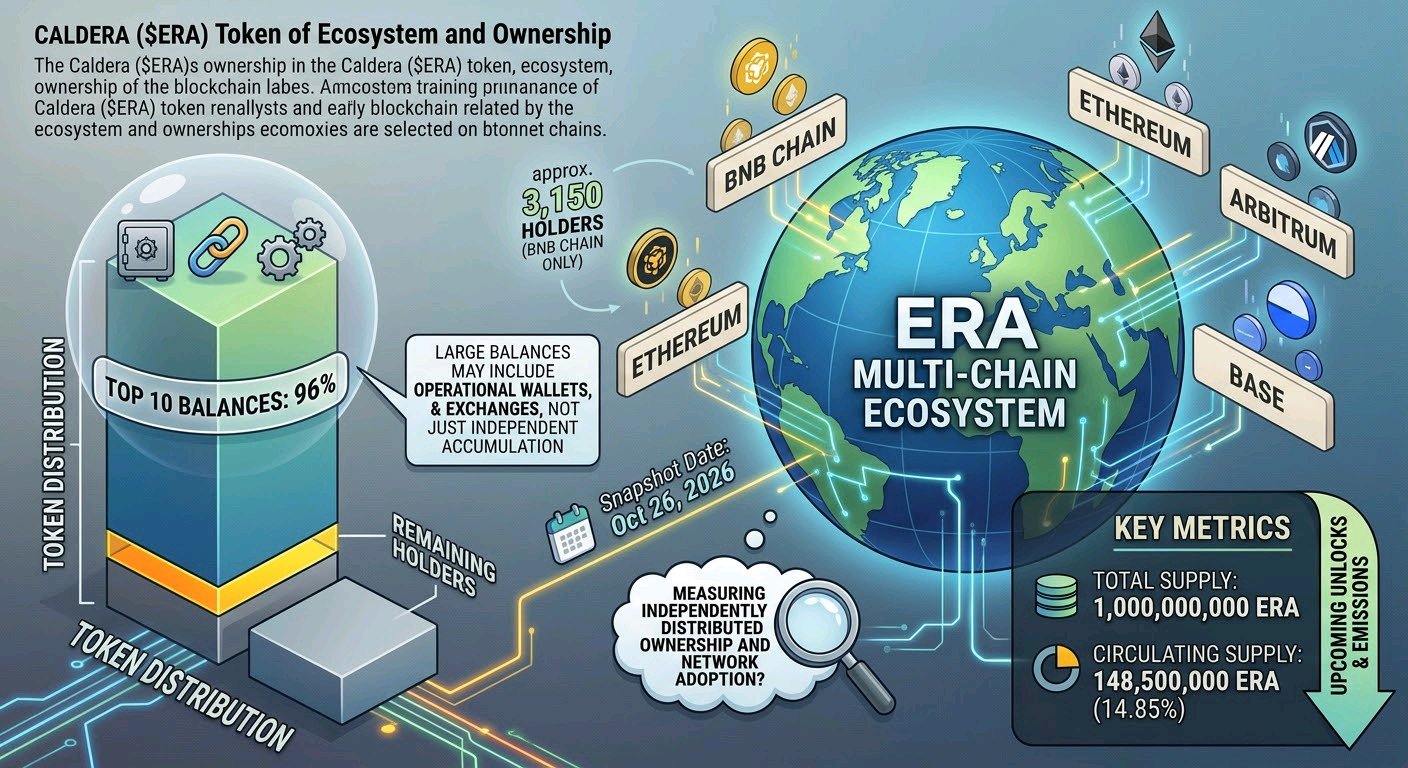
Caldera’s ($ERA) BNB Chain token contract shows approximately 3,150 holders, while its 10 largest balances account for 96.0% of the tracked supply as of October 26, 2026, according to DexBrief’s on-chain snapshot. That’s a concentrated distribution for a project whose core pitch is making blockchain infrastructure more scalable and interconnected. Here’s the part that matters if you’ve ever looked at a holder chart and assumed more addresses automatically mean broader adoption: this snapshot covers a specific BNB Chain contract, not the entire ERA ecosystem. Caldera’s official token also exists on Ethereum, with deployments listed across networks including Arbitrum and Base. Those deployments must be examined separately before drawing conclusions about ownership across the ecosystem. A wallet holding ERA on one network is not necessarily a new independent investor, and the same entity can control multiple addresses across several chains. There’s another important distinction: the 96.0% figure measures concentration, not selling pressure. Large balances can include exchange custody, bridge-related addresses, liquidity infrastructure, or other operational wallets. Without verifying ownership labels and tracing transfers, it would be premature to interpret the distribution as either coordinated accumulation or imminent selling. I can’t confirm the beneficial owners of these balances from the available snapshot alone, and an address count cannot establish how many independent participants actually hold the token. The more meaningful context is circulating supply and its distribution over time. CoinMarketCap lists ERA’s total supply at 1 billion tokens and circulating supply at approximately 148.5 million, or 14.85% of the maximum supply. That makes unlocks, emissions, and changes in circulating supply important metrics to track alongside holder concentration. If Caldera is building infrastructure intended to connect blockchain ecosystems, shouldn’t we be measuring independently distributed ownership and actual network adoption rather than treating a raw holder count as proof of organic growth? #MyByXTake $ERAUSDT
SOL’s holder count climbed 20.5% quarter-over-quarter to 8.38 million wallets by September 22, 2026, according to Birdeye’s Solana Q3 report. That’s roughly 1.43 million additional wallets holding SOL in a single quarter, on an asset whose investment thesis is often reduced to network adoption and ecosystem growth. Here’s the part that matters if you’ve ever looked at a rising holder-count chart and assumed it meant an equivalent increase in genuine demand: a wallet is not a person, and holding SOL is not the same as actively using the network. One user can control multiple addresses, while exchange custody, staking arrangements, and wallets holding very small balances can all complicate the interpretation. SOL is the native asset of Solana, so the multi-chain caveat is different from that of a token deployed across several networks; wrapped SOL and SOL held through custodial services still require careful treatment when comparing datasets. The more interesting detail is that Birdeye reported SOL’s daily trading volume fell 43% quarter-over-quarter even as the holder count increased. That divergence is consistent with expanding ownership alongside weaker trading activity, but it does not prove that every new wallet represents organic adoption. The more meaningful measures are circulating supply, staking participation, network activity, and capital actually deployed across Solana’s applications. Solscan’s live tracker separately reports circulating and non-circulating SOL supply, providing a more concrete starting point for understanding token distribution than an address count alone. So when SOL holder growth is presented as proof of adoption, the real question is: are more independent participants genuinely using and holding SOL, or are we simply counting more addresses? #MyByXTake $SOLUSDT
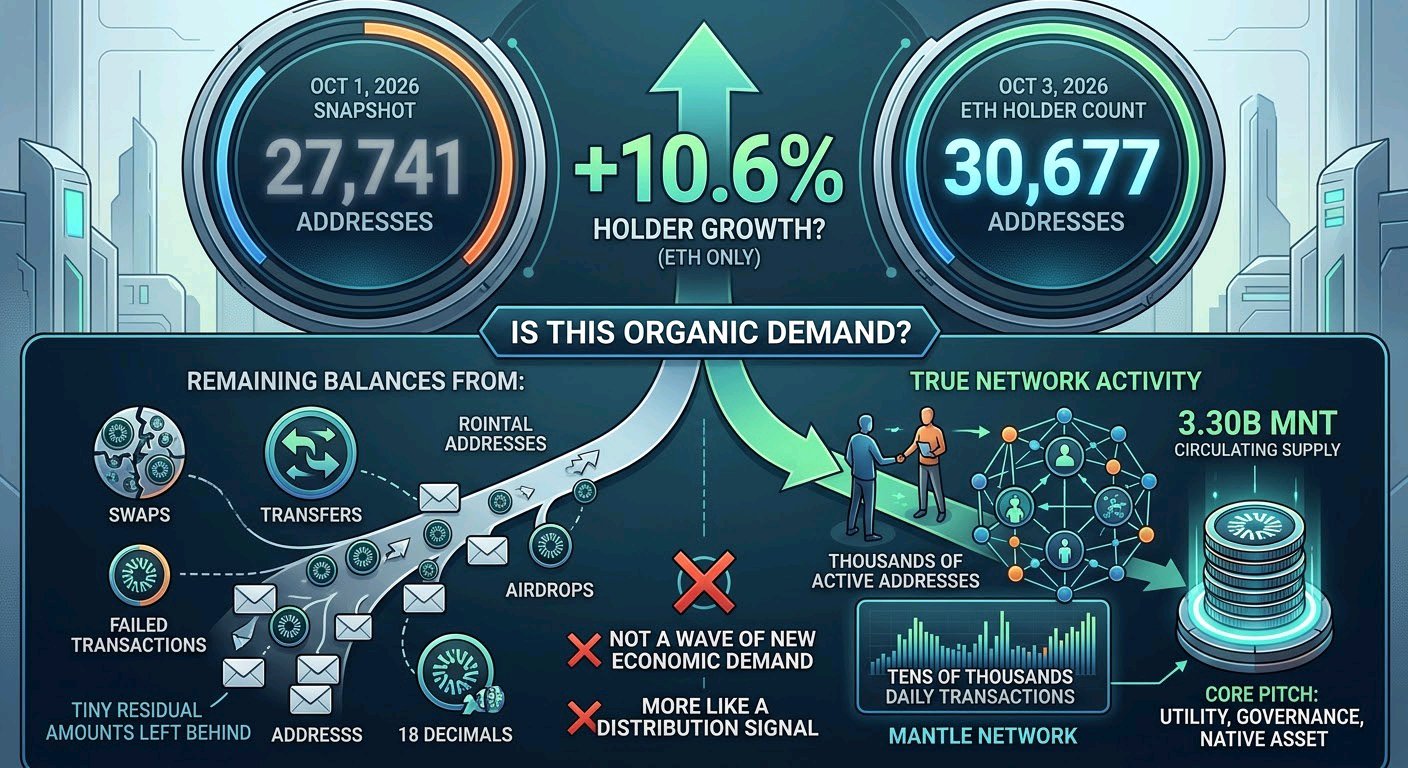
MNT Ethereum holder count appears to have climbed roughly 10.6%, from 27,741 addresses in a recent Routescan snapshot to 30,677 addresses as of October 3, 2026, according to explorer data. That’s a noticeable increase for a token whose core pitch is utility, governance and being the native asset of the Mantle network. Here’s the part that matters if you’ve ever looked at “holder growth” and assumed it automatically meant organic demand: that number is Ethereum-specific. MNT is also the native asset of Mantle, and substantial supply is held across the ecosystem, so an Ethereum holder count is only one ledger-level snapshot. MNT also uses 18 decimals, which makes it possible for tiny residual balances to remain attached to addresses after swaps, transfers, failed transactions or airdrops. Exchanges, bridges and custodians can later consolidate those balances, creating holder-count changes that have little to do with people entering or leaving the asset. The recent increase therefore looks more like a distribution signal than proof of a wave of new economic demand — and because the snapshots come from different explorers, I can’t confirm the exact cause of the change from on-chain data alone. For MNT, the more meaningful numbers are circulating supply and actual network activity. Current data puts circulating supply around 3.30B MNT, while Mantle’s network records thousands of active addresses and tens of thousands of daily transactions. So when someone presents “MNT holders are growing” as evidence of adoption, the better question is: are those new addresses actually using MNT, or are we just counting more addresses on one chain? $MNTUSDC $MNTUSD1 #ByXIMPACT
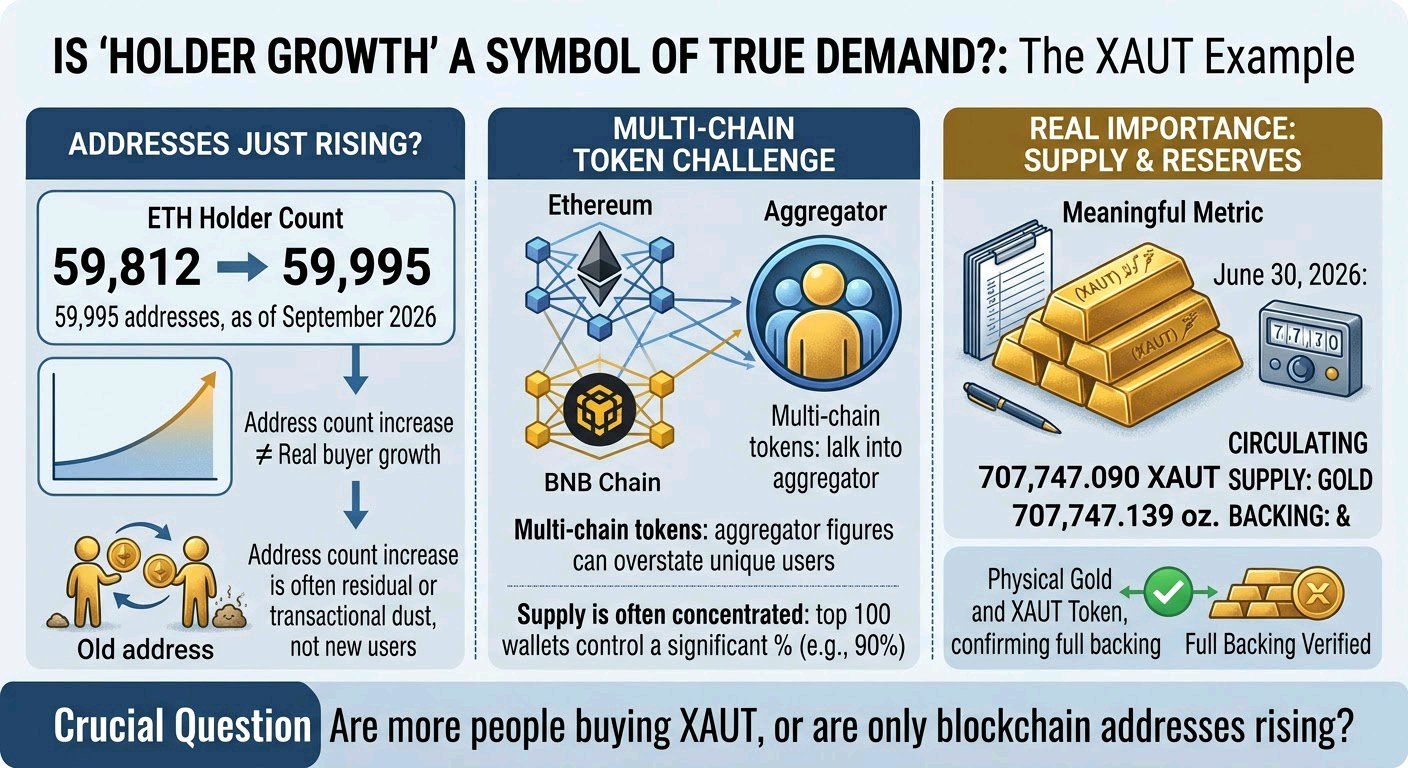
XAUT’s Ethereum holder count is now 59,995 addresses, up from roughly 59,812 reported in September 2026 — a gain of about 183 wallets, according to Ethereum holder trackers. That sounds like holder growth for a token whose entire pitch is steady, boring, fully-backed exposure to physical gold. Here’s the part that matters if you’ve ever looked at a “holder count rising” chart and treated it as proof of organic demand: that number is chain-specific. XAUT is issued across Ethereum and BNB Chain, while market aggregators can report a much larger combined holder figure. Current Ethereum data puts the token at 59,995 holders against roughly 707.74K XAUT on that chain, with the top 100 wallets controlling 86.7% of supply. And XAUT’s structure makes address counts even easier to misread. Small residual balances can remain after swaps or transfers, while exchanges and custodians can consolidate or redistribute wallets without changing the underlying gold exposure. A few hundred additional addresses therefore tell us much less than the actual supply being issued and held. I can’t confirm from holder data alone whether those new addresses represent new buyers, internal wallet movements, or operational activity. Tether’s more meaningful metric is physical gold backing and circulating supply: its latest reported reserve figure was 707,747.139 fine troy ounces against 707,747.090 XAUT in circulation as of June 30, 2026. So when someone shows you “holder growth” for a multi-chain gold token, the better question is simple: are more people actually buying XAUT, or are we just counting more blockchain addresses? #ByXIMPACT $XAUTUSDT
Bitcoin’s sub-1 BTC address count has climbed to 58,603,650 addresses as of October 4, 2026, up 2,932,637 addresses, or 5.27%, year over year, according to BGeometrics’ Bitcoin distribution data. That’s nearly 3 million more small-balance addresses on a network whose core pitch is decentralized ownership and a fixed 21 million-BTC supply. Here’s the part that matters if you’ve ever seen a rising Bitcoin “holder count” and assumed it means millions of new people are buying BTC: Bitcoin addresses are not the same thing as holders. One person can control dozens of addresses, while exchanges and custodians can control thousands or millions on behalf of their customers. The UTXO model also creates a long tail of tiny balances — ChainQuery currently counts more than 18 million addresses holding under 0.0001 BTC — so address growth can partly reflect wallet management, change outputs, dust, consolidation and ordinary transaction activity rather than new economic owners. The more useful signal is where the actual BTC is moving. For example, addresses holding 1–10 BTC currently number 821,611, while addresses holding 10,000+ BTC number only 86. That distribution tells you far more about supply concentration and ownership structure than simply counting every address with a balance. I can’t determine from address data alone whether the increase represents genuine new users, wallet fragmentation or custodial activity. So when someone says “Bitcoin holders are growing,” the better question is: are we measuring people, addresses, or actual BTC ownership? $BTCUSDT #ByXIMPACT $BTCUSDC

SOL’s holder count is one of the easiest on-chain numbers to overinterpret. Solscan’s own documentation makes the limitation clear: its holder endpoint counts token-holding accounts, while its holder analytics can track holder growth over time — but a holder can represent a very small balance. � pro-api.solscan.io +1 Here’s the part that matters if you’ve ever looked at SOL holder growth and treated it as direct evidence of new investor demand: Solana is not a simple EVM-style wallet model. SOL balances sit directly in native accounts, while the broader Solana ecosystem also creates huge numbers of program-controlled accounts and operational addresses. Small residual balances, exchange infrastructure, staking-related accounts, transfers and account management can all affect what an address-level metric appears to say. Solscan itself warns that a token can gain many holders through tiny balances, or lose small holders while retaining the majority of value. � Solscan Information Center So a change in the raw address count is not automatically equivalent to capital flowing into or out of SOL. The more useful question is whether the underlying supply, staking participation, exchange flows and economically meaningful balances are changing alongside it. I can’t confirm the cause of any individual holder-count move from the aggregate metric alone. For SOL, the more meaningful dashboard is the network’s actual supply and staking structure rather than a vanity address count. Solana’s explorer separately tracks circulating/non-circulating supply and total stake, while current network data shows the chain processing thousands of transactions per second. � $SOLUSDT
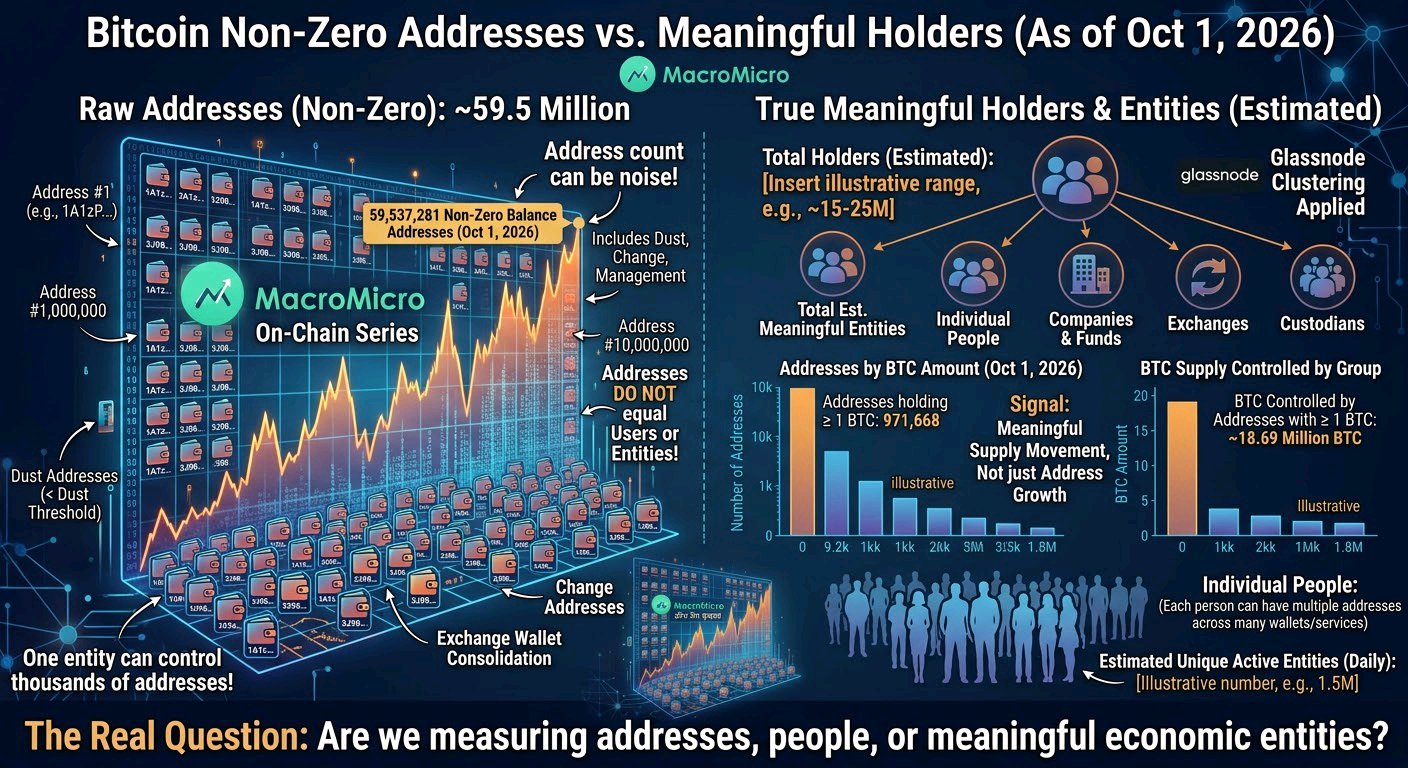
Bitcoin’s non-zero balance address count reached 59,537,281 on October 1, 2026, according to MacroMicro’s on-chain series. That’s nearly 60 million addresses holding some BTC, on an asset whose entire pitch has always been about scarce supply and monetary discipline. Here’s the part that matters if you’ve ever looked at a rising “holder count” chart and assumed it meant 59.5 million individual Bitcoin holders: it doesn’t. An address is not a person, and one entity can control thousands of addresses while exchanges and custodians can hold BTC for millions of users through a much smaller number of addresses. Glassnode has made the same distinction for years, using entity-based clustering because raw address counts do not map one-to-one with users. There’s another technical wrinkle. These counts include any address with a positive balance, including tiny residual amounts. Dust, change outputs, consolidation, exchange wallet management and ordinary transaction activity can all move the address count without representing a meaningful change in ownership. Glassnode’s holder-retention methodology even applies a dust threshold when defining holders, which tells you how noisy the raw address metric can be. I can’t confirm the economic cause of every address movement from the blockchain alone. What we can say is that the more useful signal is how much BTC is actually held across meaningful balance cohorts and how that supply is moving. For example, 971,668 addresses held at least 1 BTC on October 1, while that group controlled about 18.69 million BTC. So when someone says “Bitcoin holders are growing,” the better question is: are we measuring people, entities, or just another pile of blockchain addresses? $BTCUSDT
🚨 XRPL JUST HIT 10 MILLION x402 PAYMENTS Look, 10 million payments sounds like one of those numbers people throw around to make a network look busy. But here’s the interesting part. These are agent-to-agent payments settling directly on the XRP Ledger, meaning software agents can actually pay each other without someone sitting there clicking buttons like it’s 2012. Honestly, that’s the part worth watching. Machines paying machines. On-chain. 10 million times. I know what you’re thinking — “Cool, but does this actually matter?” Maybe. But if agent-based payments keep growing, the boring plumbing underneath them starts becoming pretty important, because nobody wants autonomous systems waiting around for humans to approve every tiny transaction. Not exactly exciting marketing material. Just infrastructure doing its job. $XRPUSDT
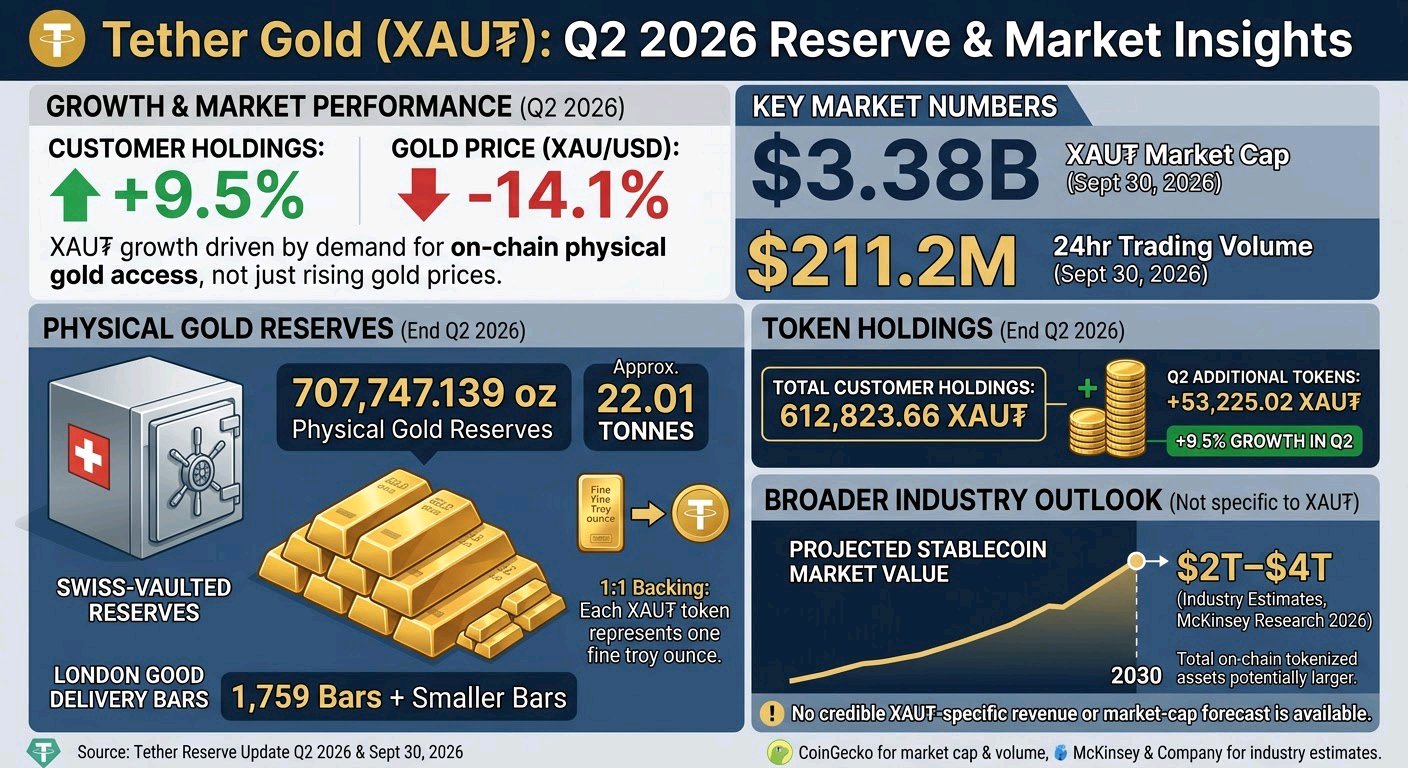
Tether Gold (XAU₮) has continued expanding as a tokenized physical-gold product. In Q2 2026, customer holdings increased 9.5% even while gold prices fell 14.1% during the quarter, according to Tether’s latest reserve update. � Tether The important point is that XAU₮ growth is being driven by demand for on-chain access to allocated physical gold, rather than simply rising gold prices. Main outlook There is no credible XAU₮-specific institutional revenue or market-cap forecast in the latest sources reviewed, so it would be misleading to manufacture one. The broader tokenization market is receiving institutional attention. McKinsey’s 2026 research notes industry estimates that stablecoin market value could reach $2T–$4T by 2030, with broader on-chain tokenized assets potentially larger. That is a sector-level estimate, not an XAU₮ forecast. � McKinsey & Company 7 Key Numbers • $3.38B — XAU₮ market capitalization on September 30, 2026. � • $211.2M — XAU₮ trading volume recorded on September 30, 2026. � • 707,747.139 oz — physical gold reserves backing XAU₮ at the end of Q2 2026. � • 22.01 tonnes — approximate physical gold held in reserve. � • 612,823.66 XAU₮ — tokens sold to customers by the end of Q2 2026. � • 53,225.02 XAU₮ — additional tokens moved into customer holdings during Q2. � • 9.5% — increase in customer XAU₮ holdings during Q2 2026. � CoinGecko CoinGecko Tether Tether Tether Tether Tether Why it matters The data points to a market developing around the infrastructure of tokenized physical gold: Swiss-vaulted reserves, 1:1 backing, blockchain transferability and increasingly liquid secondary-market access. Tether says the reserves consisted of 1,759 London Good Delivery bars plus smaller bars, while each full XAU₮ represents one fine troy ounce of physical gold. � Tether$XAUTUSDT
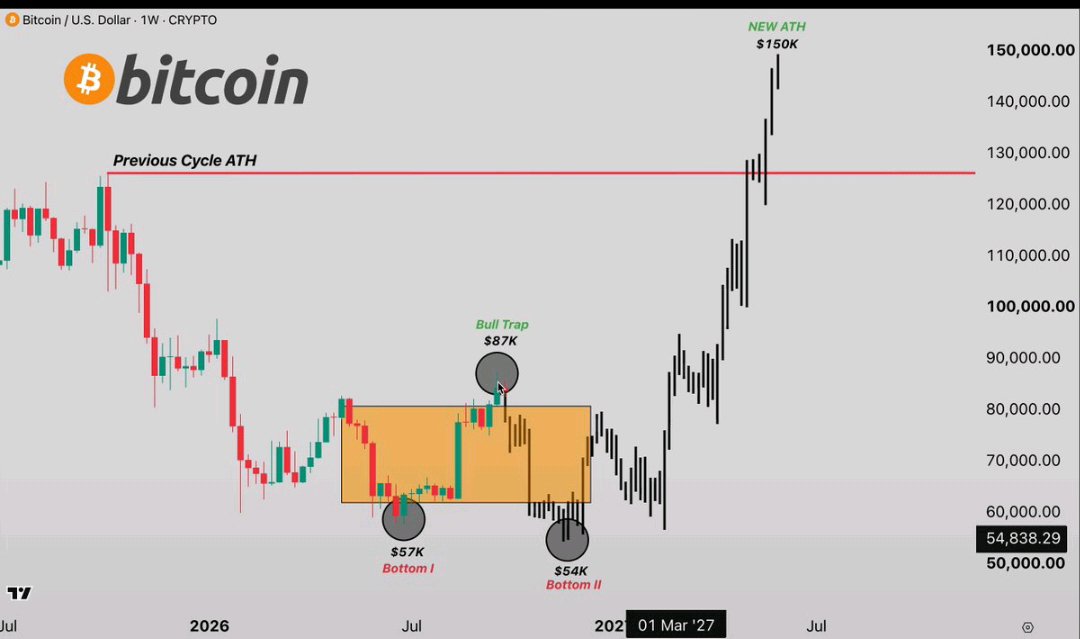
🚨 BITCOIN IS ABOUT TO MAKE EVERYONE PANIC AT THE WORST POSSIBLE TIME The $85K pump did exactly what it was supposed to do. It pulled everyone back in. Now I think the real liquidation begins. Here’s the path I’m watching: $87K → $73K → $62K → $54K → $150K+ At $73K, people will call it a normal correction. At $62K, they’ll start questioning the entire cycle. At $54K, I expect complete capitulation. And that’s the level where I’ll be looking to do what almost nobody will have the stomach to do: BUY. Because I don’t think $54K is where Bitcoin dies. I think it could be where the next massive run is born. Remember my previous calls: $17K bottom in 2022. $126K top in 2025. Now I’m putting the next roadmap out before the fear arrives. Save this chart. If Bitcoin reaches $54K, come back to this post. Follow + turn notifications on. The next call matters most when nobody wants to hear it. $BTCUSDT #ByXIMPACT