LOWSCREAMER™
Crypto enthusiast | Market analysis | Web3 Learning, researching, and sharing insights on the crypto market.
I’ve Analyzed Ripple, Here’s What I’m Watching
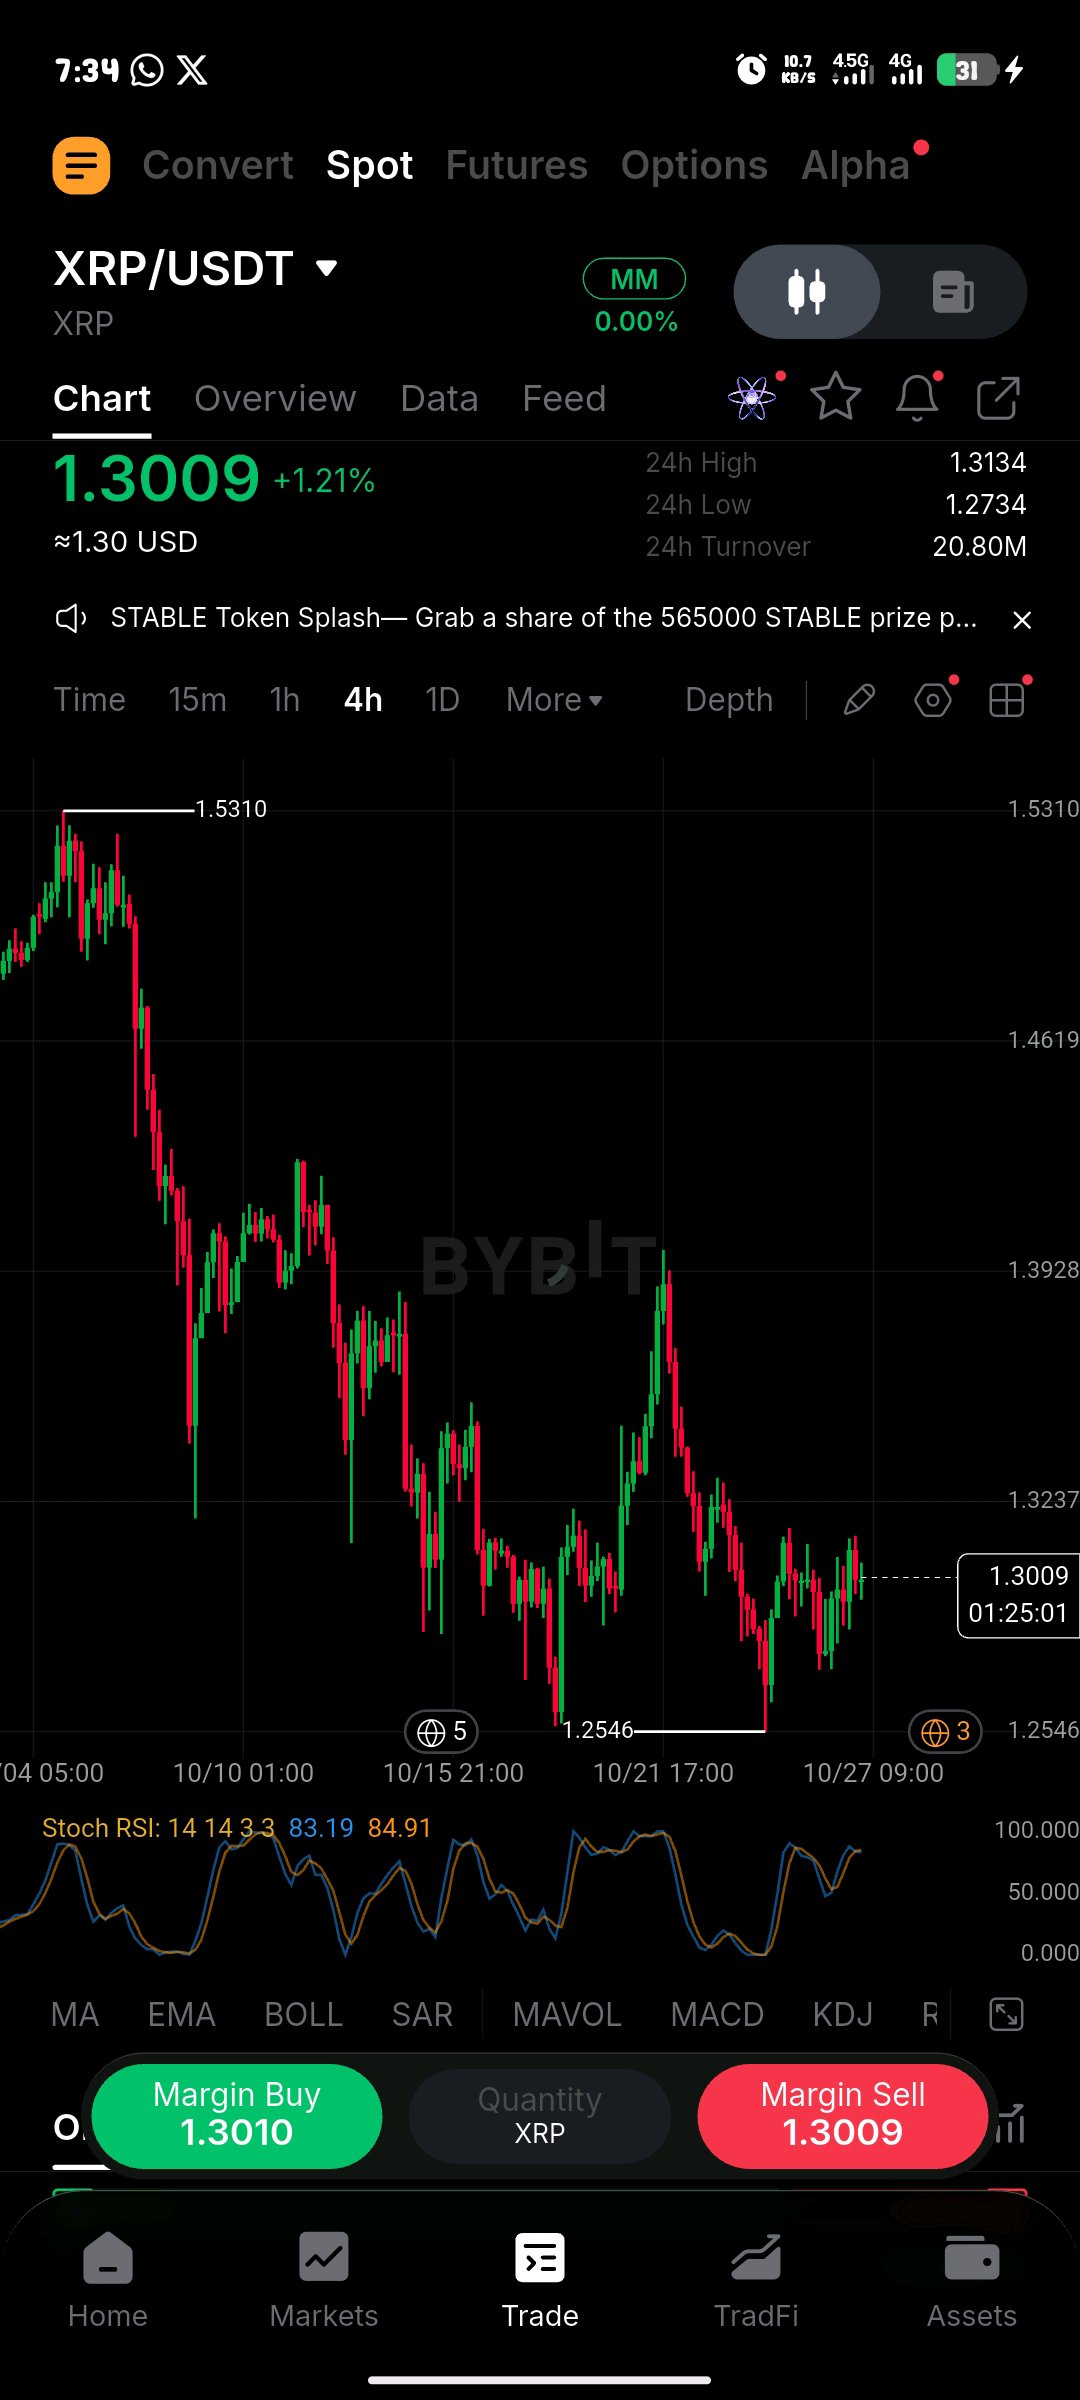
$XRPUSDT | Traders, I’ve been analyzing XRP, and honestly, the chart is showing some weakness right now. I’m watching the $1.30 area closely because the way price reacts around this zone could determine the next move. From my analysis, XRP is trading around $1.31, and the short-term structure remains bearish. Momentum is weak, and buyers still need to prove that they can regain control. However, I’m not ruling out a recovery if the market gives us a strong confirmation. Here are the key levels I’m watching. KEY SUPPORT LEVELS Support 1: $1.30 Support 2: $1.28 Major Support: $1.25–$1.26 Lower Support: $1.20 Extended Downside Target: $1.15 KEY RESISTANCE LEVELS Resistance 1: $1.32 Resistance 2: $1.34–$1.35 Major Resistance: $1.37–$1.40 Higher Resistance: $1.46 BEARISH SCENARIO If XRP loses the $1.28 support and confirms a breakdown, I’ll be watching the $1.26 zone next. A clean break below $1.25 could open the door toward $1.20, with $1.15 as a further downside level to monitor. BULLISH SCENARIO On the other hand, if buyers defend the support zone and push XRP above $1.32, I’ll start watching for a possible recovery toward $1.34 and $1.35. If the price breaks above that zone and holds, the next area I’ll be watching is $1.37–$1.40. MY PERSONAL OUTLOOK Traders, I’m staying cautious because the short-term momentum is still weak. I want to see how XRP reacts around $1.28–$1.30 before drawing a stronger conclusion. I’m not going to assume that every bounce is a reversal or that every drop will continue. For me, confirmation is what matters. The main question is whether buyers can defend support or sellers will push XRP lower. What do you think, traders? Are you expecting another move down on XRP, or do you believe buyers are preparing for a recovery? Drop your analysis in the comments. Let’s discuss it together. #IMPACTbyTrade
$XAUTUSDT | I’ve Analyzed Gold, Here’s My Next Move Traders, I’ve been analyzing XAUT, and I’m watching some important levels that could determine the next move. Gold-backed assets have been attracting attention, but I don’t want to jump to conclusions before price confirms its direction. From my analysis, XAUT is trading around $4,020, and the market is approaching a key decision zone. I’m watching whether buyers can push the price higher or whether sellers will take control and send it toward lower support levels. KEY LEVELS I’M WATCHING Resistance 1: $4,041 Resistance 2: $4,069 Resistance 3: $4,108 Support 1: $3,980 Support 2: $3,923 Support 3: $3,890 BULLISH SCENARIO If buyers manage to defend the $3,980 support zone and push XAUT above $4,041, I’ll be watching for a possible move toward the next resistance levels. TP1: $4,041 TP2: $4,069 TP3: $4,108 A strong breakout above $4,108 could open the door to further recovery, but I want to see confirmation before considering this scenario. BEARISH SCENARIO On the other hand, if XAUT loses the $3,980 support zone and confirms a breakdown, I’ll be watching the next support levels. TP1: $3,950 TP2: $3,923 TP3: $3,890 If sellers maintain control, the downside could extend further. However, I’ll be watching price action closely instead of assuming that support will break. MY PERSONAL OUTLOOK Traders, I’m keeping both scenarios in mind. The $3,980 level is particularly important to watch, while $4,041 is the first resistance buyers need to overcome. I’m not interested in guessing the market direction. I want to see a clear reaction at these levels before drawing a conclusion. Remember, protecting your capital and managing risk matter more than chasing every move. Now tell me your opinion: Are you bullish on XAUT, or do you think gold could drop further? Drop your thoughts in the comments. Let’s discuss what the market might do next. #IMPACTbyTrade

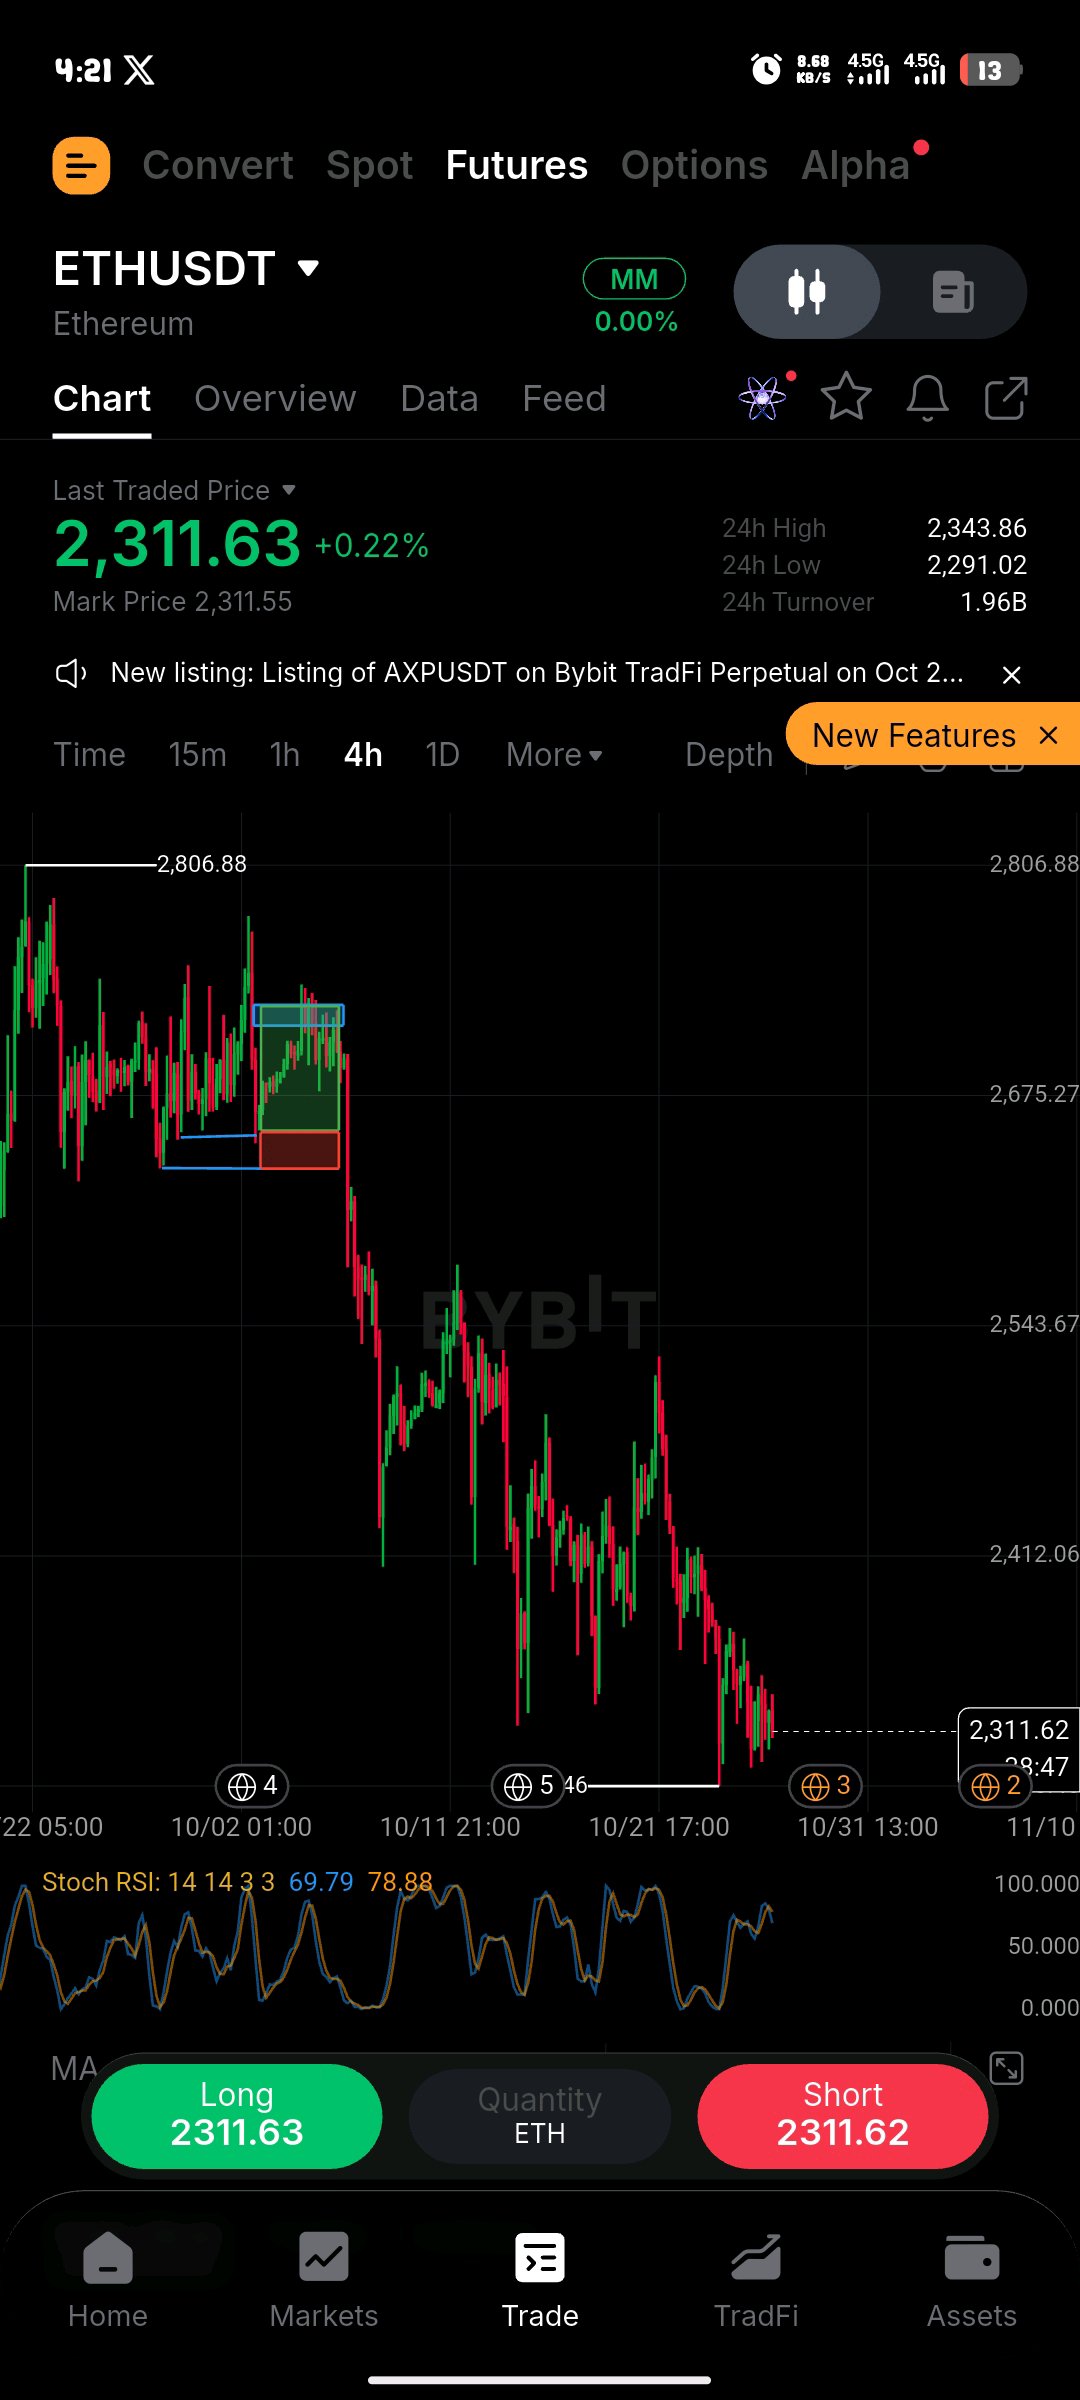
Traders, I’ve been analyzing Ethereum, and I’m watching a very important zone right now. From what I see on the chart, ETH is still facing bearish pressure, and I believe we need to pay close attention to how price reacts around the current support before making our next move. Let me show you the key levels I’m watching and the possible scenarios I’m preparing for. KEY LEVELS Current Reference Price: $2,308 Immediate Support: $2,307 Support 2: $2,262 Major Support: $2,206 Resistance 1: $2,371 Resistance 2: $2,438 Major Resistance: $2,496 BEARISH SETUP — SHORT OPPORTUNITY Personally, I’ll be watching for a possible short if ETH breaks below $2,307 and confirms the breakdown with strong selling pressure. Potential Entry Zone: $2,300–$2,307 after confirmation TP1: $2,262 TP2: $2,235 TP3: $2,206 Invalidation: A strong reclaim of the breakdown level would make me reassess the setup. I don’t want to enter blindly. I want to see sellers confirm their strength before considering this scenario. BULLISH SETUP — LONG OPPORTUNITY On the other hand, if buyers defend the $2,307 support and ETH reclaims $2,371 with strong momentum, I’ll start watching for a possible recovery. Potential Entry: After a confirmed reclaim of $2,371 TP1: $2,400 TP2: $2,438 TP3: $2,496 Invalidation: A failed reclaim followed by a breakdown of support would weaken the bullish scenario. WHAT I’M WATCHING The main thing I’m watching is whether ETH can hold its support or whether sellers will push the price lower. The moving averages and momentum indicators have been showing weakness, so I’m staying cautious until buyers provide a stronger confirmation. MY PERSONAL OUTLOOK Traders, I’m not rushing into anything yet. I want to see the market confirm its direction before taking a position. If support breaks, I’ll watch the downside targets. If buyers reclaim resistance, I’ll consider the recovery scenario instead. Remember, these are potential setups, not guaranteed outcomes. Always manage your risk and avoid entering a trade without confirmation. Now tell me your opinion: Are you looking for an ETH short or do you believe a recovery is coming? Drop your analysis in the comments. Let’s discuss it together. $ETHUSDT #IMPACTbyTrade
🚨 THE MEMECOIN WAR: IS THE THRONE UNDER THREAT?
The rankings of the top 10 memecoins : Dogecoin ( $DOGEUSDT ) continues to reign at the top with a stratospheric market cap of $12.7 billion. Pepe ( $PEPEUSDT ) securely holds its ground in 4th place at $1.8 billion. Pudgy Penguins ( $PENGU ) makes a notable surge into 7th position at $471.1 million. 📊 Between the historical supremacy of Dogecoin, the craze surrounding Pepe, and the rise of the Penguins, which of these three tokens do you think will outperform the others in the next bull run? Drop your analysis in the comments! 👇 #IMPACTbyTrade #ByXIMPACT #MyByXTake

🔴 $MINA: Can Buyers Stop the Downtrend?
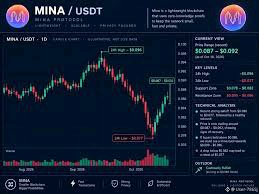
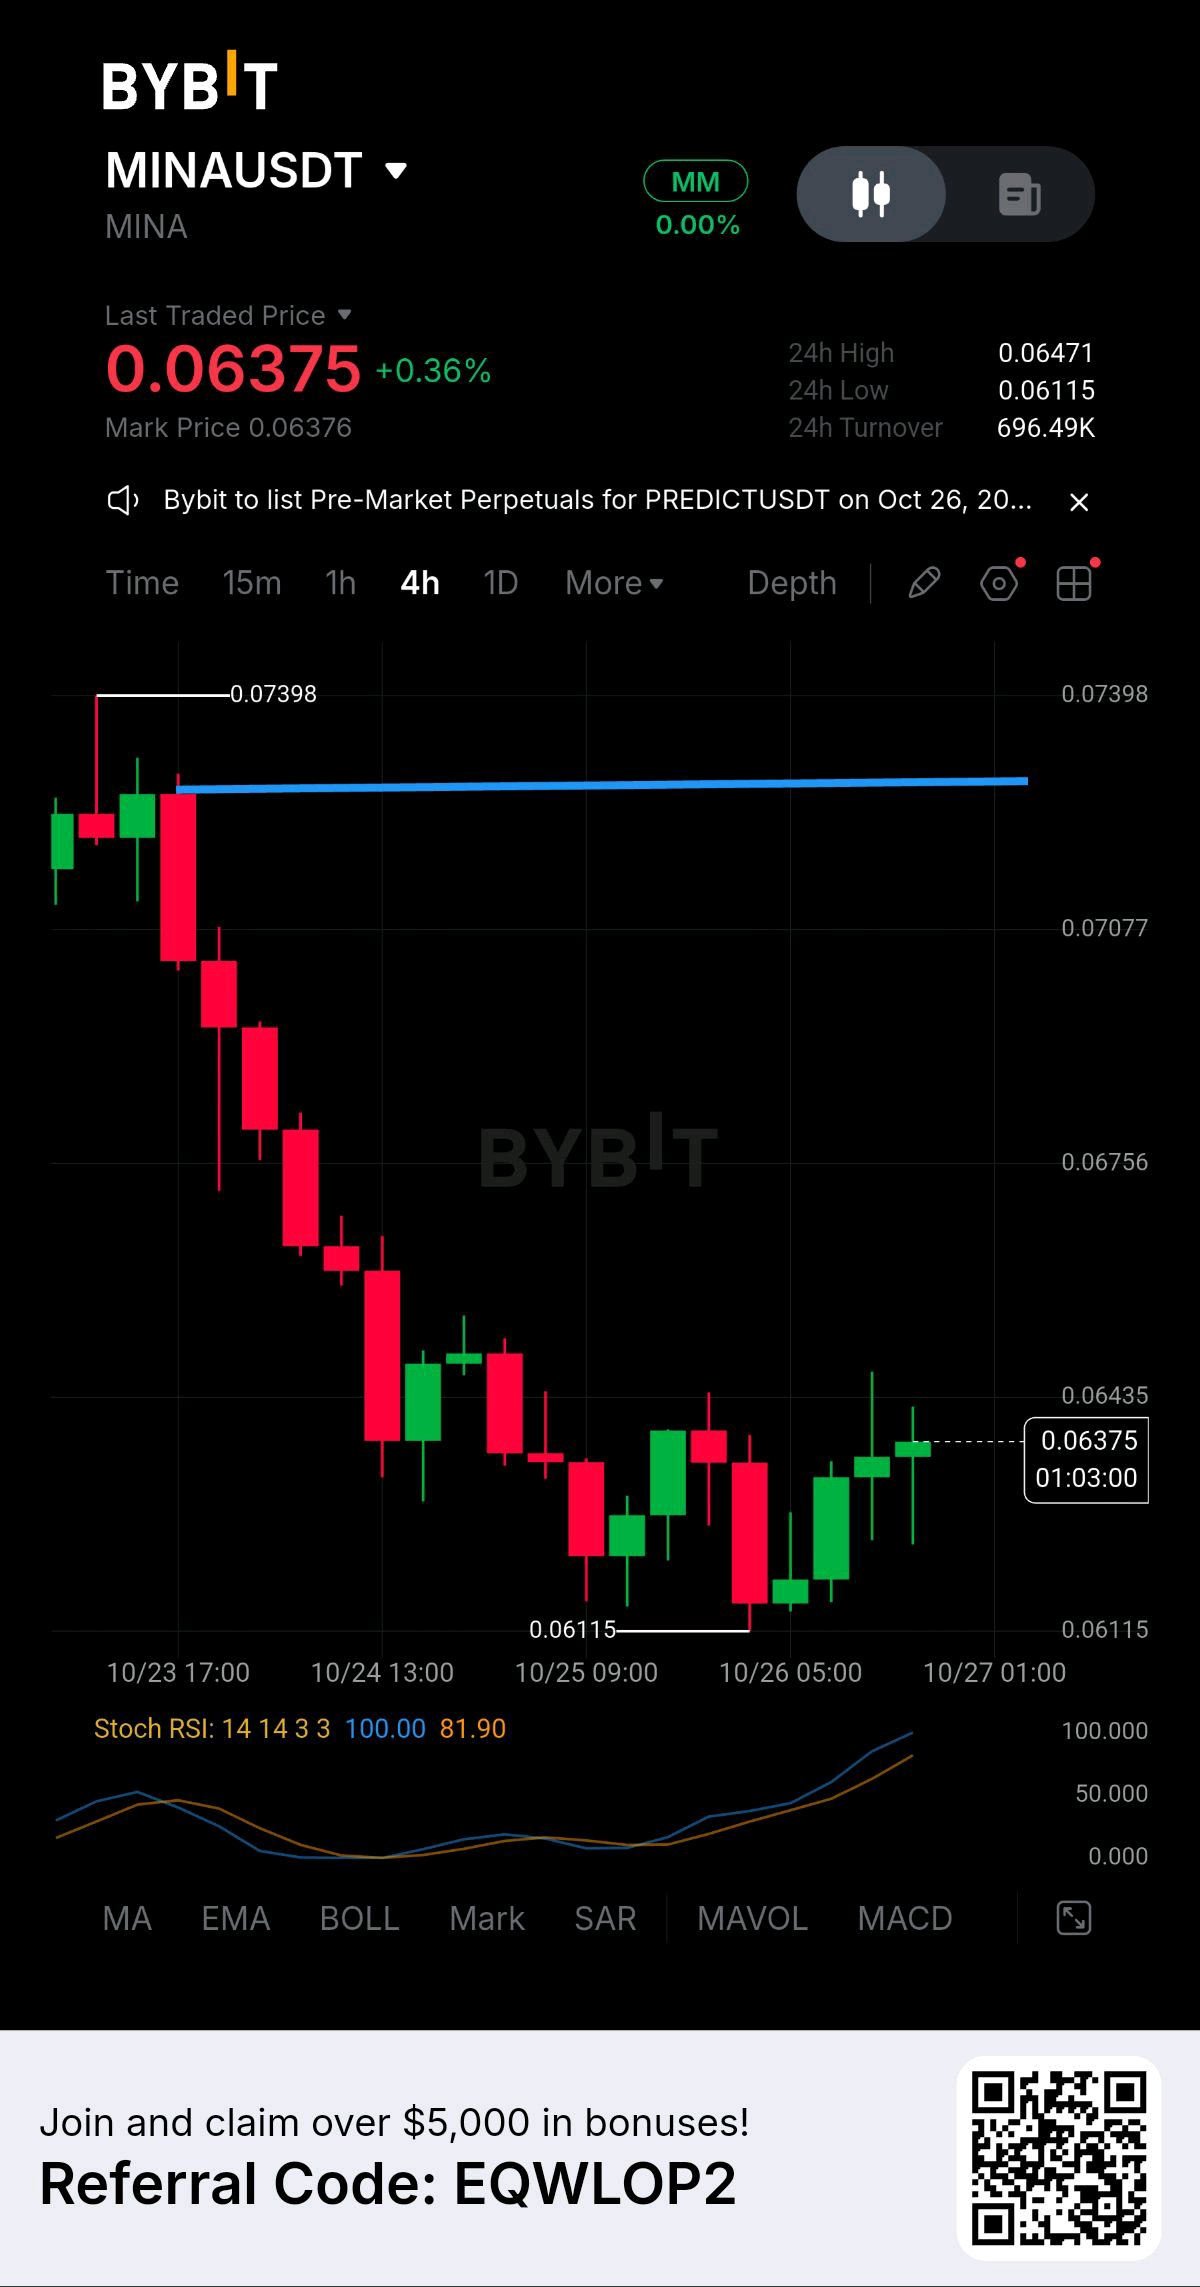
Mina Protocol ($MINA) is showing a small recovery, but the bigger picture remains bearish. As of October 26, MINA is trading around $0.064, up approximately 1.6% over 24 hours. However, the token has dropped around 11.4% over the past seven days and 54.6% over the past 30 days. Buyers still have a lot to prove before I would consider this a confirmed trend reversal. Market Overview MINA is designed around a lightweight blockchain architecture using zero-knowledge cryptography, aiming to make blockchain verification more accessible. But strong technology alone does not guarantee price appreciation. Market sentiment, liquidity, demand, and broader crypto-market conditions still matter. Technical Analysis MINA's daily technical outlook currently shows a strong bearish bias. Its RSI is around 31, indicating weak momentum and proximity to oversold territory. That could allow a relief bounce, but it does not confirm that the downtrend has ended. Key levels I'm watching: - Resistance 1: $0.0653 - Resistance 2: $0.0724 - Resistance 3: $0.0785 - Support 1: $0.0597 - Support 2: $0.0536 - Major lower support: $0.0391 Bullish Scenario If MINA breaks above $0.0653 and holds that level, buyers could attempt a move toward $0.0724. A stronger recovery above that zone could bring $0.0785 into focus. I would want to see stronger buying volume and sustained price action before treating this as a meaningful bullish reversal. Bearish Scenario If MINA fails to reclaim $0.0653, selling pressure could return. A break below $0.0597 would weaken the structure further and potentially expose $0.0536 as the next support. My Final Verdict My current view onis cautious to bearish. The recent bounce is worth watching, but the overall trend remains weak. I would rather wait for confirmation than assume the bottom is already in. The key question is whether buyers can reclaim resistance or sellers will push the price toward lower support. What do you think? Is preparing for a recovery, or is another leg down coming? Share your analysis in the comments. $MINAUSDT #IMPACTbyTrade
🚀 $TSLA: Tesla Bulls Are Back!
Tesla is back in the spotlight! Shares jumped approximately 6% on October 26, trading around $394–$395 after Barclays upgraded its rating from Hold to Buy and raised its price target from $370 to $450. What’s Driving Tesla Today? The latest rally is being fueled by renewed optimism about Tesla’s core automotive business, its Full Self-Driving technology, and speculation surrounding a possible merger with SpaceX. Elon Musk has confirmed that the companies’ boards are considering a potential combination, but no completed merger has been announced. Tesla is also seeing growing interest in its FSD software. The company reported 1.74 million FSD users at the end of Q3 2026, compared with 1.04 million a year earlier. That growth could become an important part of its long-term business model. However, there is still a risk investors should not ignore: Tesla’s third-quarter net income fell 44% year over year, even though adjusted earnings beat analysts’ expectations. The market must decide whether future growth in AI, autonomous driving, and energy can justify the company’s valuation. 📊 Key Price Levels to Watch Current price: Around $394–$395 🔹 Resistance: $397–$400 🔹 Next upside area: $410–$415 🔹 Major bullish target: $440–$450 🔹 Near-term support: $383–$385 🔹 Lower support to monitor: $370–$375 These are watch levels based on recent price action, not guaranteed turning points. My Market View Tesla’s momentum has improved, but I want to see whether buyers can push the stock above the $397–$400 resistance zone and sustain the move. A convincing breakout could open the door toward $410–$415, with $440–$450 becoming a broader upside area if positive momentum continues. On the other hand, rejection near $400 could trigger profit-taking. A move below $383 would weaken the immediate bullish setup and could bring $370–$375 back into focus. My view: Cautiously bullish while price holds above $383–$385, but I would avoid chasing the rally without confirmation. The potential SpaceX combination is an interesting catalyst, yet the underlying business performance and valuation remain crucial. 💬 Your Turn: Do you think $TSLA can break above $400 and move toward $450, or will sellers push the price back down? Share your analysis in the comments! #IMPACTbyTrade $TSLAXUSDT

$WLD: $10M WHALE TRANSFER PUTS BULLS
Worldcoin ($WLDUSDT ) is facing renewed selling pressure after a sharp reversal erased much of its recent recovery. On October 26, WLD traded around $0.44, extending its decline after reaching approximately $0.59 earlier in the week. The latest price action raises an important question: is this simply a healthy correction, or is the market preparing for another leg lower? THE BIGGEST NEWS: A $10M WHALE TRANSFER One of the most important developments is the movement of approximately 19.74 million WLD tokens, worth roughly $10 million, from a previously inactive institutional holder. Reports indicate that approximately 19 million tokens were deposited onto exchanges. Large exchange deposits can increase potential selling pressure, although they do not automatically mean that the holder has sold. The market will be watching closely to see whether buyers can absorb this additional potential supply. WORLD ID EXPANSION: A LONG-TERM CATALYST? World recently introduced an identity package designed for banks and financial service providers. The initiative aims to help distinguish real people from AI-generated identities and impersonation attempts. This development could expand the project's potential use cases, but adoption by financial institutions and its eventual effect on WLD demand remain important questions. World ID utility and the WLD token are not interchangeable, so product growth does not automatically translate into token-price appreciation. TECHNICAL ANALYSIS: KEY LEVELS TO WATCH WLD is trading near $0.44, with immediate support around $0.435–$0.43. A sustained breakdown below this area could expose the $0.40 level, followed by $0.37 if broader selling intensifies. On the upside, $0.463 is the first resistance to monitor. A convincing recovery above this level could open the way toward $0.489 and potentially $0.52. These are conditional technical scenarios, not guaranteed targets. MY MARKET OUTLOOK My current assessment is cautious because WLD is experiencing short-term selling pressure while a significant holder's exchange deposits raise supply concerns. Holding $0.43 could help the token stabilize, but buyers need to reclaim $0.463 before the recovery becomes more convincing. A breakdown below support would increase the risk of further weakness. The bigger picture remains a battle between World ID's potential adoption and the market's concerns about token supply. Fundamental progress may support long-term interest, but short-term price action still depends on demand, liquidity, and broader crypto sentiment. THE QUESTION IS SIMPLE: CAN WLD RECLAIM $0.46, OR WILL SELLERS PUSH IT TOWARD $0.40? #IMPACTbyTrade #WSOT2026 #MyByXTake
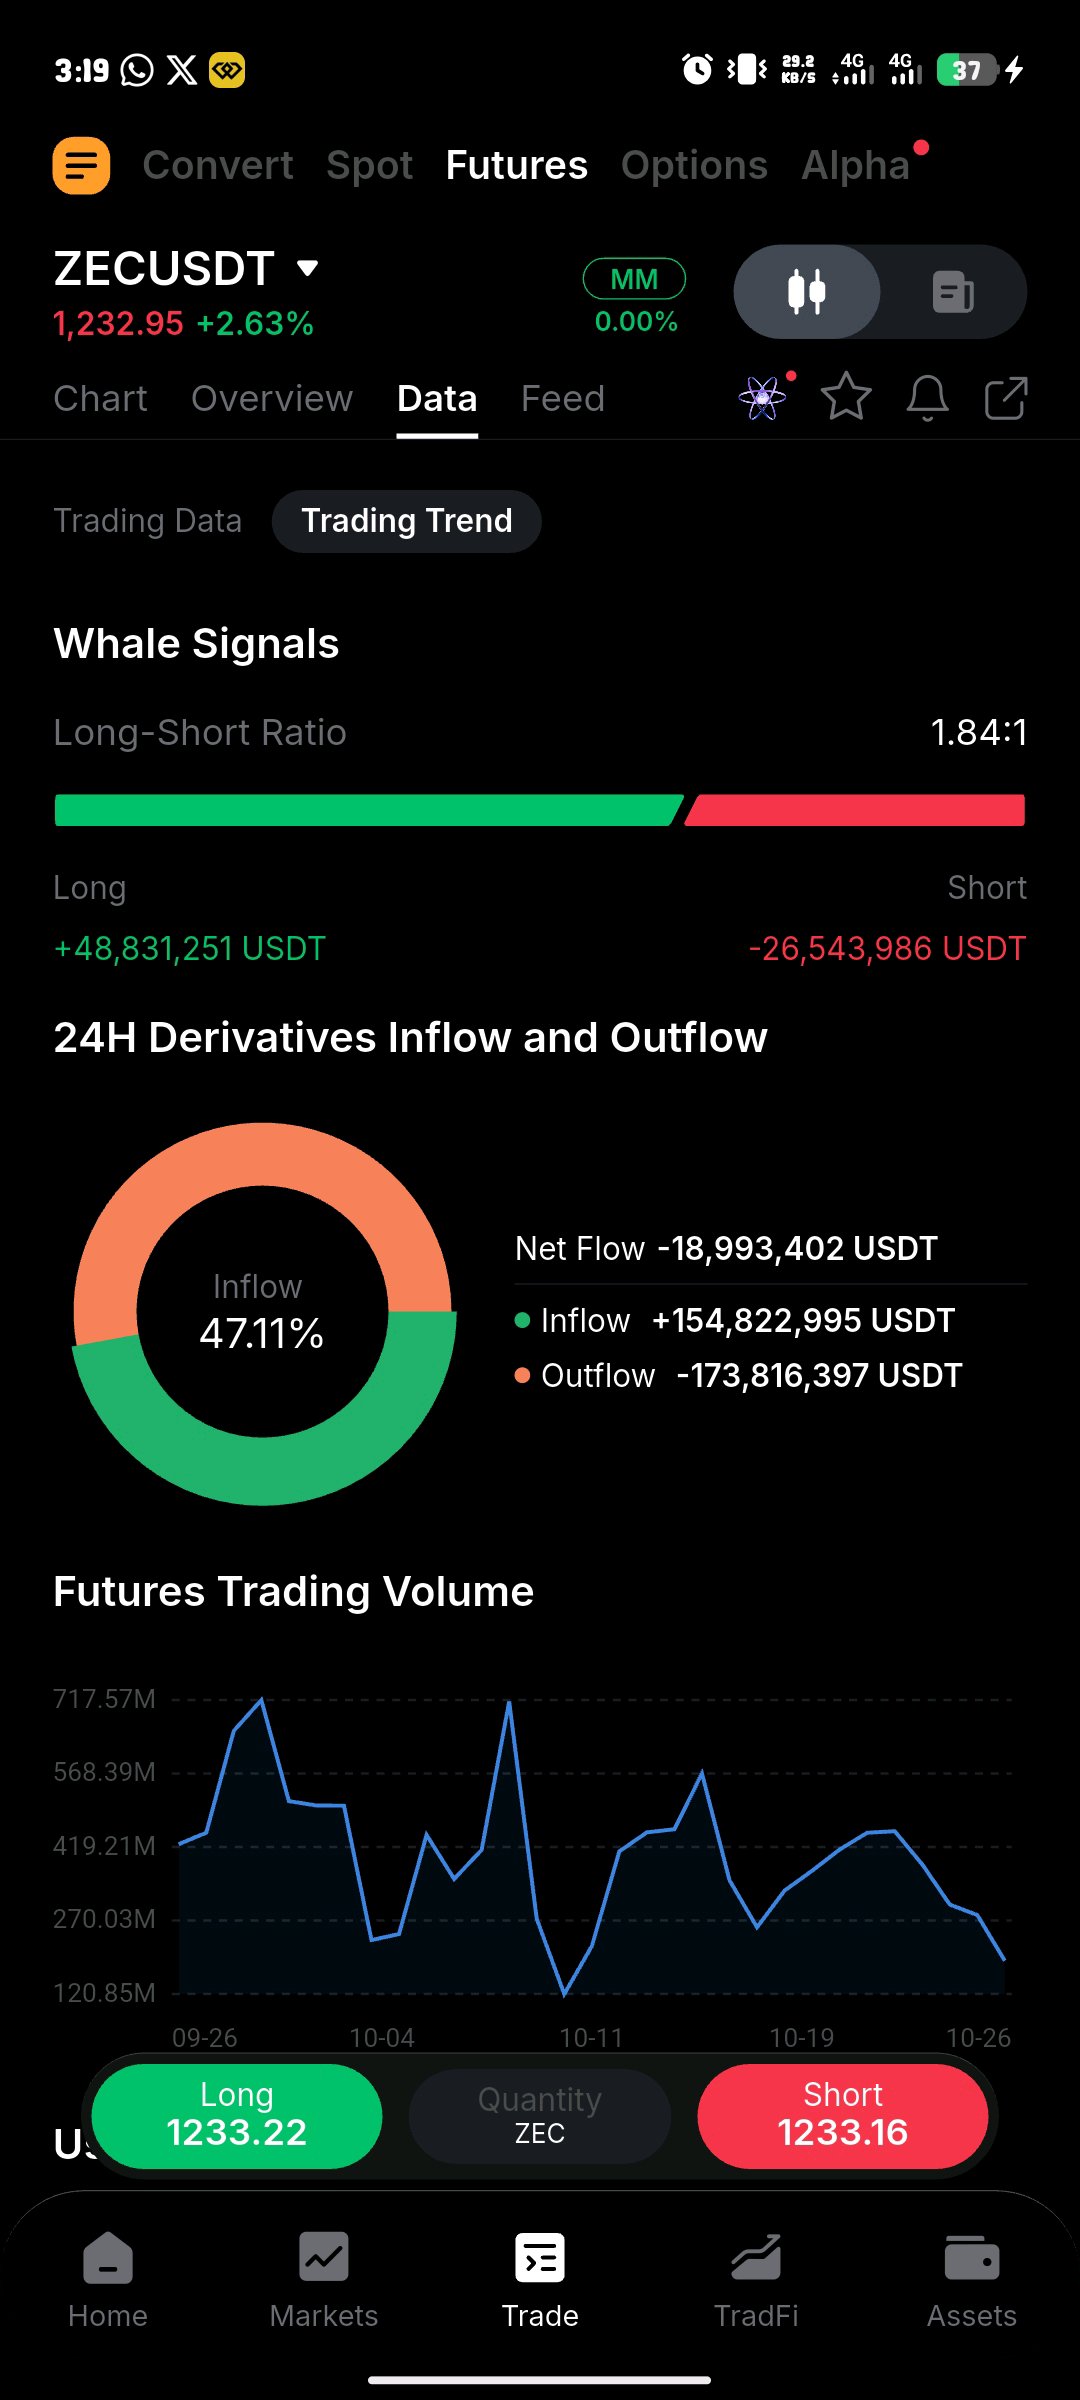
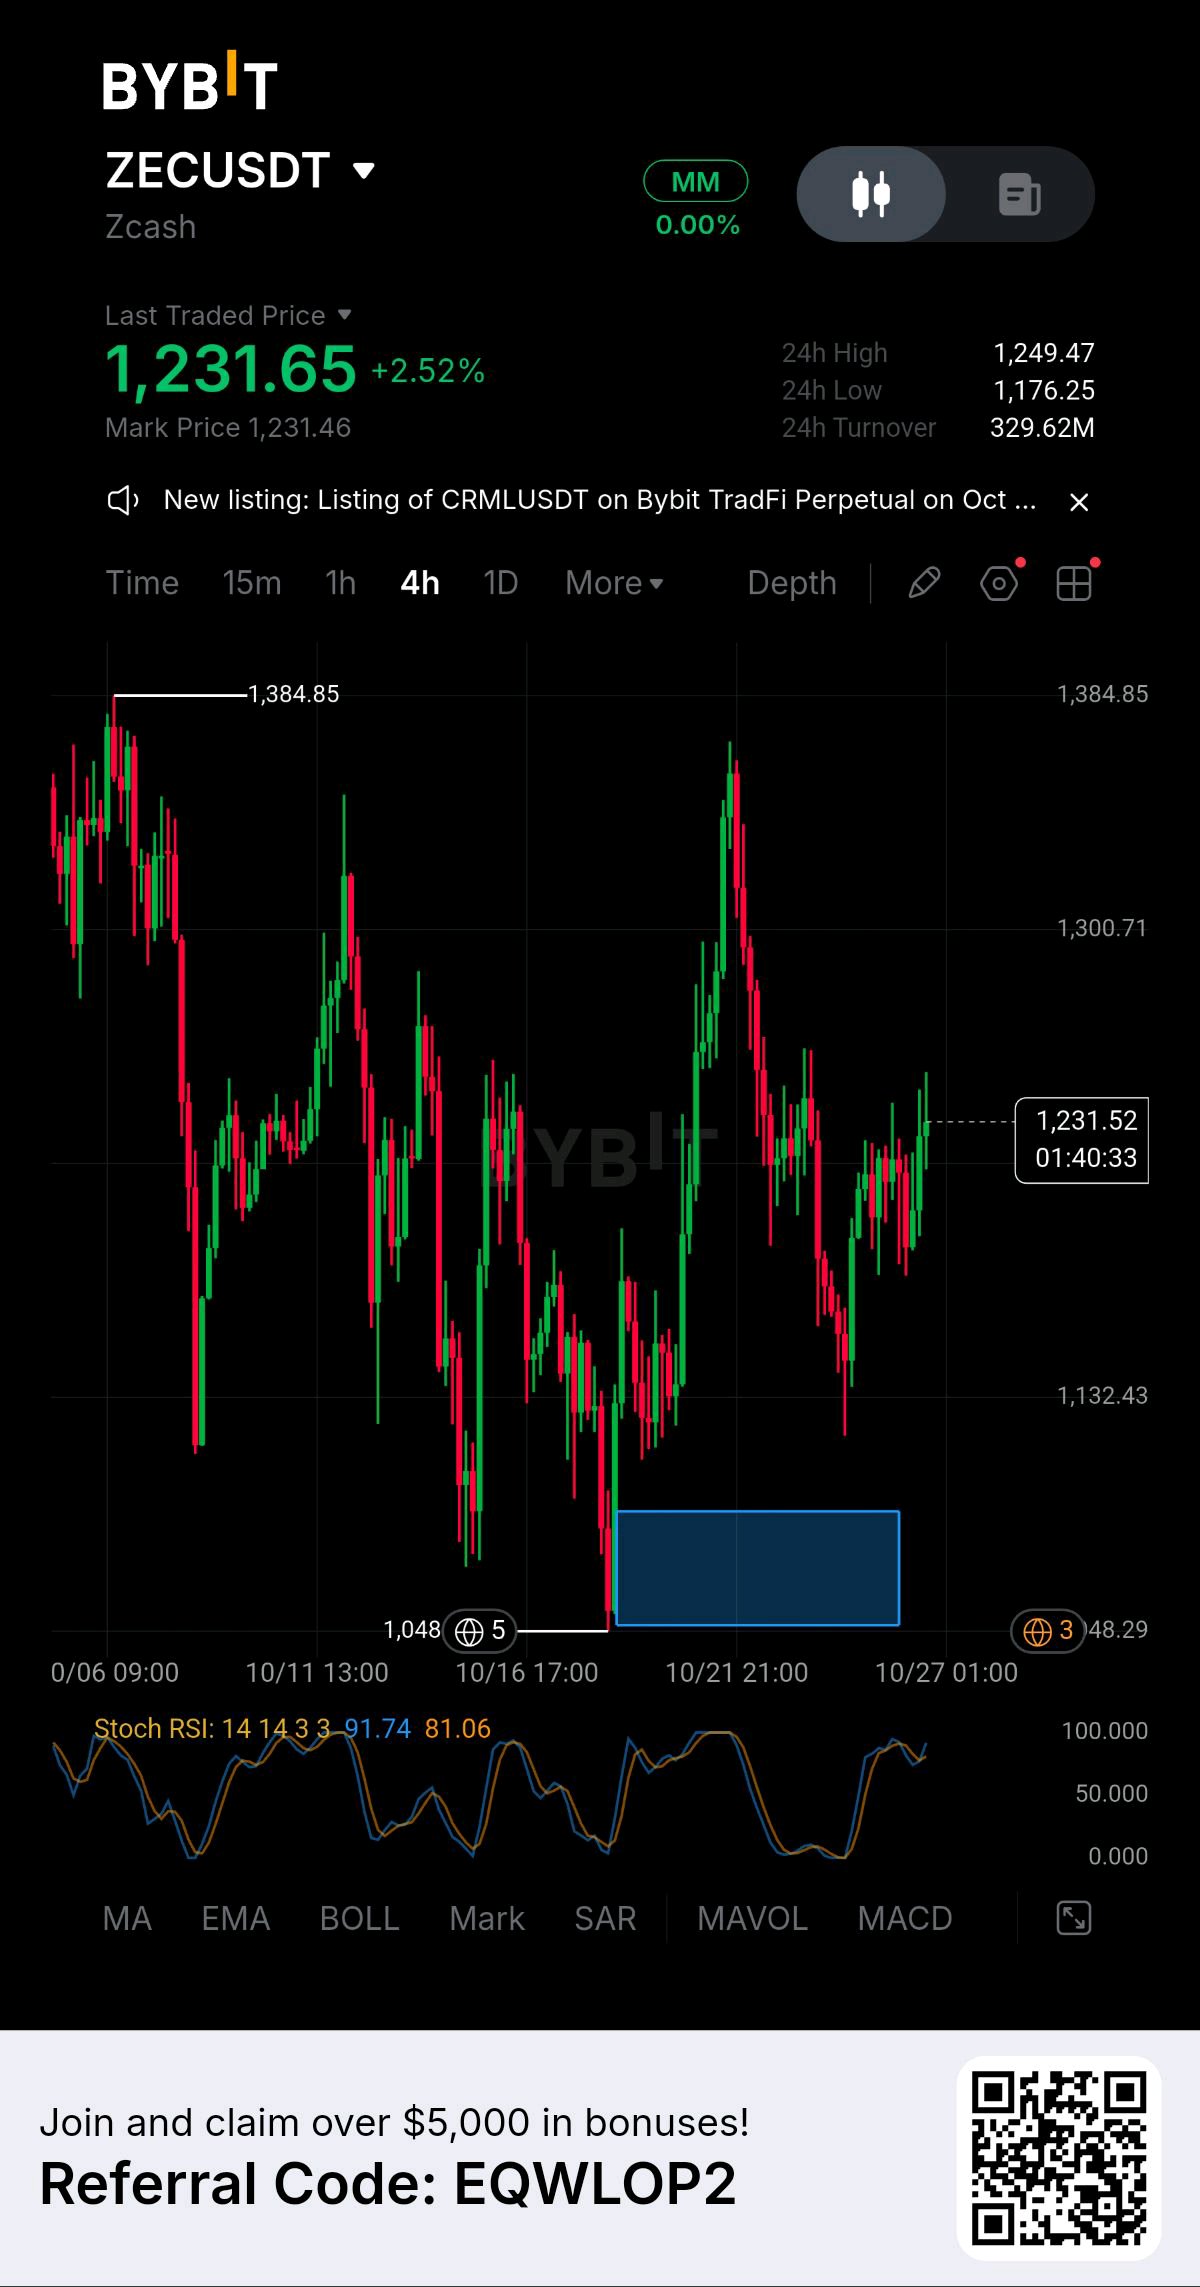
Zcash ($ZEC) is approaching a critical turning point as institutional demand returns while selling pressure continues to challenge its recovery. On October 26, ZEC was trading around $1,200, with renewed interest following approximately $41.09 million in weekly inflows into Grayscale's Zcash-focused investment product. However, the price remains significantly below its September peak, raising an important question: can institutional demand fuel another recovery, or will sellers continue pushing the market lower? THE BIGGEST NEWS: INSTITUTIONAL DEMAND RETURNS Grayscale's Zcash investment product recorded four consecutive days of inflows during the previous week, ending a three-week period of withdrawals. This development suggests that some institutional investors are regaining interest in Zcash. Nevertheless, positive fund flows do not guarantee an immediate price increase. The market still needs sustained demand and a convincing technical breakout before a stronger recovery can be confirmed. NETWORK UPGRADE COULD BECOME A CATALYST Zcash's upcoming Network Upgrade 7, targeted for November 5, is another development worth watching. The upgrade is expected to reduce block times from 75 seconds to 25 seconds and disable the Sprout pool and its transactions. Successful implementation could represent an important technical milestone for the network, although the upgrade's impact on price will depend on market expectations, execution, and broader sentiment. TECHNICAL ANALYSIS: KEY LEVELS TO WATCH ZEC is facing immediate resistance around $1,220–$1,231. A sustained move above this region could improve short-term momentum and open the way toward $1,268 and $1,300. Beyond that, the $1,350–$1,385 region represents a more significant resistance zone. On the downside, $1,175–$1,180 is an important support area. If this zone fails, $1,100 becomes the next level to monitor, with $1,000 representing a further psychological support level. These are potential scenarios, not guaranteed outcomes. MY MARKET OUTLOOK My assessment is cautiously neutral. ZEC has encouraging fundamental developments, including renewed investment-product inflows and the approaching network upgrade, but its short-term price structure remains vulnerable. A sustained break above $1,231 would strengthen the recovery scenario, while a breakdown below $1,175 would increase downside risk. The key insight is that positive news and bullish price action are not always the same thing. Investors may be interested in Zcash, but buyers still need to demonstrate enough demand to overcome resistance. Can ZEC reclaim $1,300 before its November network upgrade, or will selling pressure push it toward $1,100? Share your analysis in the comments. #WSOT2026 #IMPACTbyTrade $BTCUSDT $PEPEUSDT #MyByXTake
Doodles ($DOODUSDT ) is attracting significant market attention on October 26, with its price rising sharply as trading activity increases. The token recently traded around $0.00197, gaining approximately 34% in 24 hours, while intraday trading pushed it close to $0.00202. This sudden recovery comes after substantial volatility earlier in October, raising an important question: are buyers preparing for another upward move, or is this simply a temporary rebound before sellers return? WHAT IS DRIVING THE MOVE? Recent trading activity suggests that market speculation and renewed demand are contributing to DOOD's recovery. On October 21, DOOD experienced an explosive rally alongside other small-cap tokens, with unusually high trading volume reported on Upbit. No major project-specific catalyst was identified in that report, meaning traders should be careful about assuming the rally is supported by a fundamental development. The current price increase is attracting attention, but sustained demand will be necessary to keep the momentum alive. TECHNICAL ANALYSIS DOOD has demonstrated strong short-term recovery momentum, but its broader trend remains uncertain. The token is still trading substantially below its October 2025 all-time high of approximately $0.0181. This highlights the difference between a powerful short-term rally and a confirmed long-term trend reversal. Traders should monitor whether the price can consolidate above recently reclaimed levels rather than immediately giving back its gains. KEY LEVELS TO WATCH The $0.00190–$0.00200 region is an important immediate resistance area. A sustained breakout above $0.00200, supported by genuine trading demand, could open the way toward $0.00220 and $0.00250. If momentum accelerates further, $0.00300 could become a potential extension target. On the downside, $0.00175 is an area to monitor, followed by support near $0.00150. A breakdown below these zones could indicate that the recent rally is losing strength. These are conditional technical levels, not guaranteed targets. THE BIGGEST RISK DOOD is a volatile, small-cap token, and sharp rallies can reverse quickly. CoinPaprika's October 26 data also flags concerns about liquidity and the reliability of reported trading volume. Consequently, a large volume figure should not automatically be interpreted as proof of strong, sustainable buying demand. MY FINAL VERDICT My outlook on DOOD is cautiously bullish in the short term while the price maintains its recovery structure. A sustained move above $0.00200 would strengthen the bullish case, while a rejection followed by a breakdown below $0.00175 would increase the risk of a deeper pullback. The next move depends on whether buyers can sustain demand after the initial surge. DOOD has captured market attention, but the real test is whether it can maintain its gains. Can DOOD break above $0.00200 and continue higher, or will sellers take control again? Share your analysis in the comments. #IMPACTbyTrade #WSOT2026 #MyByXTake #ByXIMPACT #BybitStocks

$GRIFFAIN is Bleeding 💔
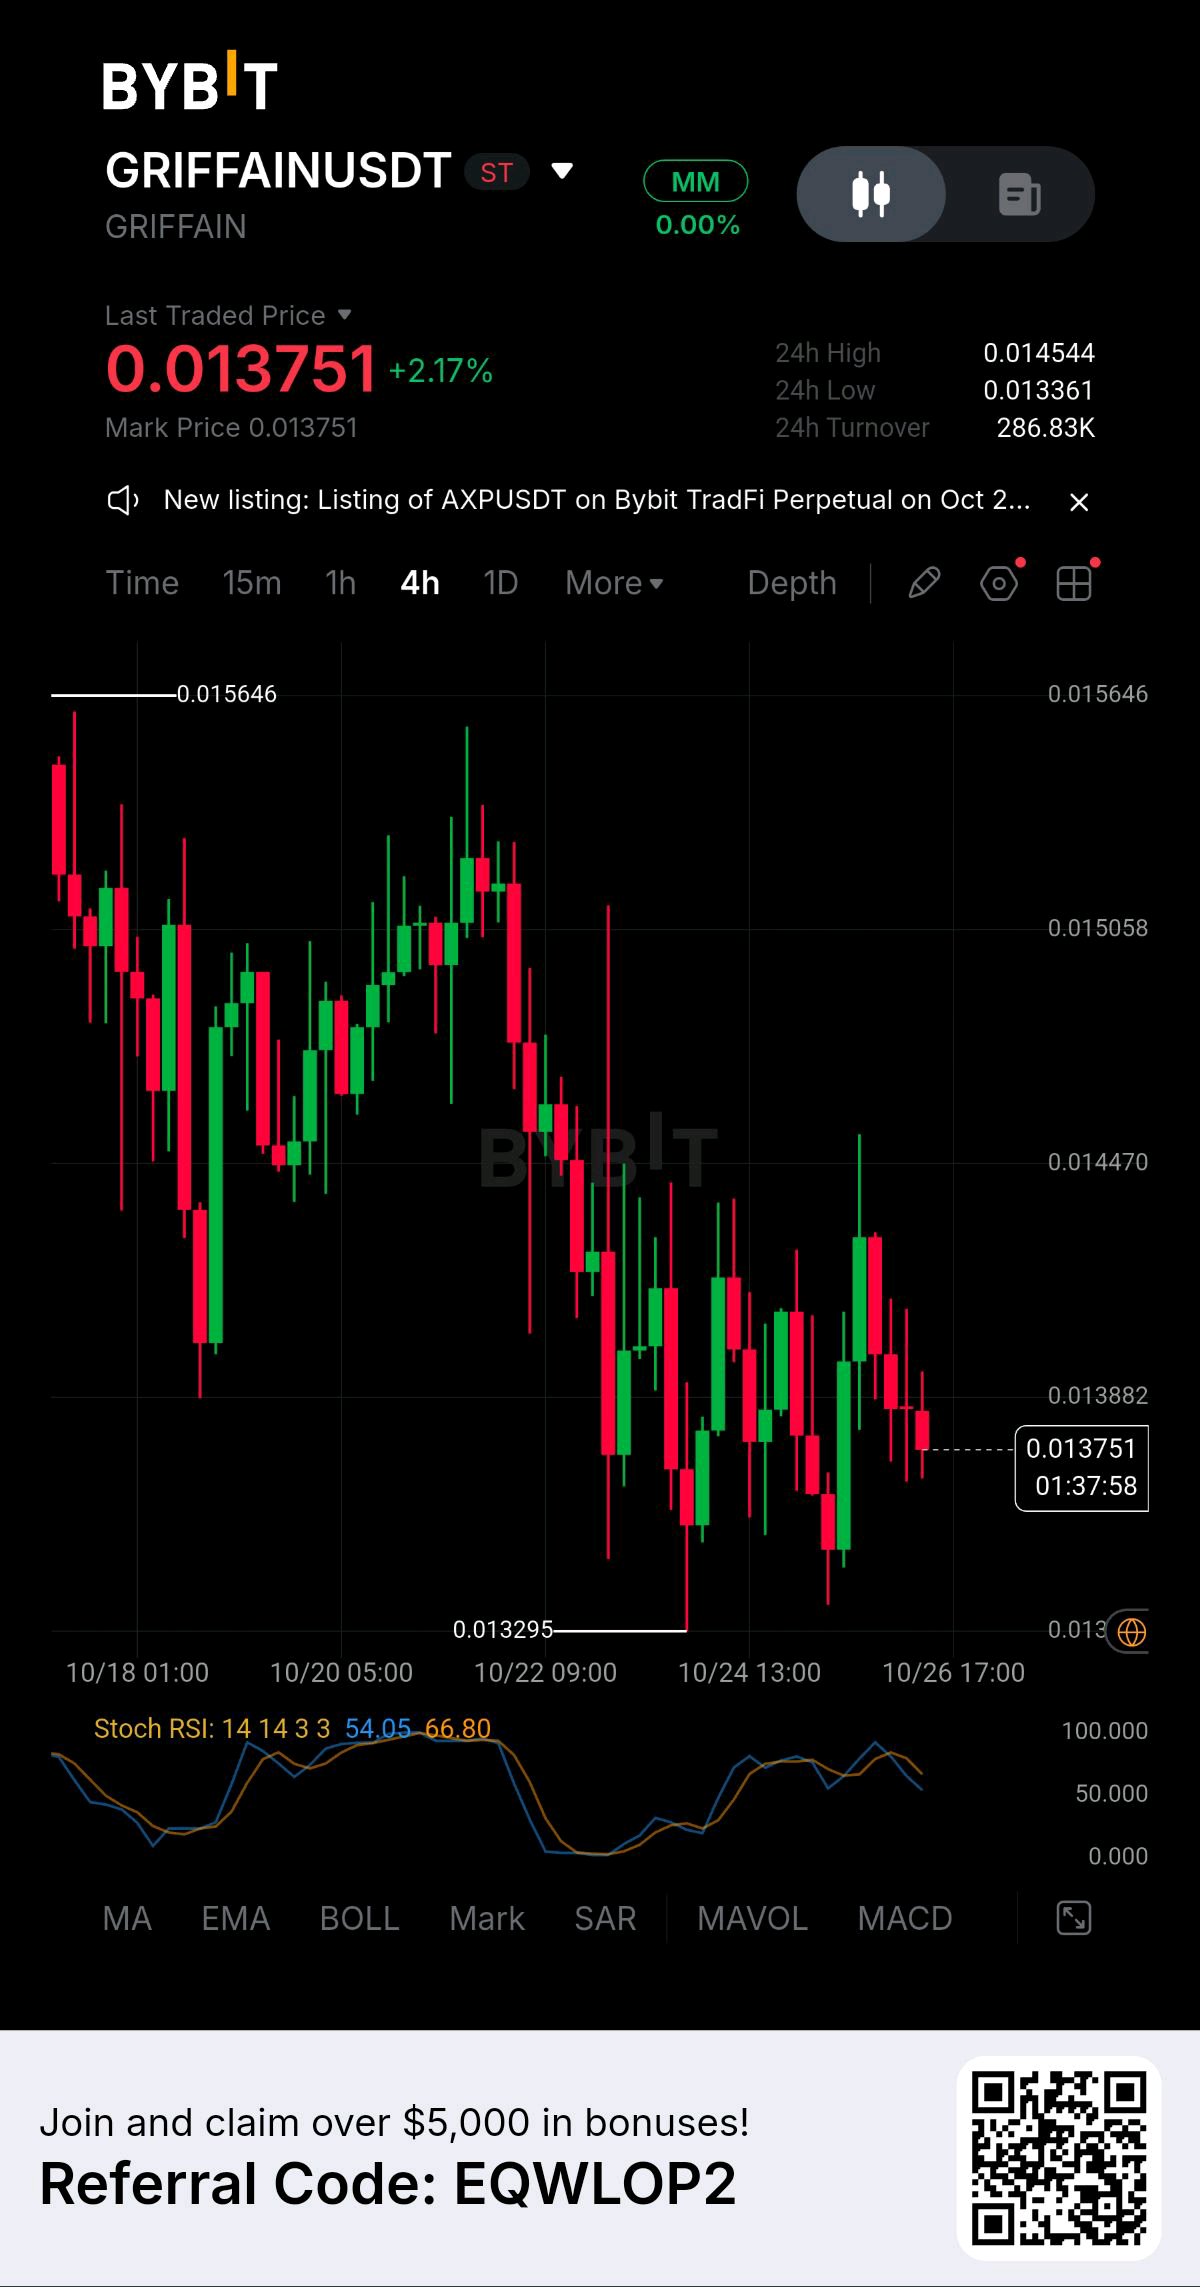
GRIFFAIN is trading around $0.0140, and the market is showing signs of hesitation after several sessions of selling pressure. Although the price has attempted to stabilize, the broader structure remains weak, with the token down approximately 5% over the past seven days. The important question is whether buyers can build enough momentum to reverse the trend or whether sellers will push the price toward another support zone. My current outlook is cautious because the recent recovery has not yet confirmed a sustained bullish reversal. MARKET STRUCTURE GRIFFAIN's short-term technical structure remains bearish. The RSI is around 43, indicating that momentum is still relatively weak, while the MACD continues to signal bearish pressure. Trading volume is also below its recent average, suggesting that the latest price movements lack strong participation. This does not mean a recovery is impossible, but buyers need to demonstrate stronger demand before the market can establish a convincing upward trend. KEY SUPPORT LEVELS The $0.0135–$0.0133 region is the immediate support zone to watch. If buyers defend this area, GRIFFAIN could establish a base and attempt a recovery. However, a decisive breakdown below $0.0133 could expose lower levels around $0.0125 and $0.0120. These are potential downside areas rather than guaranteed targets, and the market's reaction at each level will be important. RESISTANCE AND BULLISH SCENARIO On the upside, $0.0144–$0.0145 is the first resistance zone. A strong move above this area could open the way toward $0.0150–$0.0155. If buyers reclaim $0.0155 with increasing volume, the market structure could improve and create room for a stronger recovery. However, repeated rejection below resistance would suggest that sellers remain in control. WHAT TRADERS SHOULD WATCH Bitcoin's direction remains important because smaller altcoins often react strongly to broader market movements. GRIFFAIN's relatively limited trading liquidity can also amplify sudden price changes. An increase in volume during a breakout would provide stronger confirmation than a price rise occurring with weak participation. Traders should avoid treating a single green candle as proof that the downtrend has ended. MY FINAL VERDICT My current bias on GRIFFAIN remains bearish while the price stays below $0.0145–$0.0150. Holding the $0.0133–$0.0135 support zone could create an opportunity for a recovery toward $0.0145 and potentially $0.0155. However, losing support could expose the market to $0.0125 and $0.0120. For me, confirmation is more important than prediction. I would watch how price reacts around these key levels before deciding whether the market is preparing for a reversal or another downward move. Will GRIFFAIN reclaim $0.0150, or will sellers push it below $0.0133? Share your analysis in the comments. #IMPACTbyTrade #MyByXTake #WSOT2026 $BTCUSDT $BNBUSDT

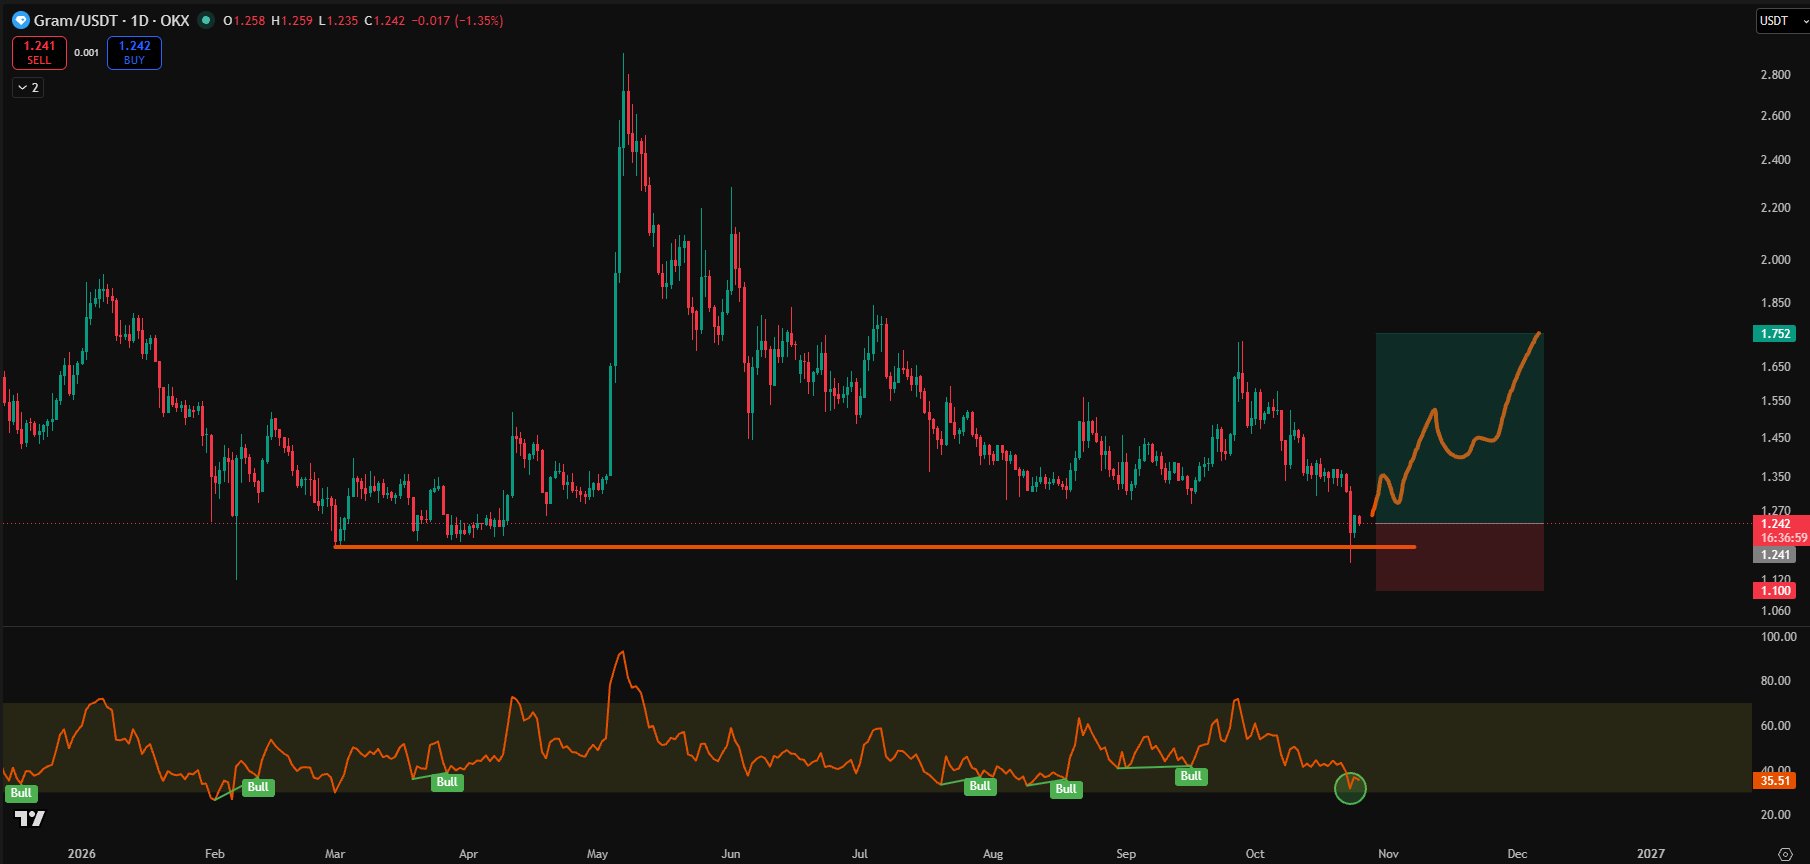
$GRAM: BEARS IN CONTROL, WILL SUPPORT HOLD?
Gram ($GRAM) is facing significant selling pressure, with its price trading around $1.22 and declining approximately 1.3% over the past 24 hours. The current market structure suggests that sellers maintain control across multiple timeframes. However, the price is approaching an important support zone where buyers could attempt to stabilize the market. The key question is whether GRAM can defend this level or whether another downward move is approaching. MARKET STRUCTURE The technical outlook remains bearish, with the daily Relative Strength Index near 34, indicating weak momentum. The MACD is also negative, while several moving averages are pointing toward continued selling pressure. These indicators suggest that buyers have not yet established a convincing reversal. However, the market is approaching oversold territory, which means a temporary recovery is possible. An oversold reading alone does not confirm that a bottom has formed. KEY SUPPORT LEVELS The $1.21–$1.23 region is the immediate support area to monitor. If buyers successfully defend this zone, GRAM could attempt a recovery toward nearby resistance. However, a decisive daily close below $1.21 could expose the next support around $1.15, followed by $1.05 if selling pressure intensifies. These levels are potential areas of interest, not guaranteed price targets. RESISTANCE AND RECOVERY POTENTIAL On the upside, $1.28 is the first major resistance to watch. A strong breakout above this level could open the way toward $1.30–$1.35. If buyers reclaim these levels and maintain momentum, the broader recovery could strengthen. However, repeated rejection around resistance would suggest that sellers remain active and that the current weakness has not yet ended. WHAT COULD HAPPEN NEXT? Bitcoin's performance will remain an important influence on GRAM. If BTC continues weakening, altcoins could face additional selling pressure. Conversely, a recovery across the broader cryptocurrency market could help GRAM attract buyers. Trading volume is another critical factor: a rebound supported by increasing buying activity would be more convincing than a price increase occurring on weak volume. MY FINAL VERDICT My current outlook on GRAM is bearish while the price remains below $1.28. The $1.21–$1.23 zone is the immediate support to watch. Holding this area could trigger a recovery toward $1.28 and potentially $1.35, while a confirmed breakdown below $1.21 could expose $1.15. For now, I would not consider a bullish reversal confirmed until buyers reclaim resistance and establish a stronger market structure. The next decisive move around support could determine GRAM's short-term direction. Will GRAM recover from this support zone, or are sellers preparing another move lower? Share your analysis in the comments. #MyByXTake #ByXIMPACT #USCPI #BybitStocks $GRAMUSDT
$ENA: BULLISH RECOVERY
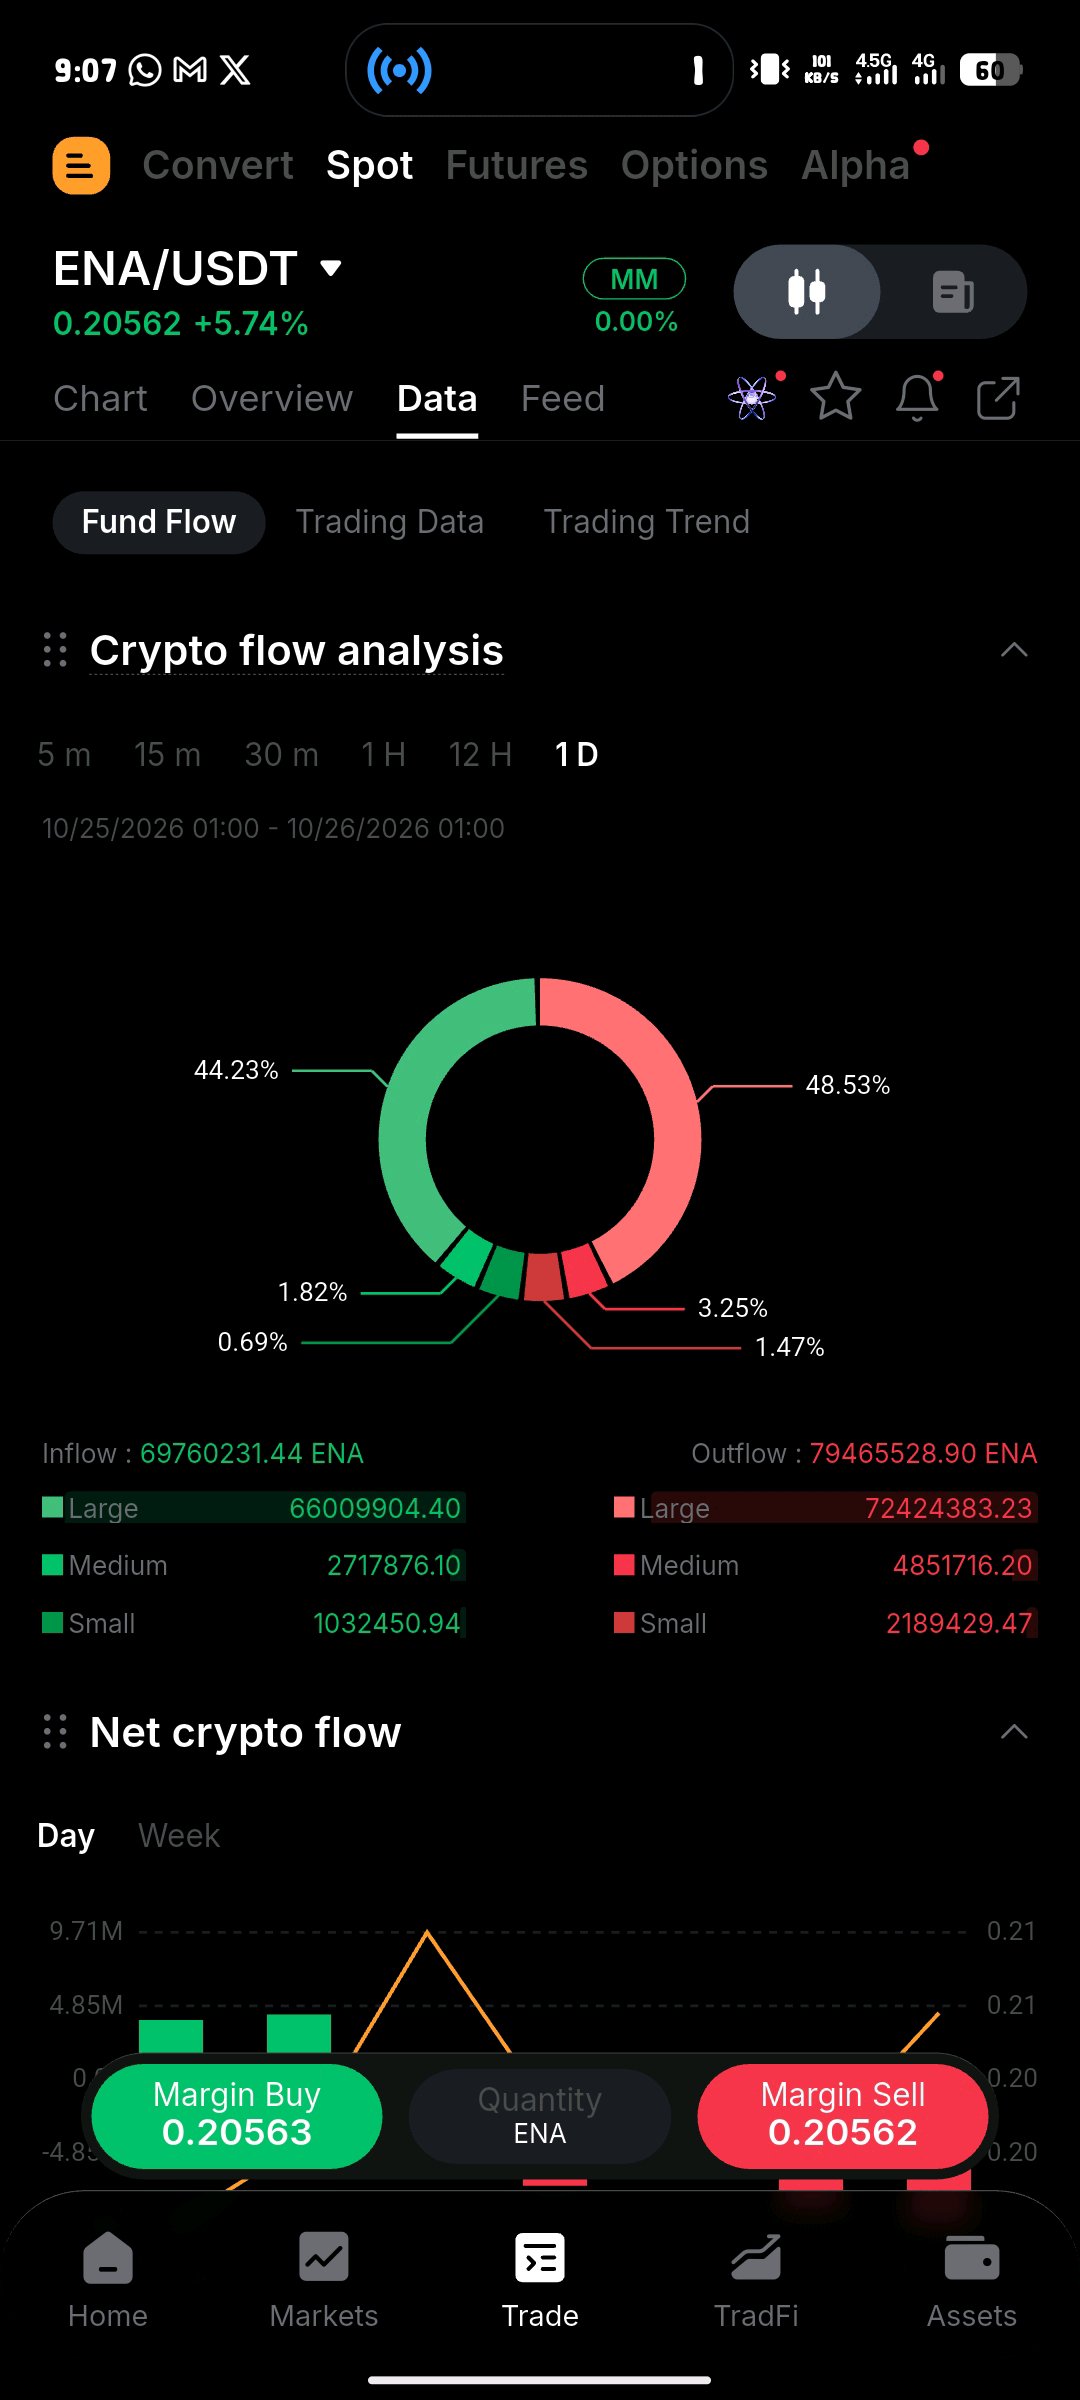
Ethena ($ENA) is showing renewed strength, with the price trading around $0.208 and gaining approximately 8% over the past 24 hours. Buyers are stepping back into the market, and the technical structure is improving across several timeframes. However, the key question is whether this recovery has enough momentum to break through major resistance or whether sellers will step in again. My focus is on whether ENA can maintain its upward momentum and establish a stronger market structure. MARKET STRUCTURE ENA is showing a short-term bullish bias, with price trading above several key moving averages. The daily RSI is around 51, indicating that momentum is improving without reaching traditionally overbought territory. This leaves room for further upside if buying pressure continues. However, the price is approaching an important resistance zone, where profit-taking could trigger a temporary pullback. Traders should watch whether ENA forms higher lows and holds above reclaimed levels, as this would provide stronger evidence of a sustained recovery. KEY RESISTANCE LEVELS The first resistance is around $0.212. A decisive breakout above this level, supported by strong trading volume, could open the way toward $0.220 and $0.230. If bullish momentum continues and the $0.230 region is successfully reclaimed, the next potential target could be $0.250. These are conditional price targets, not guaranteed outcomes. Failure to break resistance could result in consolidation or a retracement before another attempt. SUPPORT LEVELS TO WATCH On the downside, $0.200 is the immediate support area. Holding above this level would help preserve the current recovery structure. If ENA loses this support, the next levels to watch are $0.188 and $0.175. A sustained breakdown below these zones would weaken the bullish outlook and suggest that sellers are regaining control. WHAT COULD DRIVE THE NEXT MOVE? Trading volume and broader cryptocurrency market sentiment will be important. Increasing spot demand could help ENA break resistance, while weakening Bitcoin could place pressure on altcoins and limit ENA's upside. Investors should also monitor Ethena's ecosystem growth, USDe adoption, token supply dynamics, and market liquidity. Strong price action needs to be supported by genuine demand rather than short-lived speculation. MY FINAL VERDICT My current outlook on ENA is cautiously bullish while the price holds above $0.200. A confirmed breakout above $0.212 could open the door toward $0.220–$0.230, with $0.250 becoming a possible extension if momentum remains strong. However, rejection at resistance or a breakdown below support could invalidate this scenario. The most important level right now is $0.212. Can ENA break through and continue its recovery, or will sellers reject the move? Share your analysis in the comments. $ENAUSDT #MyByXTake #ByXIMPACT

$BTC: BITCOIN AT A CRITICAL TURNING POINT
Bitcoin is trading around $79,400, and the market is approaching a critical moment that could determine its next major direction. Recent price action shows increasing selling pressure, weakening short-term momentum, and uncertainty across the broader financial market. Although Bitcoin has experienced recoveries in recent sessions, buyers have yet to establish a convincing bullish structure. The key question is whether BTC can defend its current support zone or whether sellers will push the market toward lower levels. MARKET STRUCTURE AND MOMENTUM Bitcoin's short-term technical structure remains under pressure. The daily Relative Strength Index is around 40, indicating weak momentum, while the MACD remains bearish. These signals suggest that sellers currently have an advantage in the short term. However, the broader picture is more complicated because some longer-term indicators remain constructive. This divergence between short-term weakness and longer-term potential suggests that Bitcoin could experience additional volatility before establishing a clear direction. KEY SUPPORT LEVELS The $79,400–$79,500 region is the immediate support zone to watch. A sustained breakdown below this area could expose $78,100, followed by the $75,000 region. If selling pressure accelerates, traders may also monitor the $72,000–$74,000 area for a potential reaction. These levels are possible support zones, not guaranteed reversal points. A strong recovery after a breakdown could indicate a liquidity sweep, while continued trading below support would strengthen the bearish scenario. RESISTANCE AND BULLISH RECOVERY On the upside, Bitcoin needs to reclaim $80,700 to show its first sign of short-term recovery. The next resistance levels are around $81,700 and $83,000. A decisive move above these zones, supported by stronger buying volume, could improve market sentiment and open the door toward $84,600–$87,000. However, a brief breakout without sustained demand could turn into another rejection. Buyers must demonstrate that they can defend reclaimed levels before a stronger bullish continuation becomes convincing. MACROECONOMIC FACTORS Bitcoin's direction is also influenced by Federal Reserve policy expectations, institutional investment flows, geopolitical developments, and overall risk appetite. Uncertainty surrounding interest rates can affect demand for risk-sensitive assets, including cryptocurrencies. Institutional flows are equally important because sustained investment can support recoveries, while persistent outflows may add selling pressure. Traders should therefore monitor the broader financial environment alongside Bitcoin's technical structure rather than relying on chart patterns alone. MY FINAL VERDICT My current outlook is cautious, with short-term bearish pressure remaining dominant while BTC trades below $80,700–$81,700. Holding the $79,400 support zone could allow Bitcoin to stabilize and attempt a recovery. However, losing that level could expose the market to $78,100 and potentially $75,000. For the bullish scenario to strengthen, Bitcoin needs to reclaim nearby resistance and establish higher lows with stronger buying volume. The most important thing now is confirmation. Bitcoin could recover sharply, but another breakdown remains possible. I would watch the reaction around support and resistance carefully rather than assume that either direction is guaranteed. The next decisive move could influence sentiment across the entire cryptocurrency market. Bitcoin is at a critical crossroads. Will buyers defend $79,000, or will sellers push BTC toward $75,000? Share your analysis in the comments. $BTCUSDT #MyByXTake #ByXIMPACT #Bybit8thAnniversary

*Institutional Market Structure Analysis*
This $XAUTUSDT market structure analysis highlights key institutional price levels, major supply and demand zones, and important liquidity areas that may influence future price movement. The 3900 demand zone represents a potential area of buying interest, while the 4600 institutional key level marks an important price reference for monitoring market reactions. The 4900 resistance zone is a potential area of selling pressure where traders can observe rejection, liquidity formation, or a possible breakout. The mid-range liquidity zone provides additional context for understanding price movement between major levels. By combining market structure, liquidity concepts, and key support and resistance areas, traders can develop a clearer view of the market's overall behavior. Observe price action, displacement, and confirmation before considering any trading setup. A breakout above resistance or a breakdown below support may indicate a shift in market conditions, while a rejection can suggest a temporary reversal or continuation in the opposite direction. Trading note: Stay patient, manage risk carefully, and wait for clear confirmation. These levels are areas to monitor, not guaranteed turning points or price targets. Always use a suitable stop-loss and make decisions based on your own analysis. #MyByXTake #ByXIMPACT #MidtermsMarketWatch


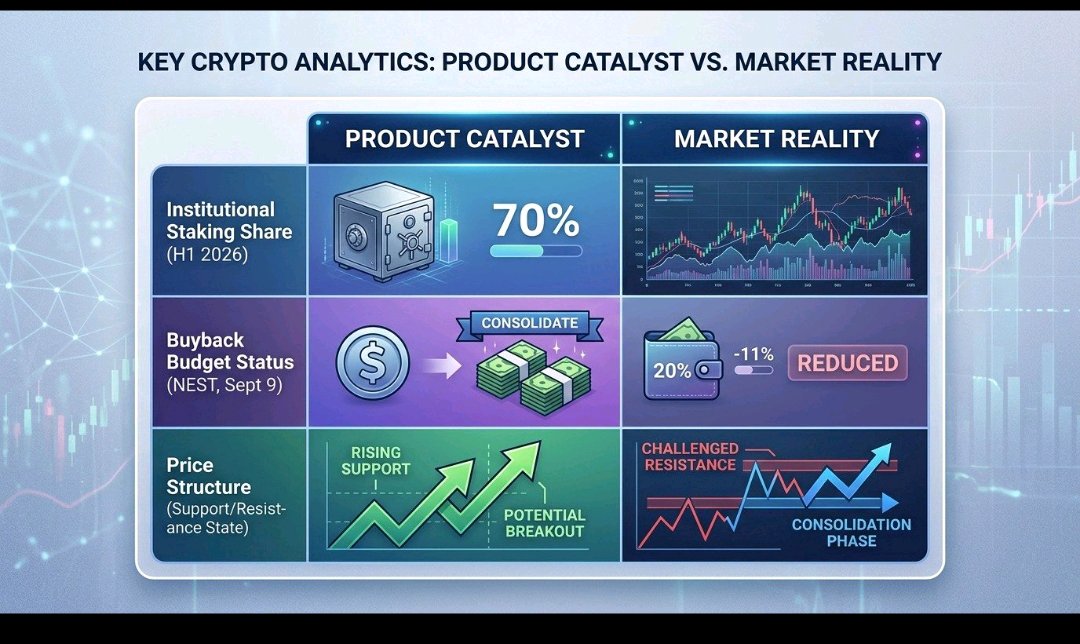
On September 9, Lido and Stakely launched dedicated institutional stVaults on Ethereum mainnet — non-custodial, segregated vaults built for asset managers, treasuries, and ETF/ETP issuers to set their own fee and permission terms. It's a real product, not a roadmap promise. But the timing cuts against the obvious bullish read: Lido captured just 5.7% of Ethereum's net staking growth in the first half of 2026, meaning institutional staking demand has been flowing mostly to competitors while $LDO's own buyback mechanism (NEST) posted a negative cumulative budget and skipped a scheduled purchase this month. That's a genuine catalyst without confirmed follow-through — structure here doesn't support a confident long. LDO remains in a multi-month downtrend with prior support levels flipped to resistance and no clean demand zone established below current price. This is a watch, not an entry: track whether stVaults actually pulls institutional ETH share back over the next 4-6 weeks. Failure to reclaim broken support levels keeps this a structural downtrend regardless of the product news. #MyByXTake #ByXIMPACT $LDOUSDT
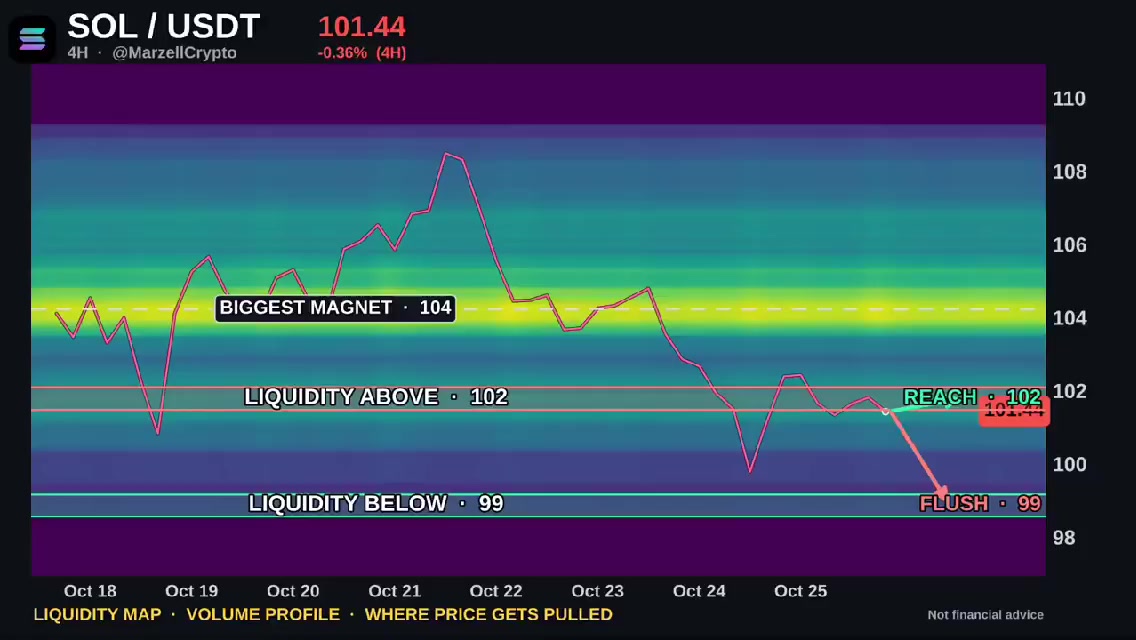
$SOLUSDT is sitting at $101.44, a couple of dollars under its biggest volume cluster at $104. $102 is the first shelf above. Reclaim it and I think $104 gets pulled in next. Lose the shelf and $99 is the liquidity below, the zone Saturday's wick already tagged. Not financial advice. #ByXIMPACT #BybitStocks #MyByXTake #USNonfarmPayrolls
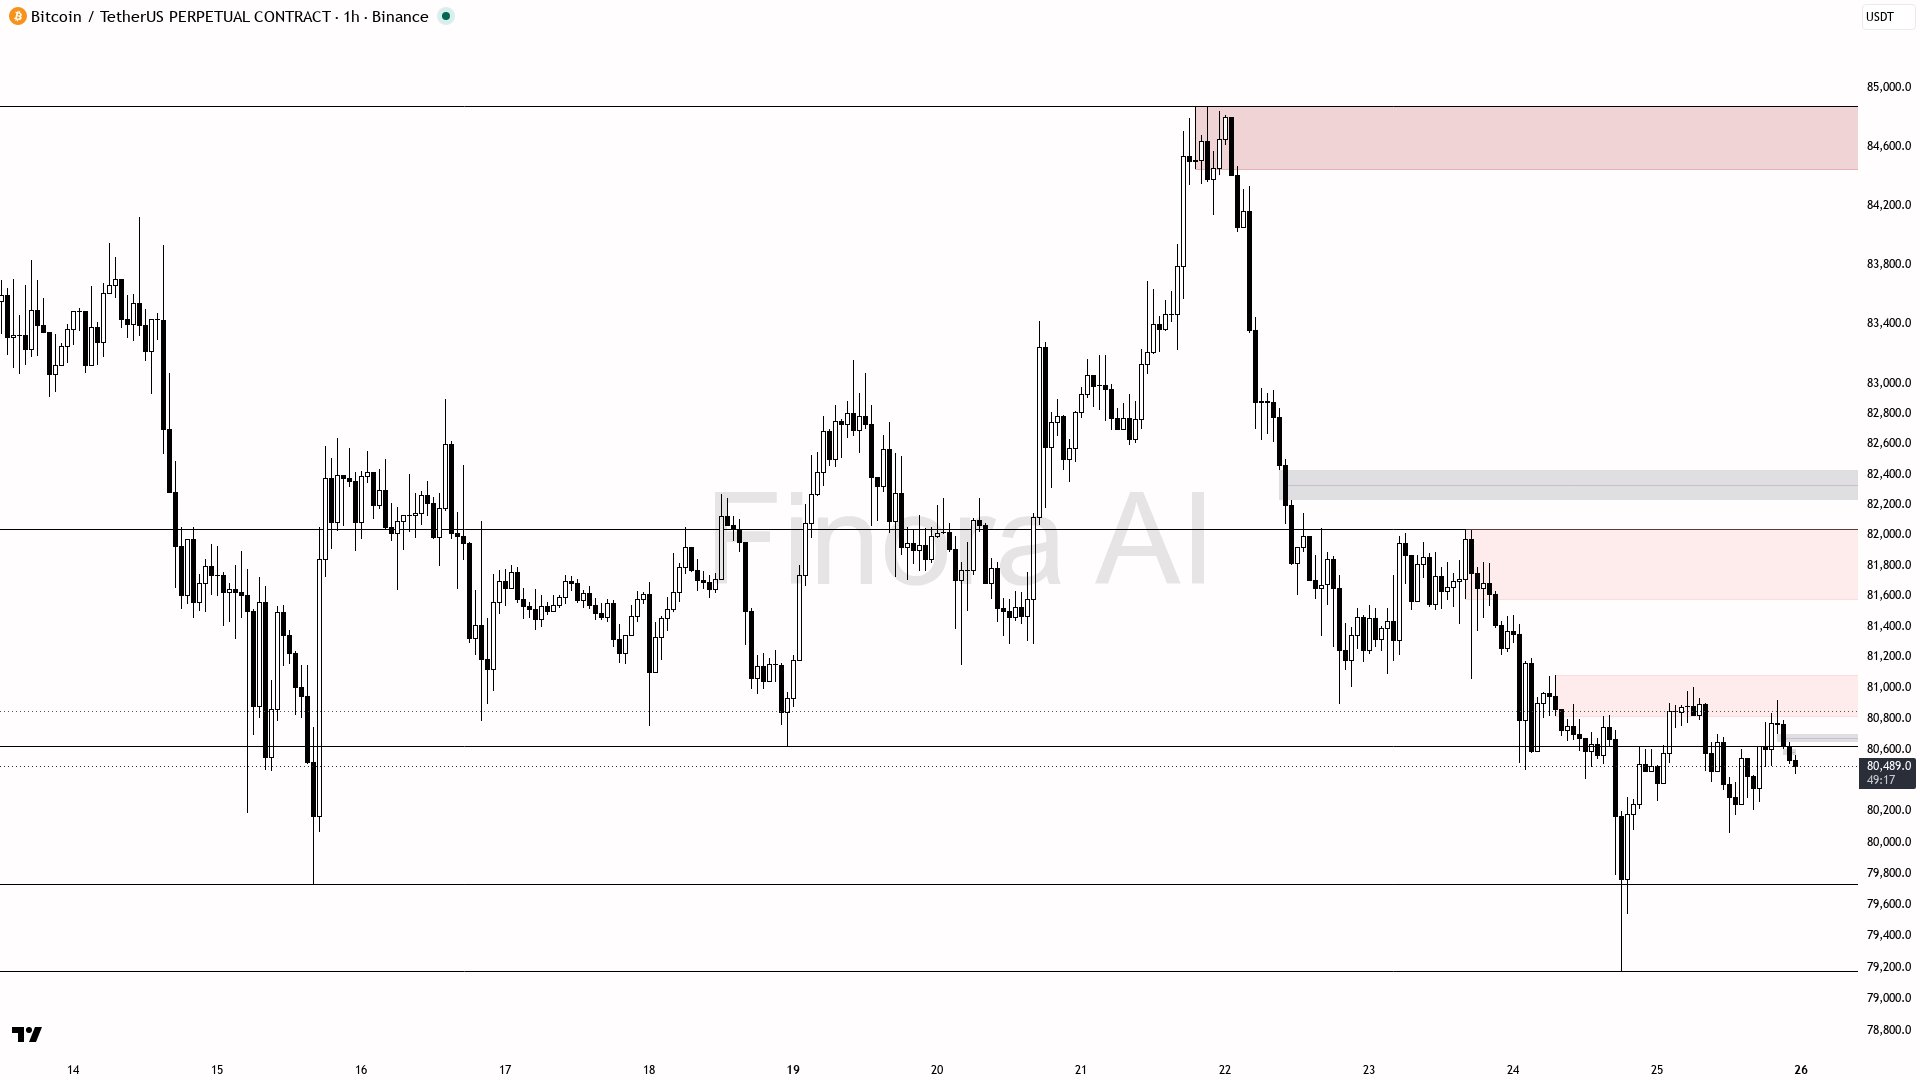
🧐 $BTC holds steady near key support with zero change—can bulls maintain this fragile structure? - My bias is cautiously bullish here on BTCUSDT.P 1h, as the market structure remains bullish with higher highs and higher lows, but price is sitting right at the lower end of the swing and daily structure is still bearish, so I want confirmation before jumping in 📊 - Current price is 80,489, just above the 80,059 last confirmed higher low (liquidity edge and structure invalidation) - I expect any sweep or liquidity grab below 80,059 to present a high-probability long if there’s a strong bullish reaction (engulfing candle, clear pin bar, or a lower timeframe market structure shift reclaiming 80,060+) - Cleanest long setup: wait for a move into the 80,059–79,800 demand zone, then enter only with clear bullish reversal candle or lower timeframe break of structure; initial target is the 80,999–81,014 resistance cluster (previous high, FVG fill), then 81,500 and 82,035 if momentum builds - If the market pushes through these levels, next upside targets are 83,420 (major supply zone) and then 85,265–85,624 - For shorts, I’d need to see a clear rejection and break/close below 80,059 — that would flip structure bearish and open downside toward 79,178 and lower, but at this moment the setup favors dips being bought unless that flip happens - Entry confirmation: look for a sweep below 80,059 with immediate reclaim, or a strong bullish engulfing off that area with volume picking up (current participation is low, so want to see at least a bit of a kick in relative volume) - Invalidation: any 1h candle close below 80,059 flips structure bearish — that’s the level to place protection beyond and to step aside from longs if lost - Not investment advice, educational report only 📊 Flow: OI $7.51B (-3.1% 24h) · funding +0.0049% · taker 0.59× · 🐋 ~3m: $4.3M buy / $1.1M sell Analyze any coin on any timeframe, free → link in bio 🔗 $BTCUSDT #MyByXTake #MidtermsMarketWatch #FOMCRateDecision #ByXIMPACT #BybitStocks $ETHUSDT
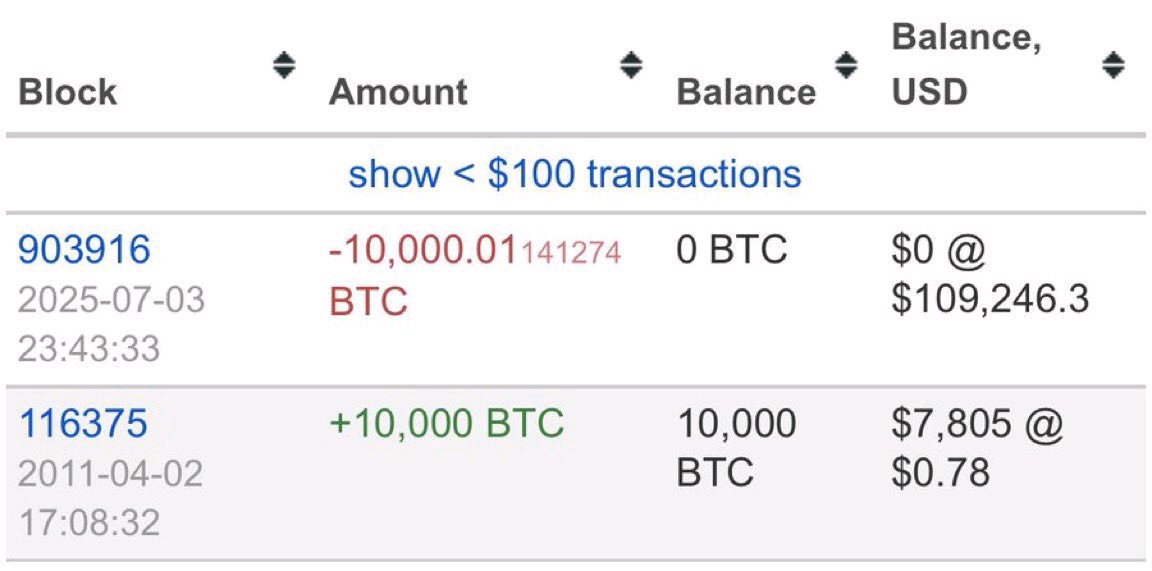
HE TURNED $7,805 INTO $1 BILLION. 🤯 In 2011, he bought 10,000 $BTCUSDT at $0.78 each. He survived nearly 14 years of crashes, bear markets, and chaos without selling a single coin. Then, in 2025, he sold everything for over $1 BILLION. A 128,000x RETURN. Conviction of a lifetime… or simply the ultimate HODL? Could you hold through every Bitcoin crash without selling a single coin? 👇 #MyByXTake #ByXIMPACT
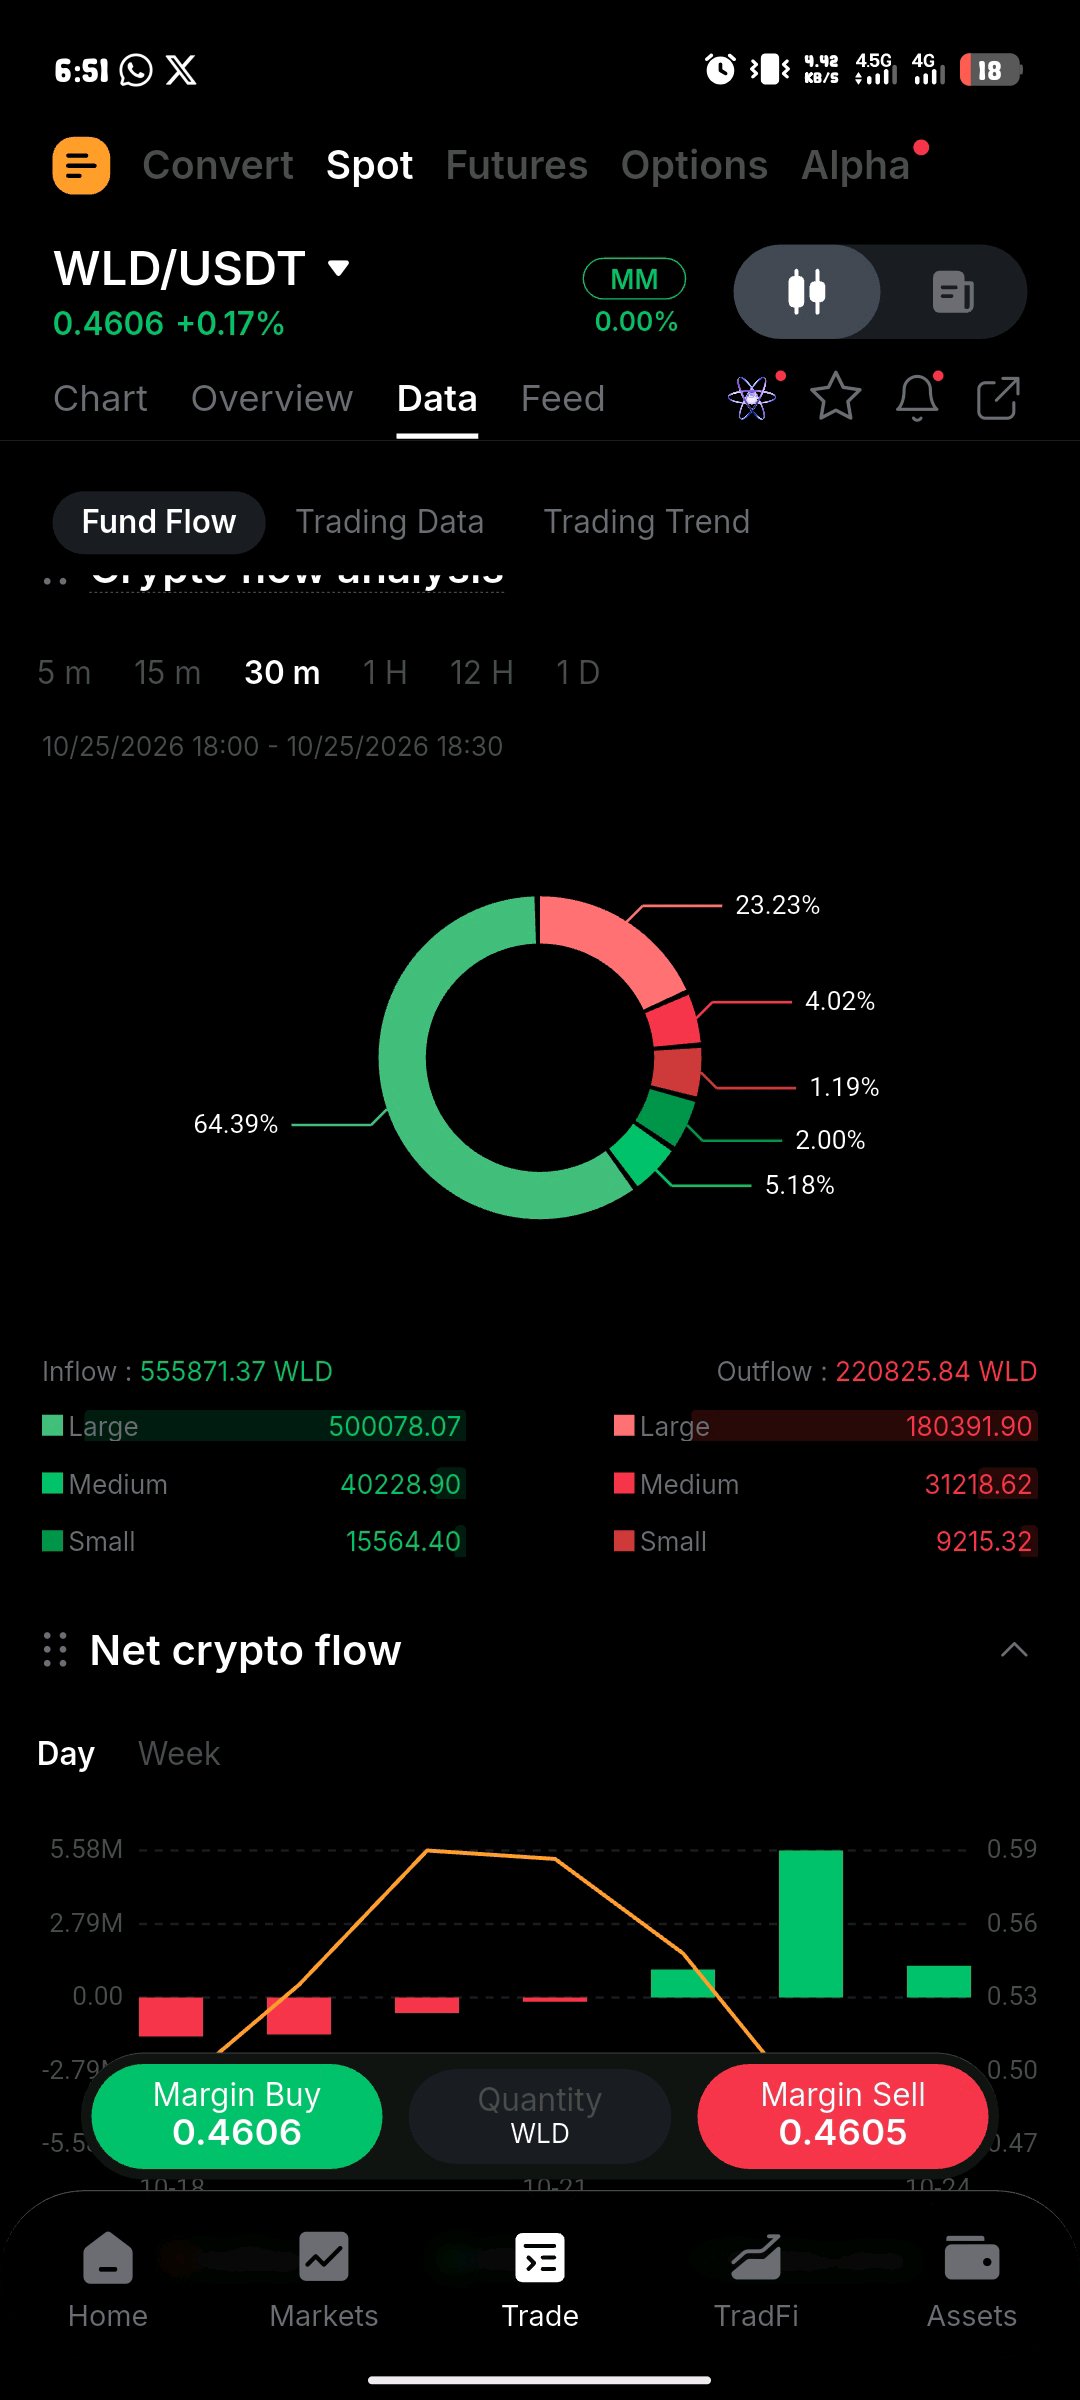
🔴 $WLD — I'm Watching for Another Drop 🤔
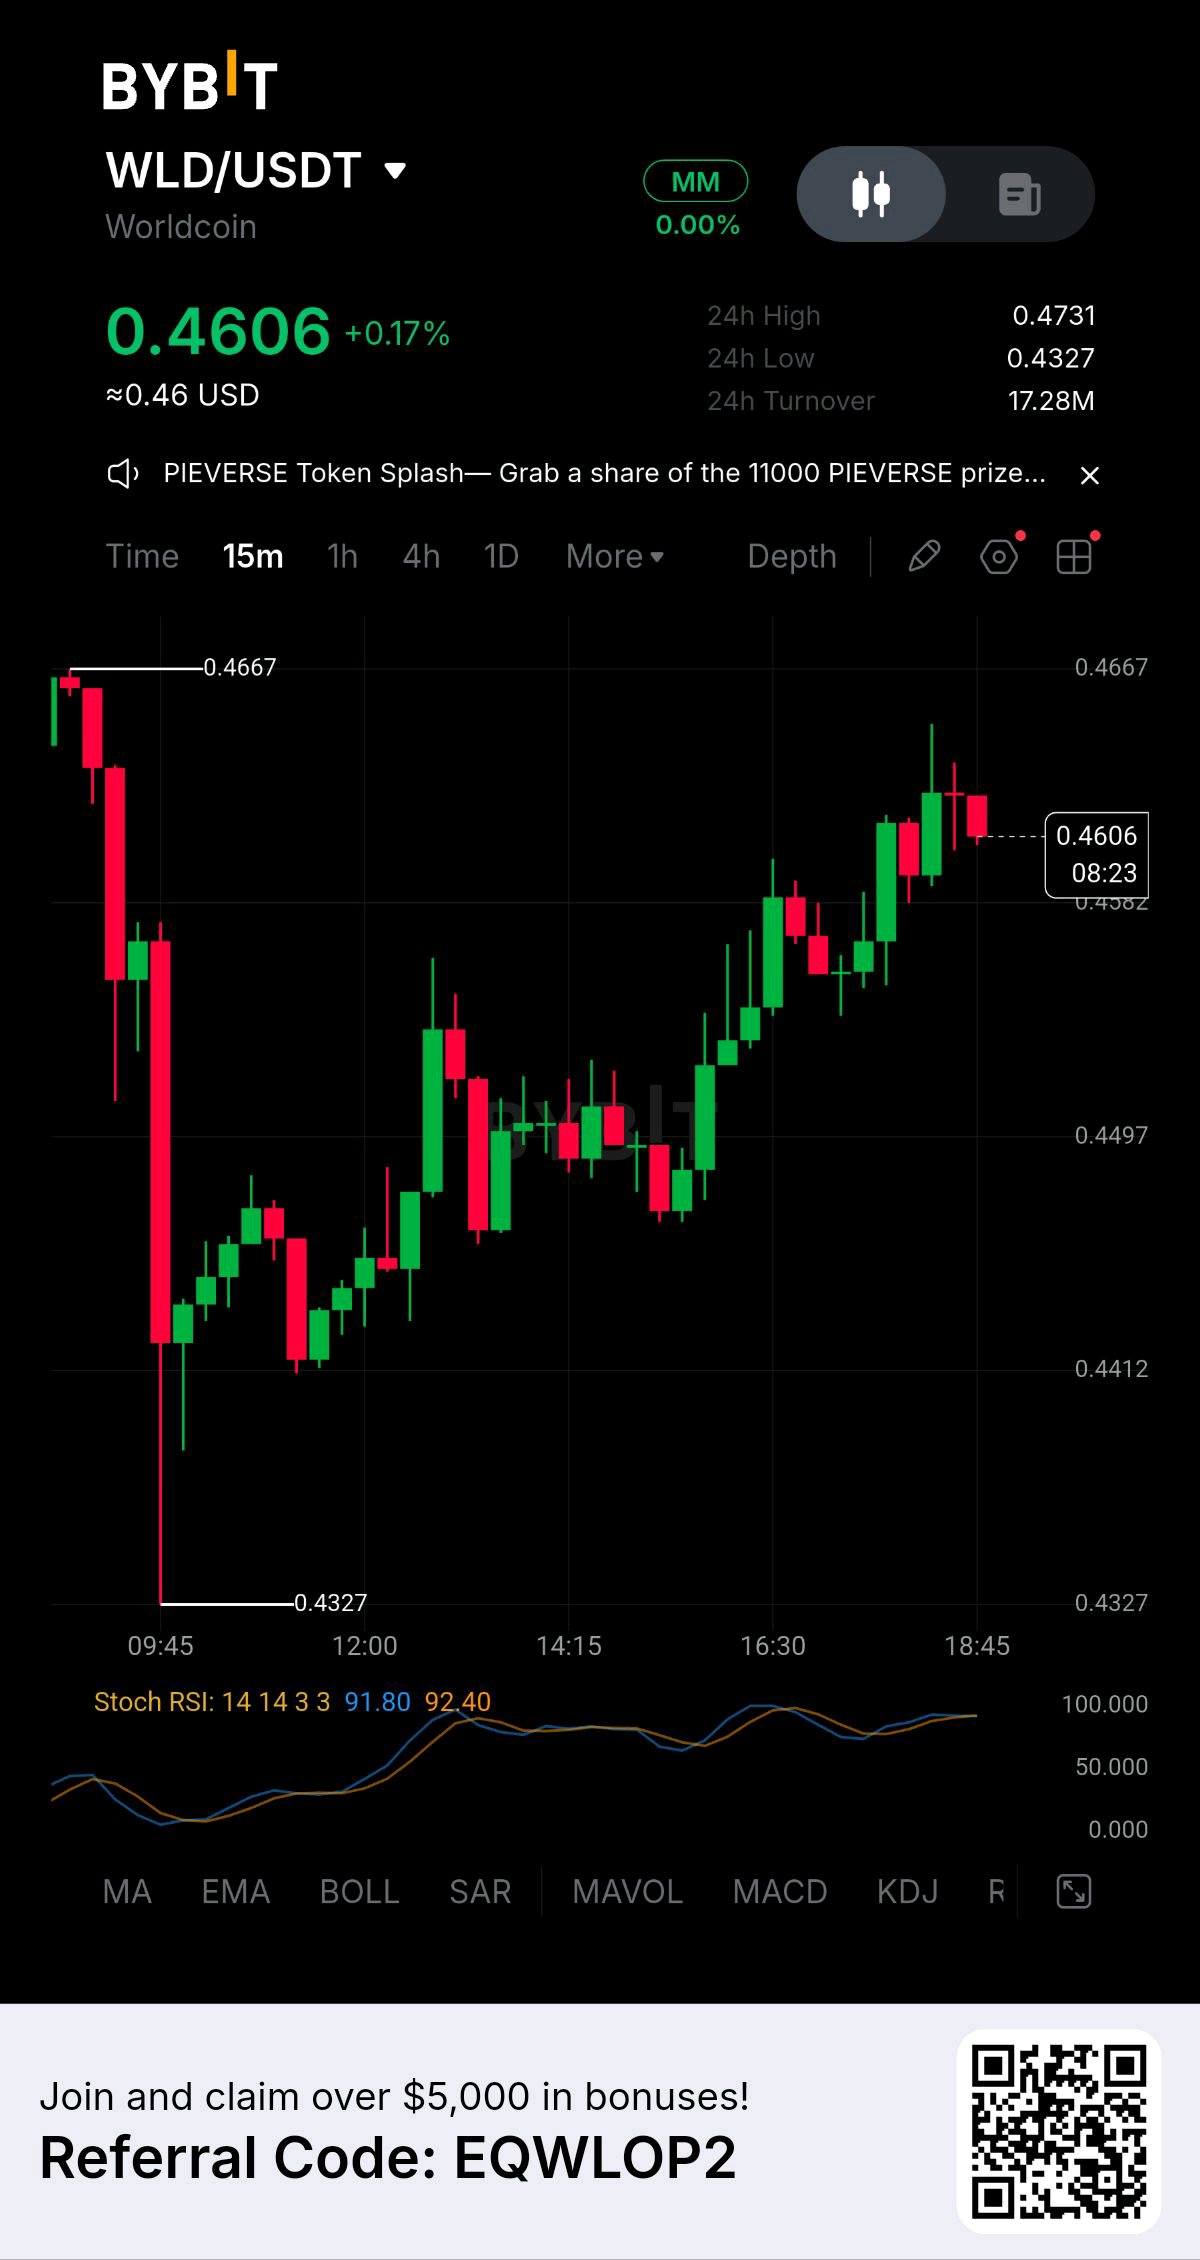
$WLDUSDT is trading around $0.46, and the short-term momentum looks weak. Recent selling pressure has me watching for a possible continuation to the downside. 📉 Key levels I'm watching: - Support: $0.45 - Next support: $0.42 - Resistance: $0.48 If $0.45 breaks, we could see another move lower. But if buyers defend this level, a bounce is possible. 😊 I want to see how price reacts before making any conclusions. 🤔 What's your take on $WLD? More downside ahead, or will buyers step in? 👇 Drop your thoughts in the comments! #MyByXTake #ByXIMPACT #BybitStocks #USNonfarmPayrolls
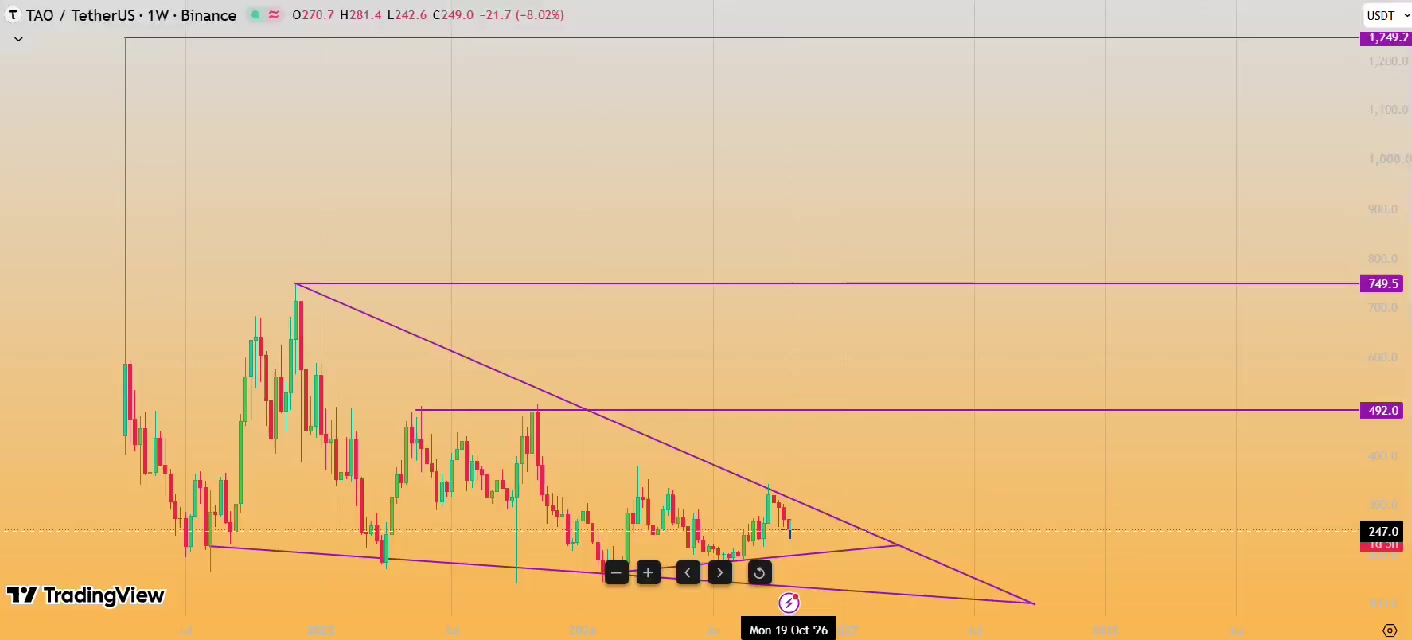
⚡ $TAO: CAN THE OLD WICK BECOME THE NEXT DESTINATION? 👀 TAO’s weekly chart puts the historical wick at $1,249.20 at the top of this recovery roadmap. First, price needs to defend rising support around $200–$210 and break descending resistance. A successful breakout and retest could bring $492 into focus, followed by $749.50. The projected route includes pullbacks into those levels before further advances. Turning both into support would strengthen the case for revisiting that old wick. A sustained loss of the rising base would weaken this bullish setup. #MyByXTake #ByXIMPACT #BybitStocks #FOMCMinutes:Hawkish #MidtermsMarketWatch $BTCUSDT $ETHUSDT