Samii
I'm Crypto Content Creator | Trader 📊 Sharing charts, market insights & my trading journey. Real observations. Simple analysis. DYOR.
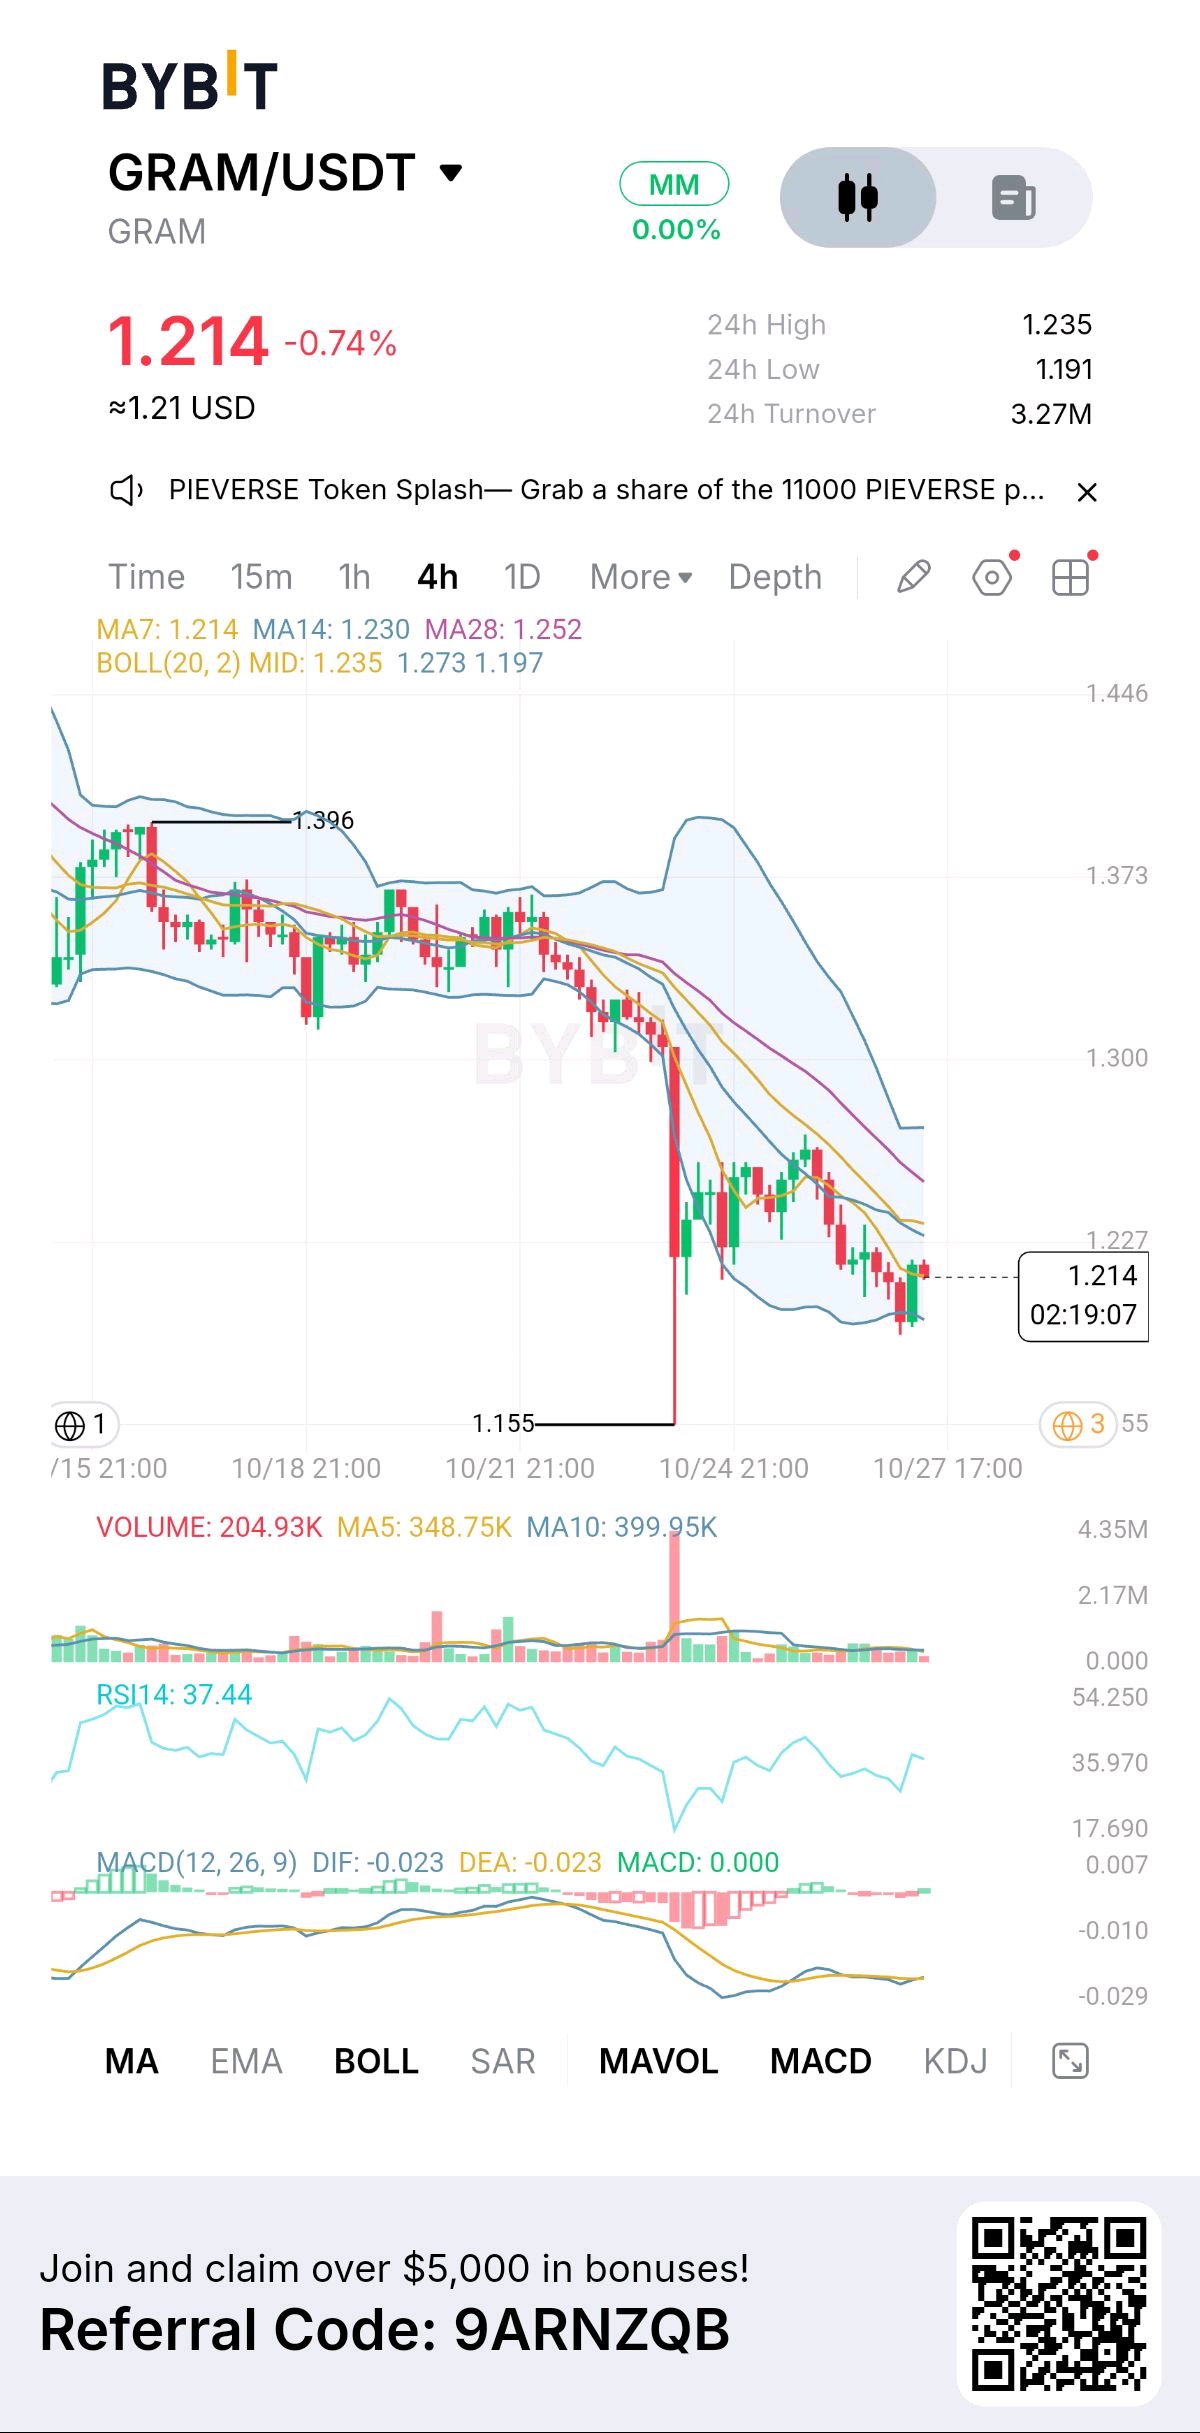
GRAM USDT Price Is Trying to Stabilize, but the Downtrend Hasn't Given Buyers Much Back Yet The interesting contradiction here is that GRAM's MACD histogram has recovered to zero, yet price is still trading below its key moving averages. That can signal easing selling pressure, but it isn't confirmation of a reversal. The next move depends on whether buyers can turn this pause into a genuine recovery. The Data Behind This Move The uploaded Bybit 4-hour chart shows GRAM at $1.214, down 0.74%. The 24-hour high is $1.235, the low is $1.191, and turnover is 3.27M. The chart marks a sharp downside wick near $1.155 and an earlier high around $1.396. CURRENT MARKET DATA Public trackers report different GRAM market figures, so the screenshot's $1.214 price and 3.27M turnover should not be confused with broader market-wide statistics. Circulating supply, total supply and trading volume also vary by data provider. These figures should be checked against the exact GRAM asset listing before making a decision. FUNDAMENTALS GRAM is associated with The Open Network ecosystem, which supports smart contracts, payments, decentralized applications and Telegram-integrated services. Its appeal lies in making blockchain activity more accessible through Telegram's user base. The important question is whether that reach creates sustained on-chain activity and meaningful demand for the token. TOKENOMICS Supply and token utility matter because network adoption does not automatically translate into price appreciation. Issuance, staking rewards, token distribution, transaction fees and any applicable burn mechanisms can influence the balance between supply and demand. GRAM's exact token contract and current tokenomics should be verified before assuming that TON's economic rules apply directly to it. MACRO + MARKET Bitcoin's direction, Ethereum's performance and broader risk appetite can influence smaller altcoins. Interest-rate expectations and dollar strength may also affect speculative capital. If traders continue reducing exposure to riskier assets, GRAM could struggle to sustain a recovery even if selling pressure starts to ease. CHART + INDICATORS The 4-hour structure shows lower highs and lower lows, following a sharp breakdown and a weak recovery. MA7 is $1.214, MA14 $1.230 and MA28 $1.252. Price remains below the longer averages, leaving overhead resistance. Bollinger Bands show a middle line at $1.235, upper band at $1.273 and lower band at $1.197. RSI14 is 37.44, indicating weak momentum without being deeply oversold. MACD's DIF and DEA both read -0.023, with a histogram of 0.000. This suggests bearish momentum has paused, not that buyers have taken control. Volume has also declined after the breakdown. BULLISH SCENARIO Trigger: A 4-hour close above $1.235, followed by a successful retest. Entry: $1.235–$1.245. SL: $1.205. TP1: $1.273; TP2: $1.300. Reclaiming the Bollinger midline would strengthen the recovery case. A sustained move below $1.205 weakens it. BEARISH SCENARIO Trigger: A 4-hour close below $1.191 followed by a failed retest. Entry: $1.185–$1.195. SL: $1.225. TP1: $1.155; TP2: $1.120. The previous wick at $1.155 is the first downside reference, while $1.120 is a conditional target, not confirmed support. A sustained reclaim of $1.235 weakens this setup. MY PERSONAL READ I wouldn't chase either direction yet. I'm watching whether $1.191 holds and whether GRAM can reclaim $1.235 with stronger volume. The indicators suggest selling pressure may be easing, but the price structure still favors caution. I'd rather wait for confirmation than treat a small bounce as a trend change. WHY THIS SETUP MATTERS The key is the difference between slowing downside momentum and an actual reversal. If buyers defend $1.191 and reclaim resistance, the chart could begin building a base. If support fails, the recent stabilization may prove temporary. That distinction helps separate a trade with confirmation from one based purely on hope. $GRAMUSDT #IMPACTbyTrade

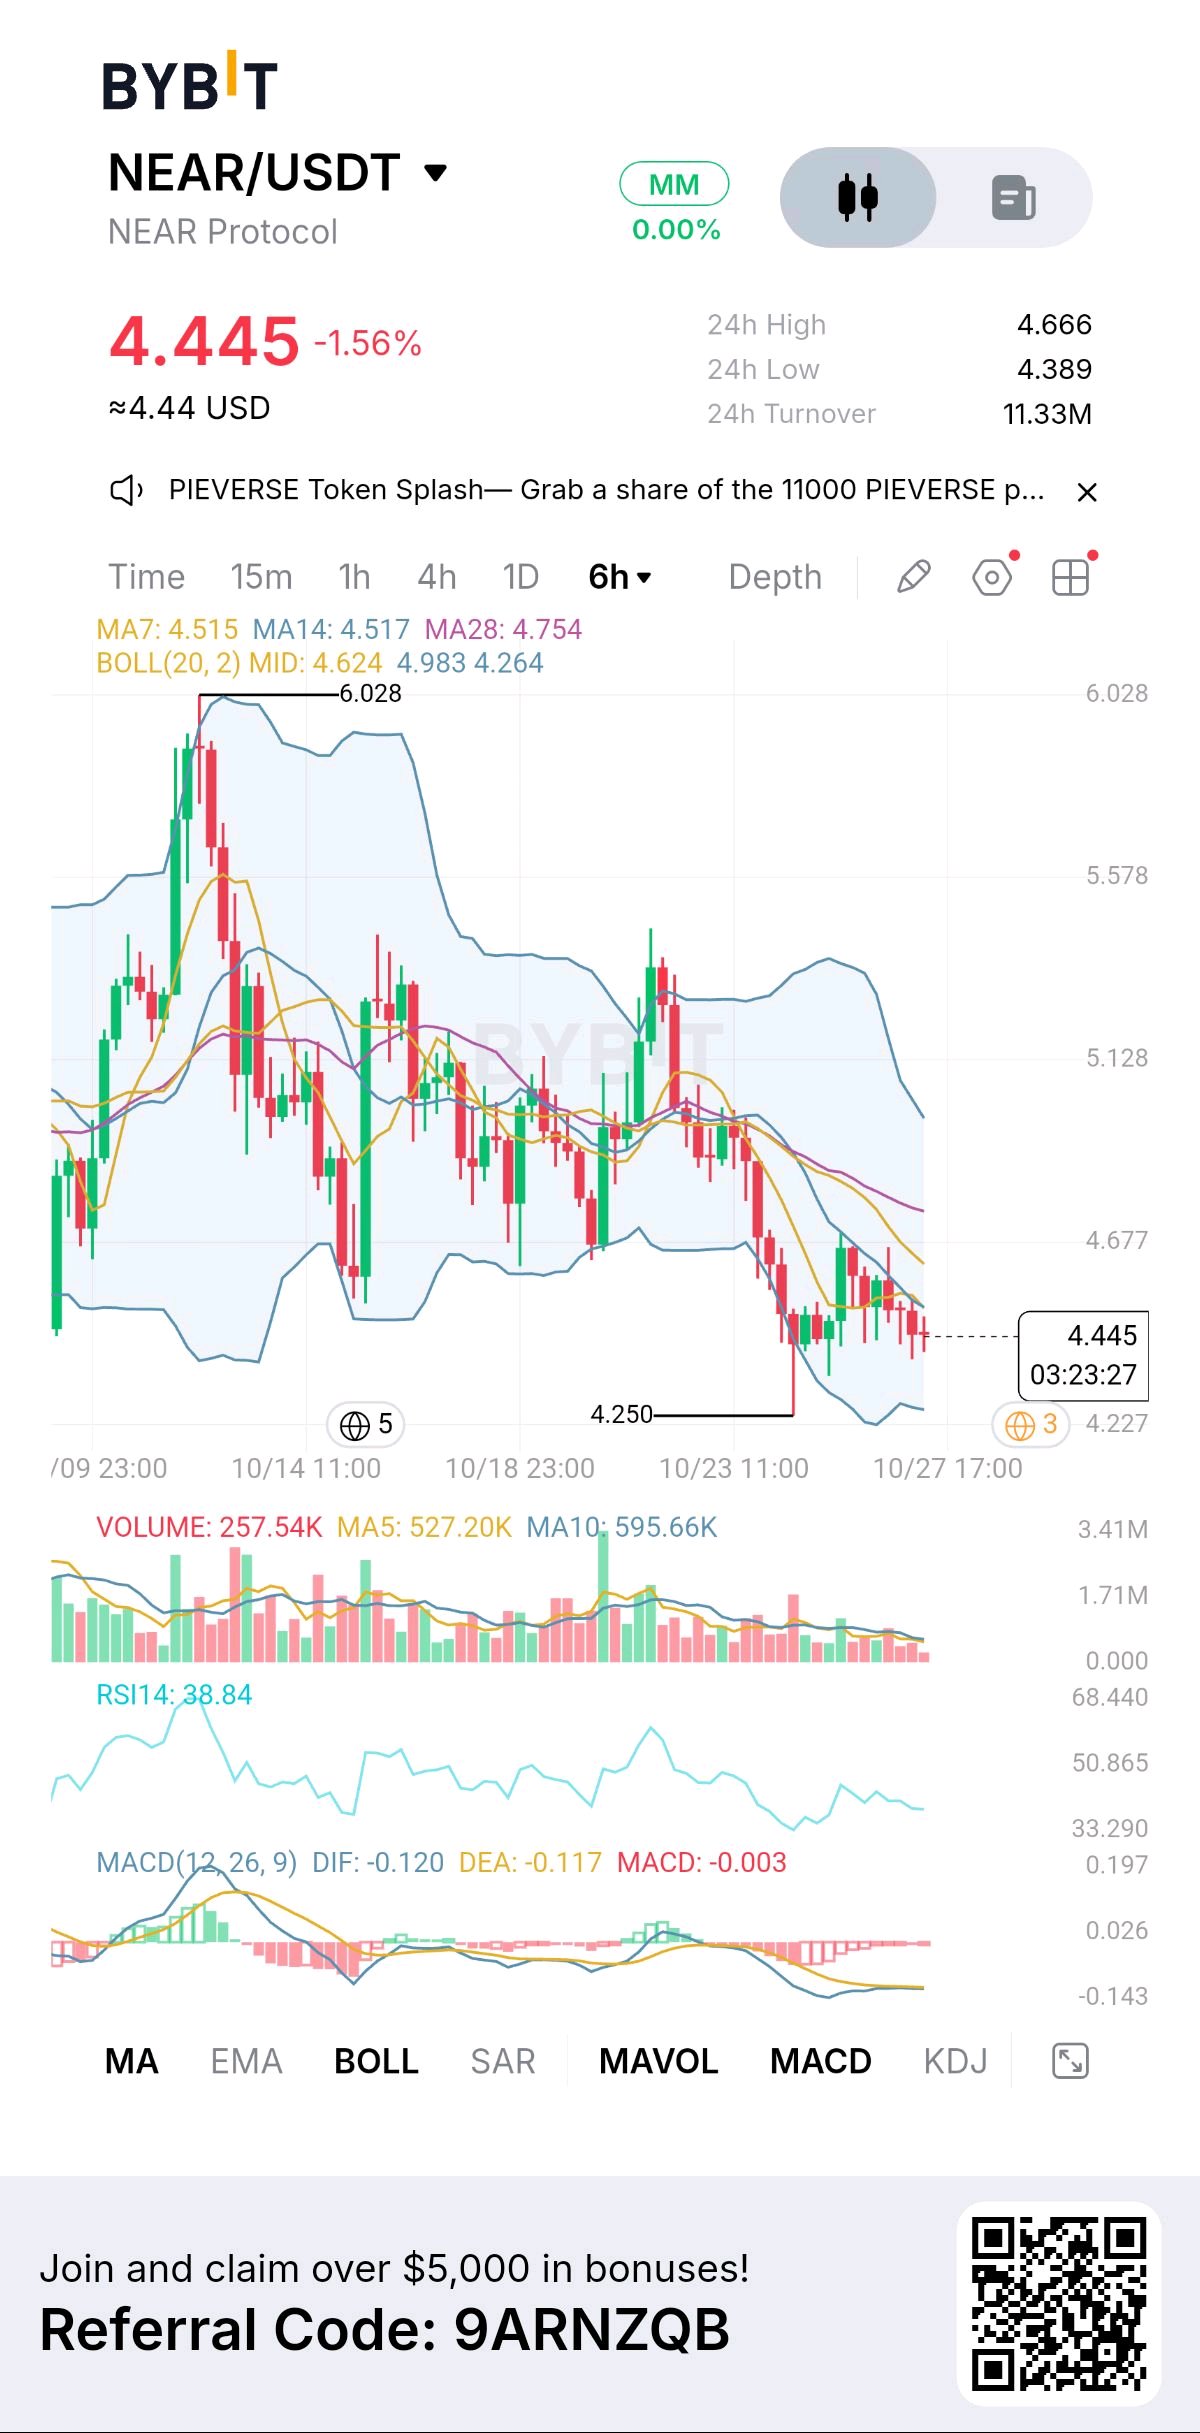
NEAR Protocol The Interesting Part Isn’t the Drop It’s What Price Does Near $4.25. What stands out to me is that NEAR has already suffered a substantial decline, yet the chart still hasn’t produced convincing evidence of a reversal. That creates an interesting conflict: price is approaching an area where buyers previously appeared, but momentum remains weak. A support level is only useful if buyers actually defend it. FACT / The uploaded Bybit chart shows NEAR/USDT at $4.445, down 1.56%, on the 6-hour timeframe. The visible 24-hour high is $4.666, the low is $4.389, and turnover is 11.33M. The chart marks a recent swing low around $4.250 and an earlier peak near $6.028. CURRENT MARKET DATA As of October 27, public trackers put NEAR around $4.45–$4.52, with market capitalization near $5.8–$5.9B, 24-hour volume roughly $500–550M and circulating supply around 1.31B NEAR. These figures fluctuate by exchange and timestamp, unlike the screenshot reading. FUNDAMENTALS NEAR is more than a conventional Layer-1 blockchain. Its focus includes scalable applications, chain abstraction and NEAR Intents, which facilitates cross-chain swaps and asset execution. The interesting question is whether growing product usage translates into durable demand for NEAR, rather than just impressive transaction statistics. TOKENOMICS The supply is effectively fully unlocked, with approximately 1.31B tokens circulating and no fixed maximum supply. NEAR's February 2026 tokenomics update halved maximum annual inflation and activated an Intents fee-sharing mechanism. Product revenue can support buybacks, but further buybacks depend on actual revenue and governance decisions; they are not guaranteed. MACRO + MARKET CONTEXT Bitcoin was hovering near $80,000 and ETH near $2,300 on October 26, while markets awaited the October 28 Federal Reserve decision. Rate expectations, inflation concerns and broader risk appetite could influence altcoin flows. Even strong project fundamentals can struggle when liquidity moves away from altcoins. CHART OBSERVATION The 6-hour structure remains bearish, with lower highs and sustained selling pressure from the $6.028 peak. NEAR is trading below its short- and medium-term moving averages, suggesting sellers still control the immediate trend. The $4.25 area is the key support to watch, while $4.52–$4.62 forms the first meaningful recovery zone. Above that, $4.75 and $4.98 are potential resistance areas. A bounce alone would not reverse the structure; buyers need to reclaim resistance and hold it on a retest. INDICATORS The displayed MA7 is $4.515, MA14 $4.517 and MA28 $4.754. Price is below all three, reinforcing the weak trend. Bollinger Bands show a middle line at $4.624 and a lower band at $4.264, putting price close to the lower boundary. RSI14 at 38.84 reflects bearish momentum but is not deeply oversold. MACD reads DIF -0.120, DEA -0.117 and histogram -0.003, indicating momentum remains slightly negative. Volume has faded compared with earlier activity, but that alone cannot confirm accumulation or a reversal. TRADING SCENARIOS Bullish: A 6-hour reclaim of $4.52–$4.62, followed by a successful retest, could offer an entry around $4.53–$4.60. SL: $4.38. TP1: $4.75; TP2: $4.98. The recovery would gain credibility if volume expands and RSI strengthens. Bearish: A decisive 6-hour close below $4.25, followed by a failed retest, could offer a short near $4.20–$4.25. SL: $4.42. TP1: $4.05; TP2: $3.85. A recovery above the broken support invalidates this setup. These are conditional scenarios, not confirmed signals. MY PERSONAL READ WHY THIS SETUP MATTERS I wouldn't chase NEAR here. The project has a more interesting economic story than a simple AI narrative, but the chart hasn't caught up with that thesis yet. I'm watching whether $4.25 holds and whether buyers can reclaim $4.62 with stronger volume. That gap between improving token economics and weak price structure is precisely what makes this setup worth watching. $NEARUSDT #IMPACTbyTrade #ByXIMPACT

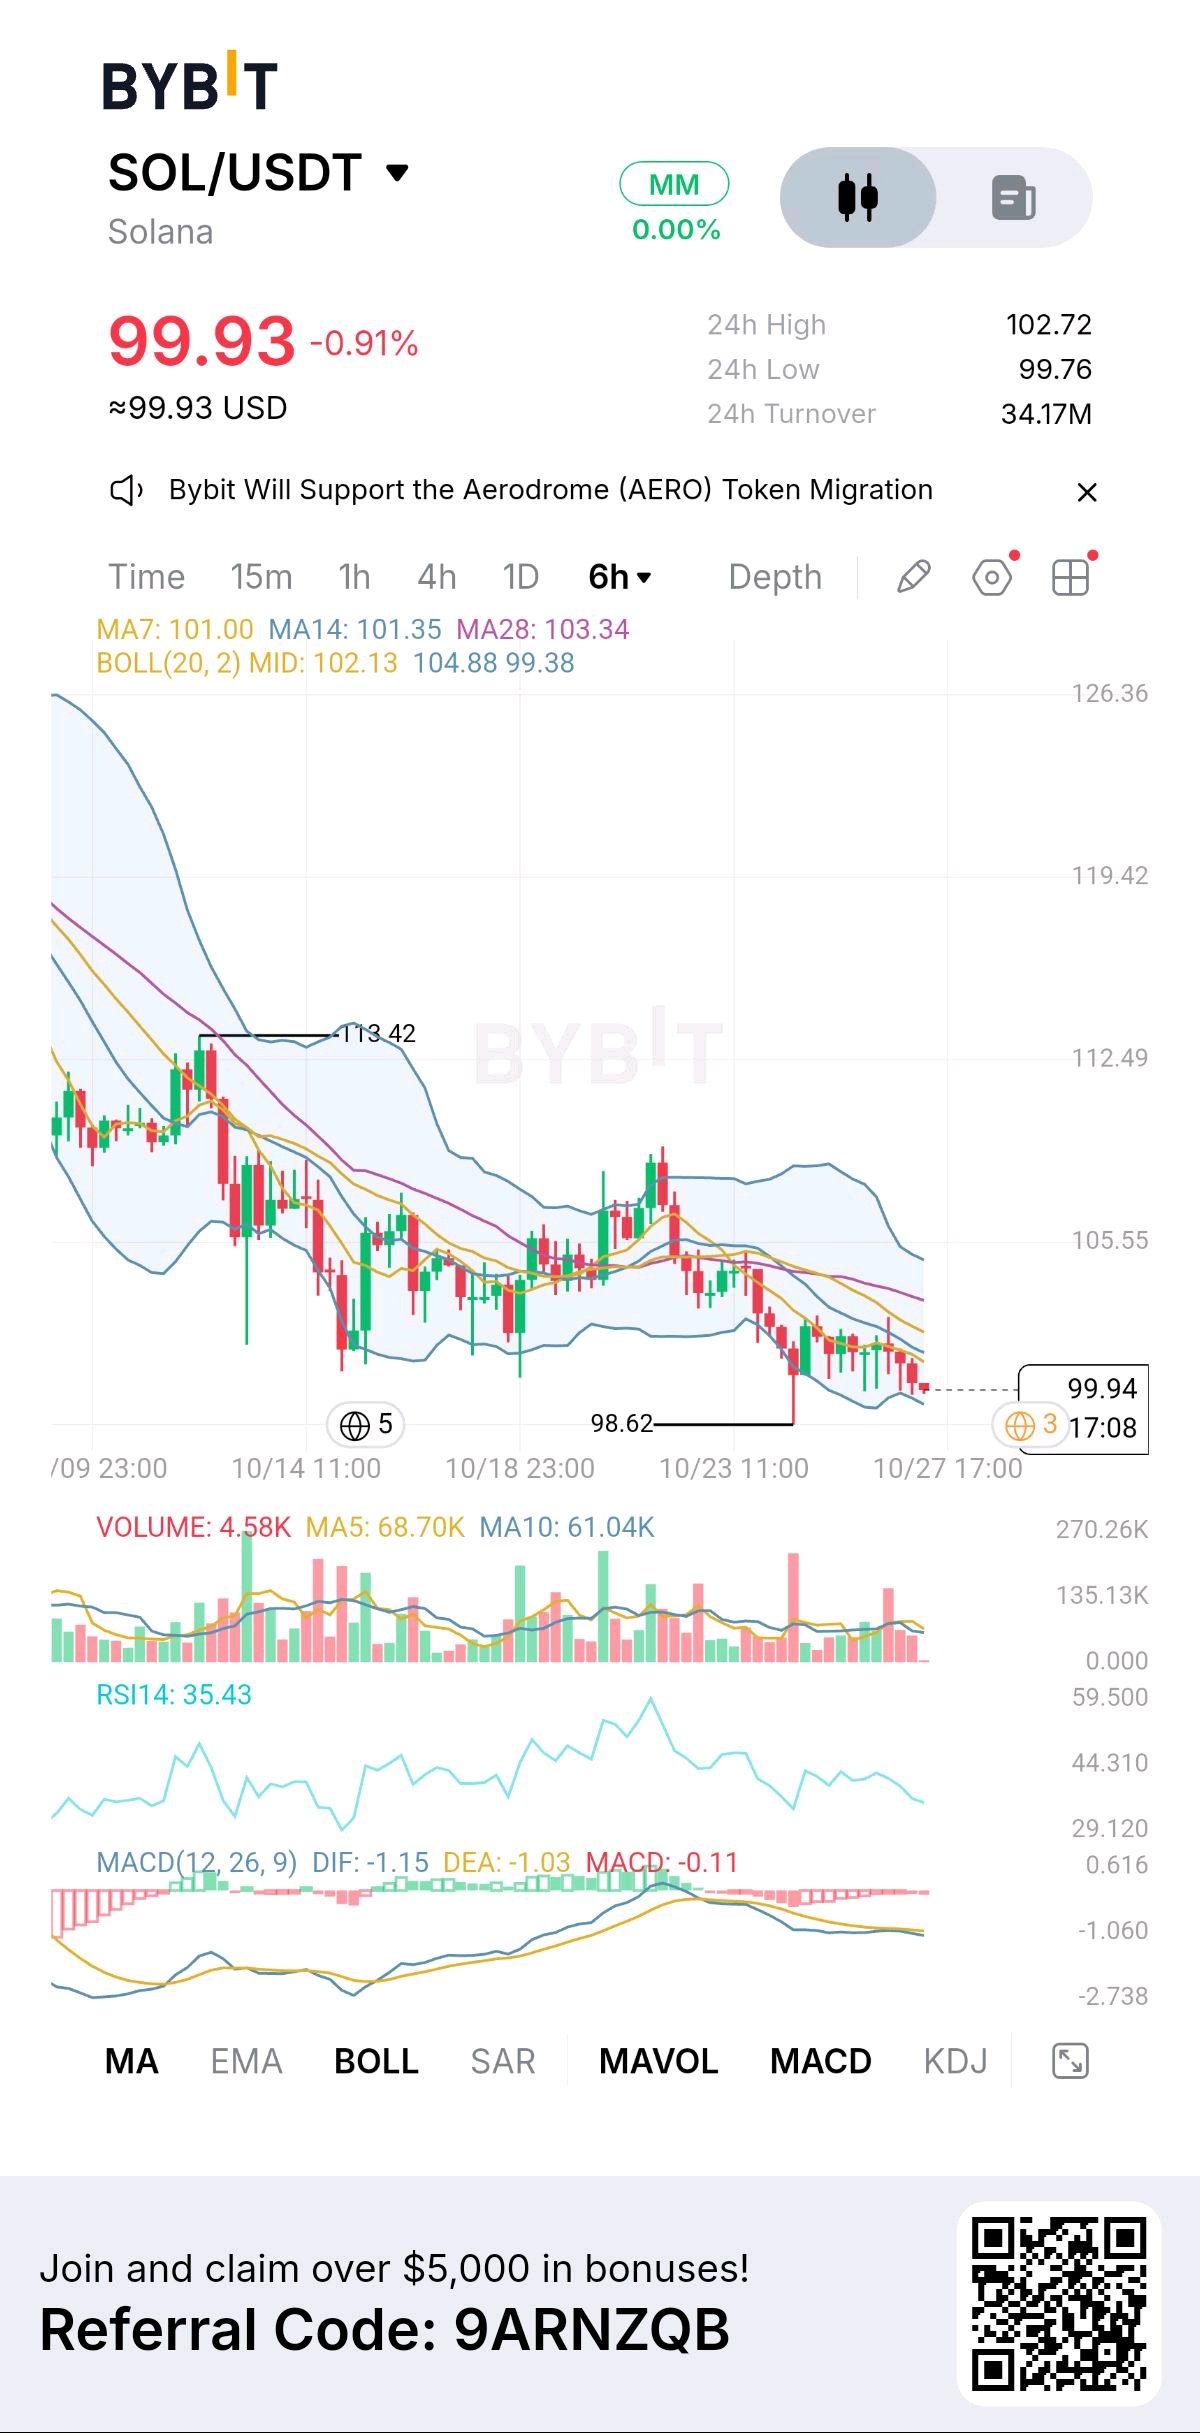
What catches my attention is the gap between Solana’s price weakness and its broader ecosystem potential. SOL is approaching the $100 psychological level, but the 6H chart shows sellers still controlling the short-term structure. The question is whether this area attracts real buying or simply becomes another pause before further downside. WHAT I'M SEEING ON THE CHART 888888 Bybit shows SOL/USDT at $99.93, down 0.91%, with a 24H high of $102.72, low of $99.76 and turnover of $34.17M. The chart marks a swing low at $98.62 and a previous high at $113.42. MA7 is $101.00, MA14 $101.35 and MA28 $103.34. RSI14 reads 35.43, MACD is -0.11, and the Bollinger midline is $102.13. CURRENT MARKET DATA: A separate market snapshot cited earlier placed SOL around $100.75, with market capitalization near $59.44B, 24H volume around $2.48B and circulating supply near 589.87M SOL. These figures are from a different observation time and should not be mistaken for live quotes. FUNDAMENTALS: Solana provides high-speed blockchain infrastructure for DeFi, stablecoins, payments, NFTs and tokenized assets. Low transaction costs and rapid settlement help attract users and developers. What matters for SOL is whether that activity generates sustained demand for network fees, staking and on-chain liquidity rather than temporary speculative interest. TOKENOMICS: SOL has no fixed maximum supply. Staking rewards introduce new tokens, while 50% of base transaction fees are burned. Its inflation schedule declines toward a long-term 1.5% target. The balance between new issuance, fee burns and staking participation influences supply dynamics, although market demand remains a major price driver. MACRO + MARKET CONTEXT: Bitcoin’s direction, global liquidity and expectations around Federal Reserve policy can influence altcoin performance. When traders reduce risk exposure, SOL can weaken even while network activity remains healthy. A recovery supported by improving market sentiment would carry more weight than an isolated bounce. CHART OBSERVATION: The 6H structure shows lower highs and lower lows following rejection near $113.42. Price remains below all three moving averages, creating resistance around $101–$103.34. The $98.62 swing low is the immediate structural floor. A clean break could expose lower support, while a sustained reclaim of $103.34 would suggest the selling sequence is losing control. INDICATORS: RSI14 at 35.43 reflects weak momentum and proximity to oversold territory, but does not confirm a bottom. MACD remains negative at -0.11, supporting the bearish short-term reading. Price is pressing toward the lower Bollinger region, where volatility can produce sharp reactions. Rising buying volume and improving momentum would strengthen a recovery signal. BULLISH SCENARIO: Trigger: a 6H close above $102.72 with stronger volume. Entry: $102.00–$102.70 after confirmation. SL: $99.40. TP1: $105.50. TP2: $108.00. Invalidation: sustained weakness below $98.62. BEARISH SCENARIO: Trigger: a decisive 6H close below $98.62. Entry: $98.30–$98.60 after a failed retest. SL: $100.20. TP1: $96.00. TP2: $93.50. Invalidation: a sustained reclaim above $102.72. MY PERSONAL INTERPRETATION WHY THIS SETUP MATTERS: I see SOL at a decision point where its long-term ecosystem story is meeting immediate selling pressure. I would consider a recovery only after buyers reclaim resistance and demonstrate conviction; a breakdown below $98.62 would make me reassess the downside risk. This setup matters because it can reveal whether market participants are willing to accumulate SOL near a major psychological level or whether broader risk reduction still dominates. The reaction here may provide a clearer signal than the price level alone. $SOLUSDT #IMPACTbyTrade

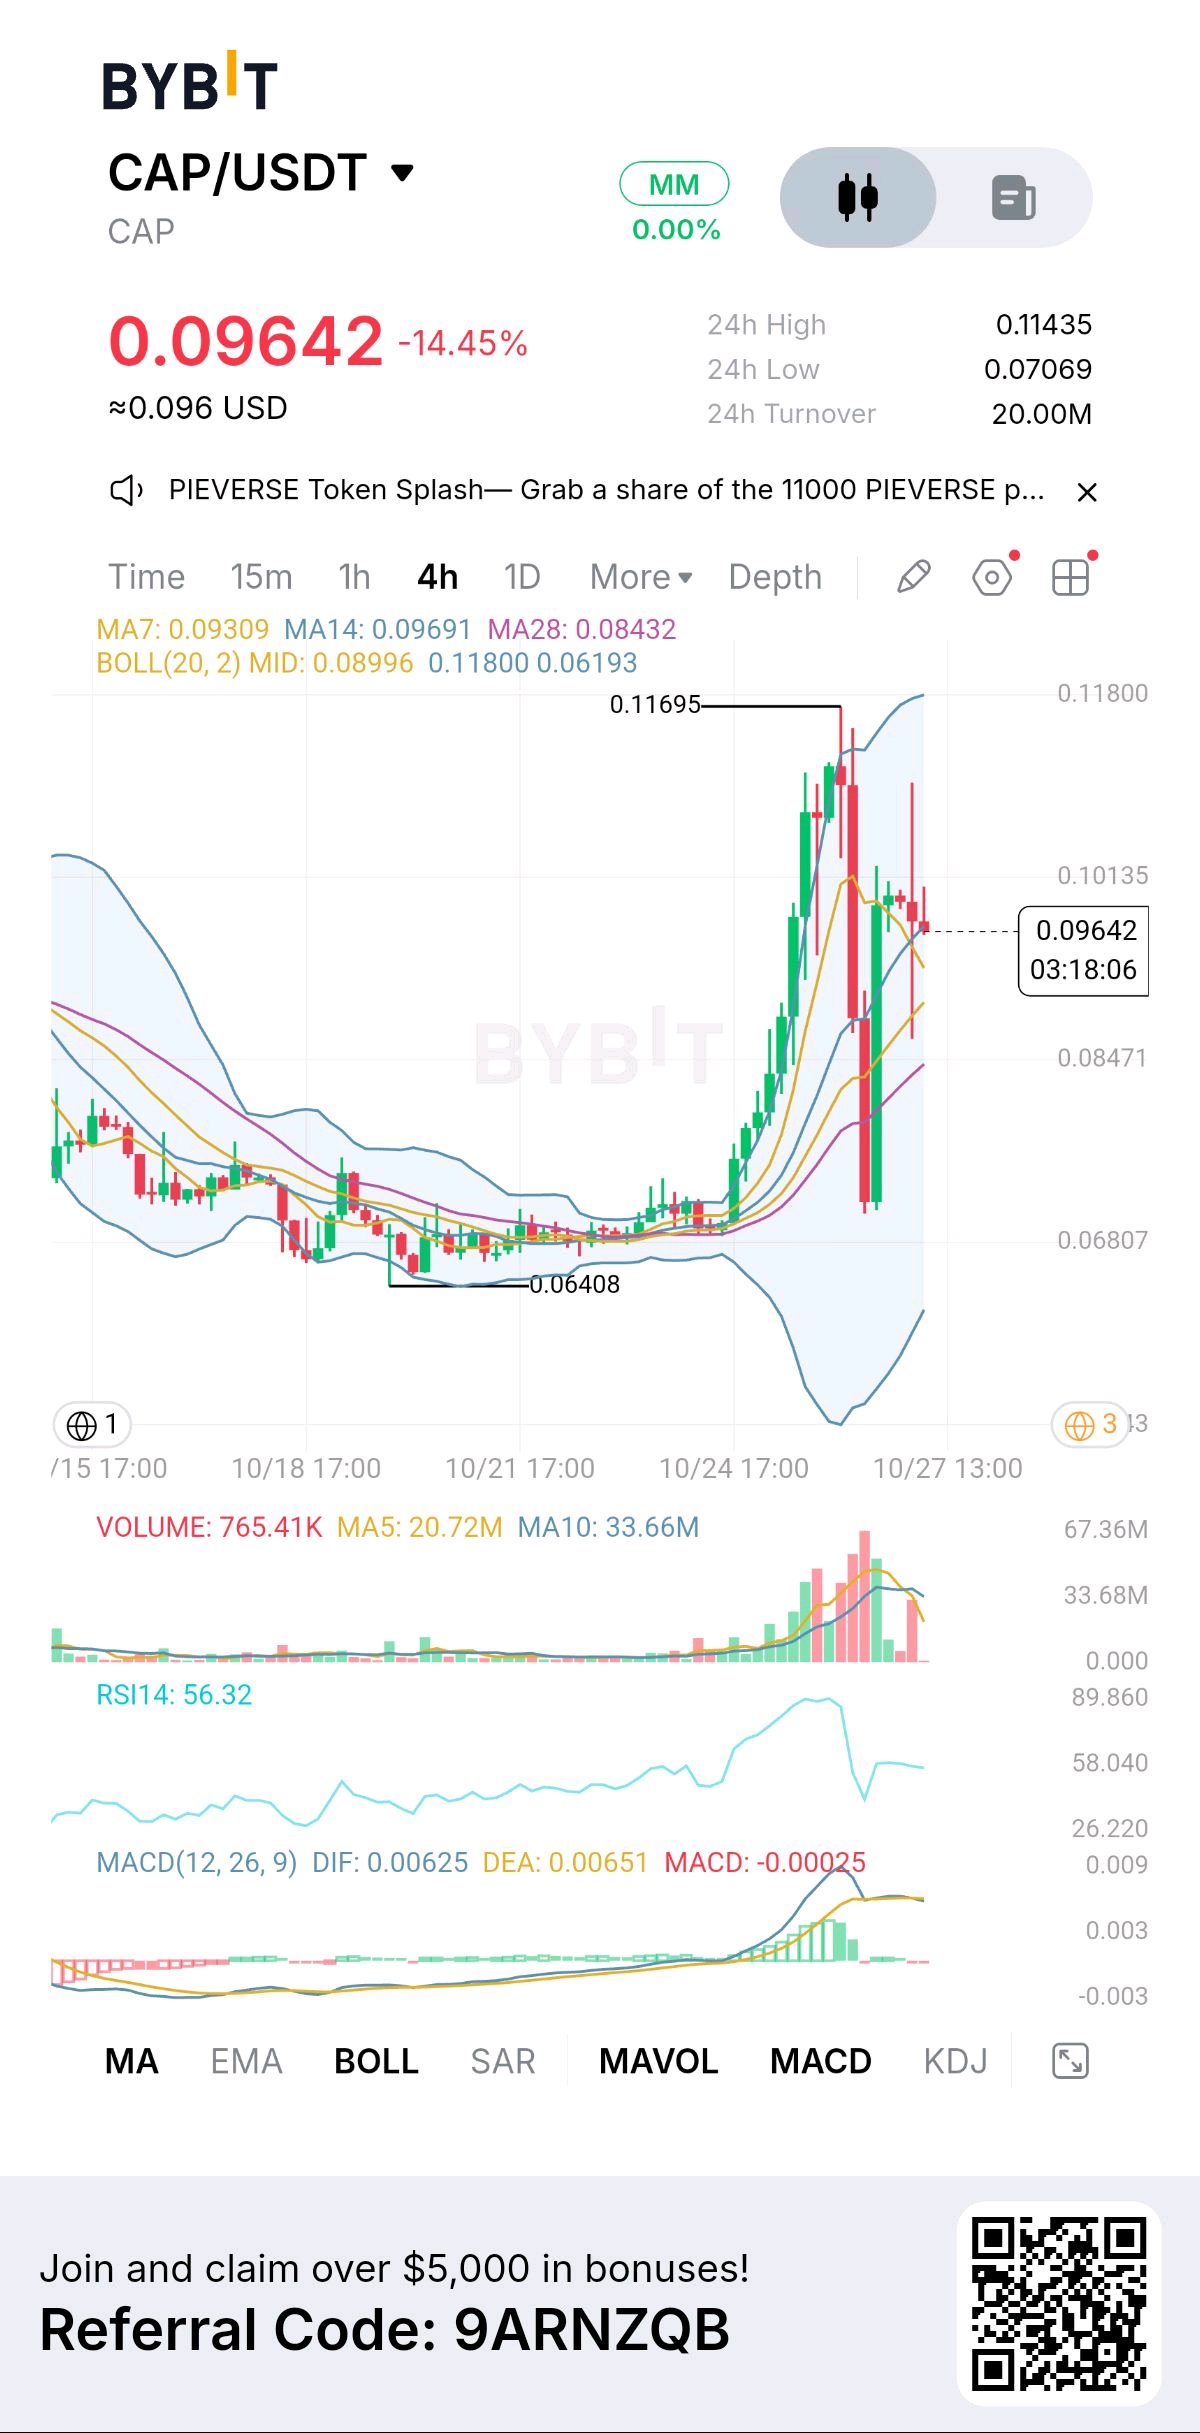
What stands out to me is that CAP has rallied from $0.06408 to $0.11695, yet the market is testing whether buyers can defend the breakout. The 4H chart shows a sharp correction after an aggressive move, and the next reaction around support could reveal whether this is a healthy pullback or a deeper reversal. WHAT I'M SEEING ON THE CHART CAP/USDT is trading at $0.09642, down 14.45%, with a displayed 24H high of $0.11435, low of $0.07069 and turnover of $20M. MA7 is $0.09309, MA14 is $0.09691 and MA28 is $0.08432. RSI14 reads 56.32, while MACD is slightly negative at -0.00025. The Bollinger midline is $0.08996, upper band $0.11800 and lower band $0.06193. These values come directly from the screenshot. CURRENT MARKET DATA: The screenshot is a snapshot, not a live feed. Current price, market cap, volume, circulating supply, recent performance, announcements and token unlock schedules require independent verification. I would distinguish verified figures from older chart data rather than build a thesis on outdated numbers. FUNDAMENTALS: Cap focuses on institutional credit infrastructure, including cUSD and yield-bearing stcUSD. Its broader thesis connects dollar liquidity with credit opportunities backed by financial guarantees. The opportunity lies in bringing structured credit activity on-chain. However, actual deposits, lending activity, borrower demand and sustainable revenue matter more than narrative alone. TOKENOMICS: Total supply, circulating supply, vesting, team allocations and upcoming unlocks can influence selling pressure. Staking incentives may encourage holding, but emissions can dilute existing positions. I would investigate whether protocol revenue, buybacks or other mechanisms create direct value for CAP holders. Ecosystem growth does not automatically strengthen token price. MACRO + MARKET CONTEXT: CAP remains exposed to Bitcoin's direction, crypto liquidity and risk appetite. When BTC weakens, smaller tokens can experience sharper corrections as traders reduce exposure. Interest rates, dollar strength and liquidity conditions also affect speculative assets. A promising narrative cannot guarantee outperformance during a broader downturn. CHART OBSERVATION: The chart shows consolidation around $0.068–$0.070 before a powerful breakout. Rising volume confirms increased participation during the rally. However, rejection near $0.117 and the subsequent sell-off show sellers becoming active at higher prices. Price is above MA7 and MA28 but slightly below MA14, leaving the short-term structure mixed. The $0.090–$0.093 zone is initial support, while $0.101–$0.103 is resistance bulls need to reclaim. INDICATORS: RSI at 56.32 remains above 50, suggesting momentum has not completely turned bearish. However, MACD at -0.00025 indicates weakening short-term momentum. Widening Bollinger Bands reflect elevated volatility. I would watch whether price stabilizes near the middle band or moves toward lower support. Volume confirmation matters because a low-volume bounce may not reverse the correction. BULLISH SCENARIO: I would look for a strong 4H close above $0.103 with increasing volume. A possible entry is $0.101–$0.103 after confirmation, with a stop-loss at $0.094. TP1 is $0.110 and TP2 is $0.116–$0.117, where previous selling pressure appeared. A sustained breakdown below $0.094 invalidates this setup. BEARISH SCENARIO: If price fails around $0.100–$0.103 and breaks below $0.093, downside momentum could increase. A conditional entry zone is $0.092–$0.093, with a stop-loss at $0.102. TP1 is $0.090 and TP2 is $0.085. A sustained reclaim above $0.103 would weaken the bearish thesis. These are scenario levels, not guaranteed outcomes. MY PERSONAL INTERPRETATION — WHY THIS SETUP MATTERS: I wouldn't chase CAP after an aggressive rally followed by a sharp correction. I want buyers to defend $0.090–$0.093, reclaim resistance and confirm commitment through volume before considering a long position. This setup is interesting because a potentially useful credit-infrastructure narrative must contend with profit-taking, volatility and future token supply. If buyers regain control, the correction could become a continuation opportunity. If support fails, the previous rally offers no guarantee of protection. Confirmation and risk management matter more than predicting the next candle. Educational analysis only not financial advice. $CAPUSDT #IMPACTbyTrade

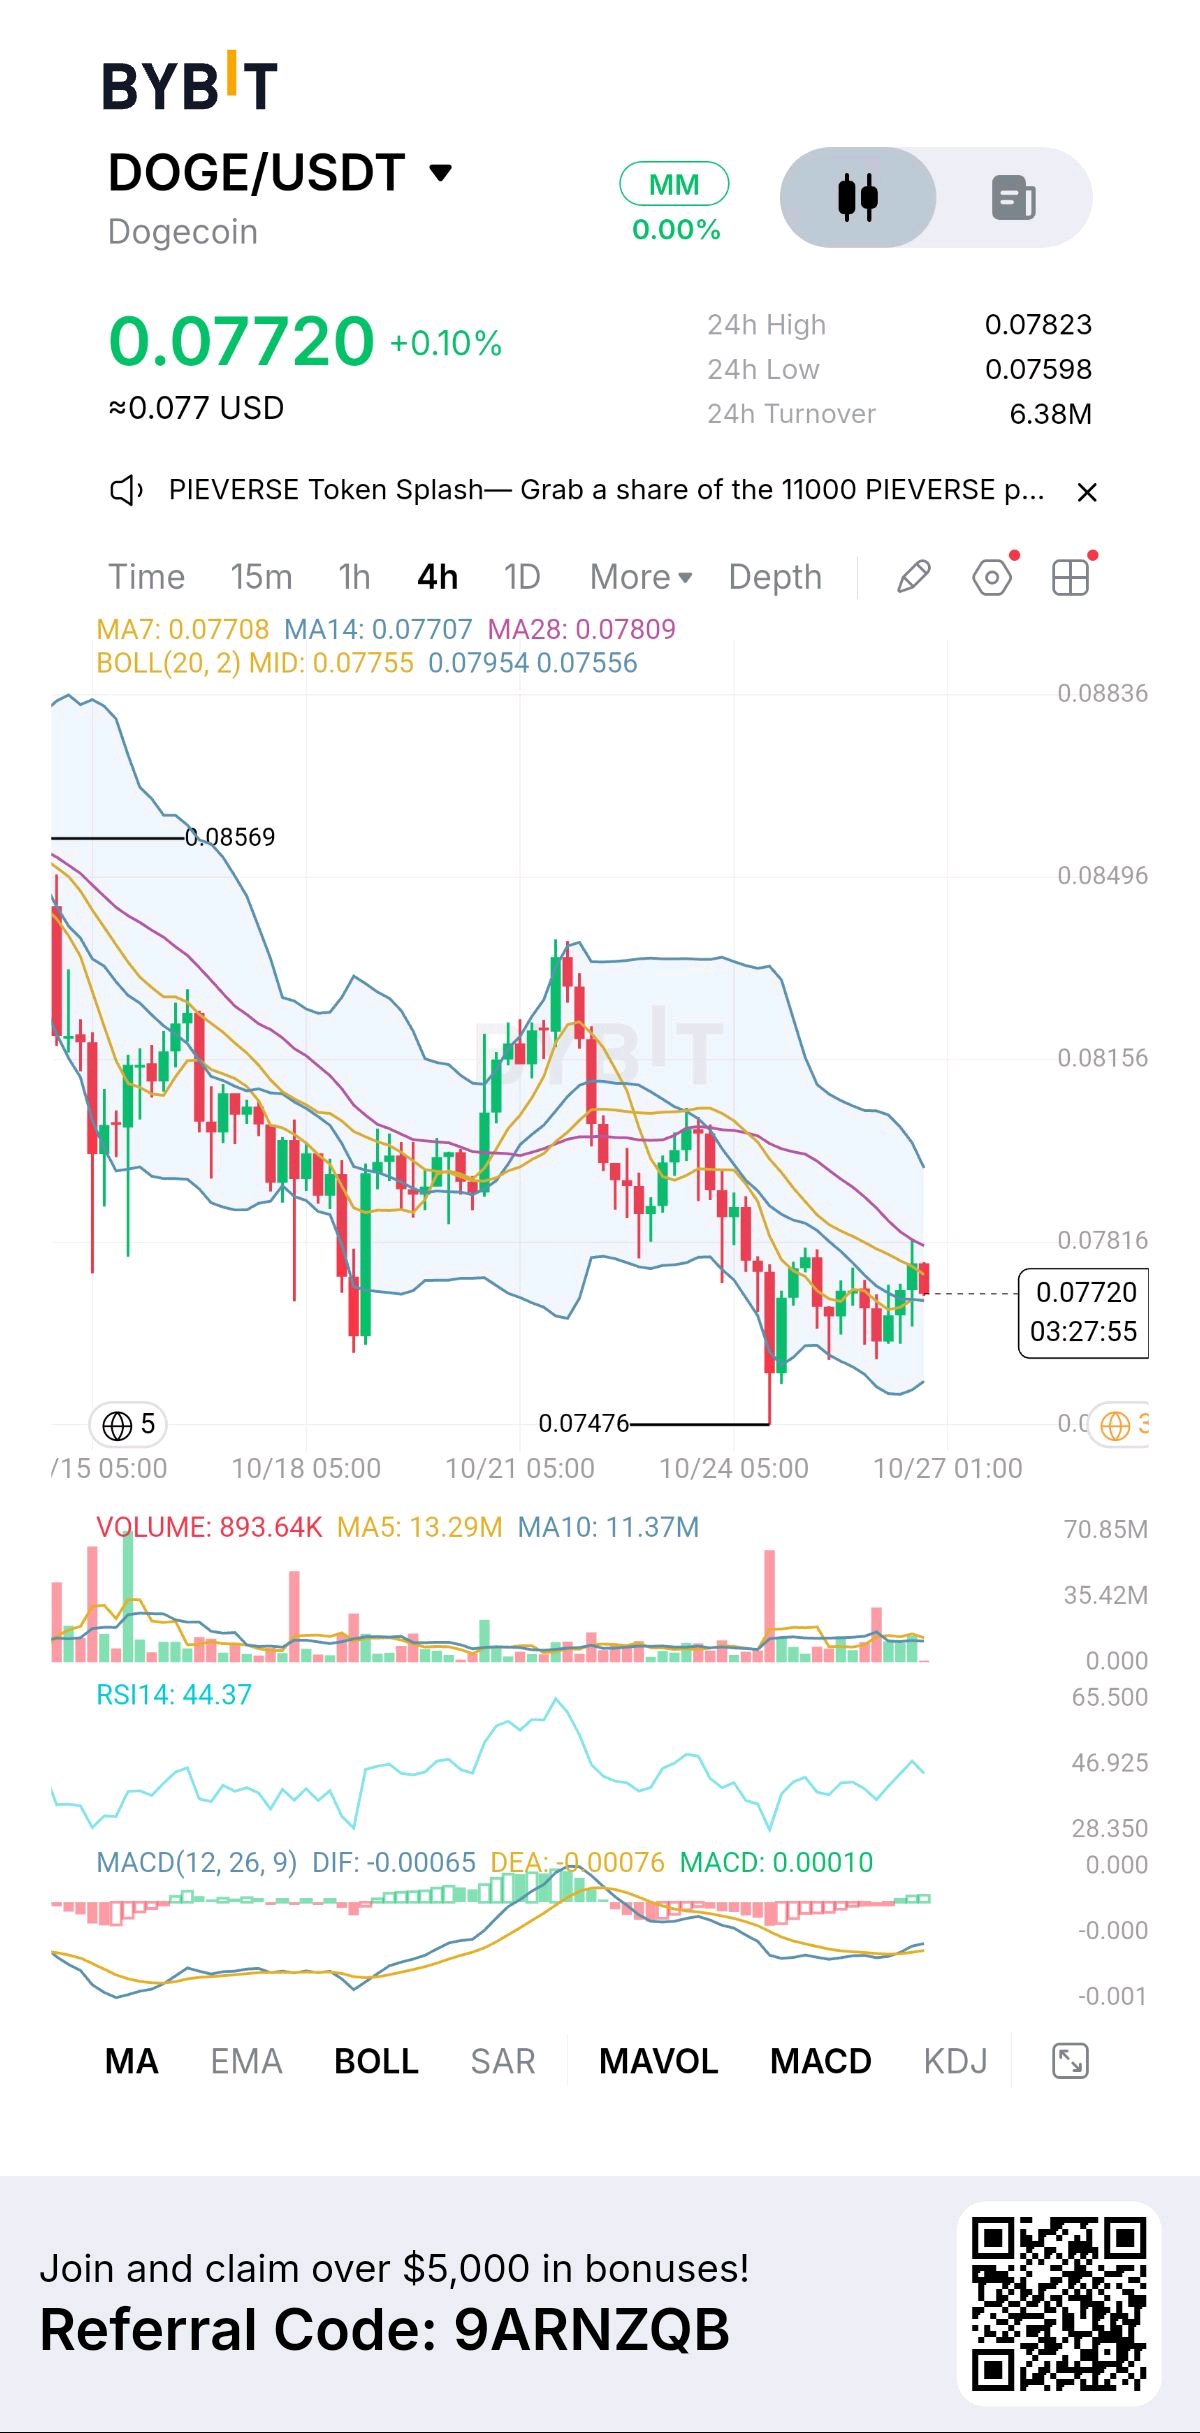
DOGE is showing early signs of a momentum recovery, but its 4H trend has not fully turned bullish. MACD has crossed into positive histogram territory while price remains below the longer moving average. This is where I start watching closely: is selling pressure fading enough for a reversal, or is this just another bounce inside a downtrend? FACT Bybit DOGE/USDT is trading at $0.07720, up 0.10%, with a 24H high of $0.07823 and low of $0.07598. The chart marks a swing low at $0.07476 and an earlier high at $0.08569. Volume reads 893.64K, while MA5 and MA10 volume averages are 13.29M and 11.37M. Current Market Data — CoinGecko’s latest available snapshot shows DOGE near $0.07671, around $12B market cap, roughly $378M in 24H volume and approximately 156.46B DOGE circulating. Its reported seven-day performance is around -3.5%. These market-wide figures differ from the Bybit screenshot because prices, trading pairs and update times vary. 【turn445183search0】 Fundamentals — Dogecoin remains a proof-of-work payment coin supported by a large community and broad exchange liquidity. A recent development is Dogecoin Labs, bringing MyDoge, DogeOS and Such App together to expand wallet access, merchant payments and applications. MyDoge reports over 500,000 users, but DogeOS is still developing its ecosystem, so adoption must be measured by actual usage, not announcements alone. 【turn445183search1】 Tokenomics — DOGE has no fixed maximum supply. Mining adds approximately 5B new coins annually, creating ongoing inflationary supply. Unlike ETH, DOGE has no staking yield or routine protocol-level burn mechanism. That means sustained demand, payment usage and investor interest must absorb new issuance over time. Macro + Market — The October 27–28 Fed meeting is an important volatility risk. Rate expectations, dollar strength and BTC’s direction can influence speculative assets like DOGE, which often responds strongly to shifts in risk appetite. 【turn417477news6】 Chart + Indicators — MA7 at $0.07708 and MA14 at $0.07707 are close to price, but MA28 at $0.07809 remains overhead resistance. Bollinger mid-band is $0.07755, with the upper band at $0.07954 and lower band at $0.07556. RSI14 at 44.37 shows improving but still weak momentum. MACD DIF at -0.00065 is above DEA at -0.00076, and its +0.00010 histogram suggests bearish momentum is easing. However, volume is below its displayed averages, so the recovery lacks strong confirmation. Support sits at $0.07598 and $0.07476; resistance lies around $0.07823 and $0.07954. Bullish Scenario — Trigger: a 4H close above $0.07823, followed by a successful retest with stronger volume. Entry: $0.0782–$0.0786. SL: $0.0768. TP1: $0.07954; TP2: $0.0815. Losing the reclaimed breakout level invalidates the setup. Bearish Scenario — Trigger: a decisive 4H break below $0.07598 and failed reclaim. Entry: $0.0757–$0.0760. SL: $0.0772. TP1: $0.07476; TP2: $0.0735. Reclaiming $0.07755 would weaken the bearish case. Personal Interpretation — I wouldn’t chase this bounce yet. I want to see DOGE reclaim $0.07823 with meaningful participation, or wait for a confirmed support breakdown rather than guessing. Why This Setup Matters — DOGE is approaching a decision zone where momentum could improve before the broader structure changes. A reclaim would suggest buyers are finally absorbing supply; rejection could expose the recent low again. The key is confirmation, because a positive MACD histogram alone does not establish a new uptrend. $DOGEUSDT #IMPACTbyTrade

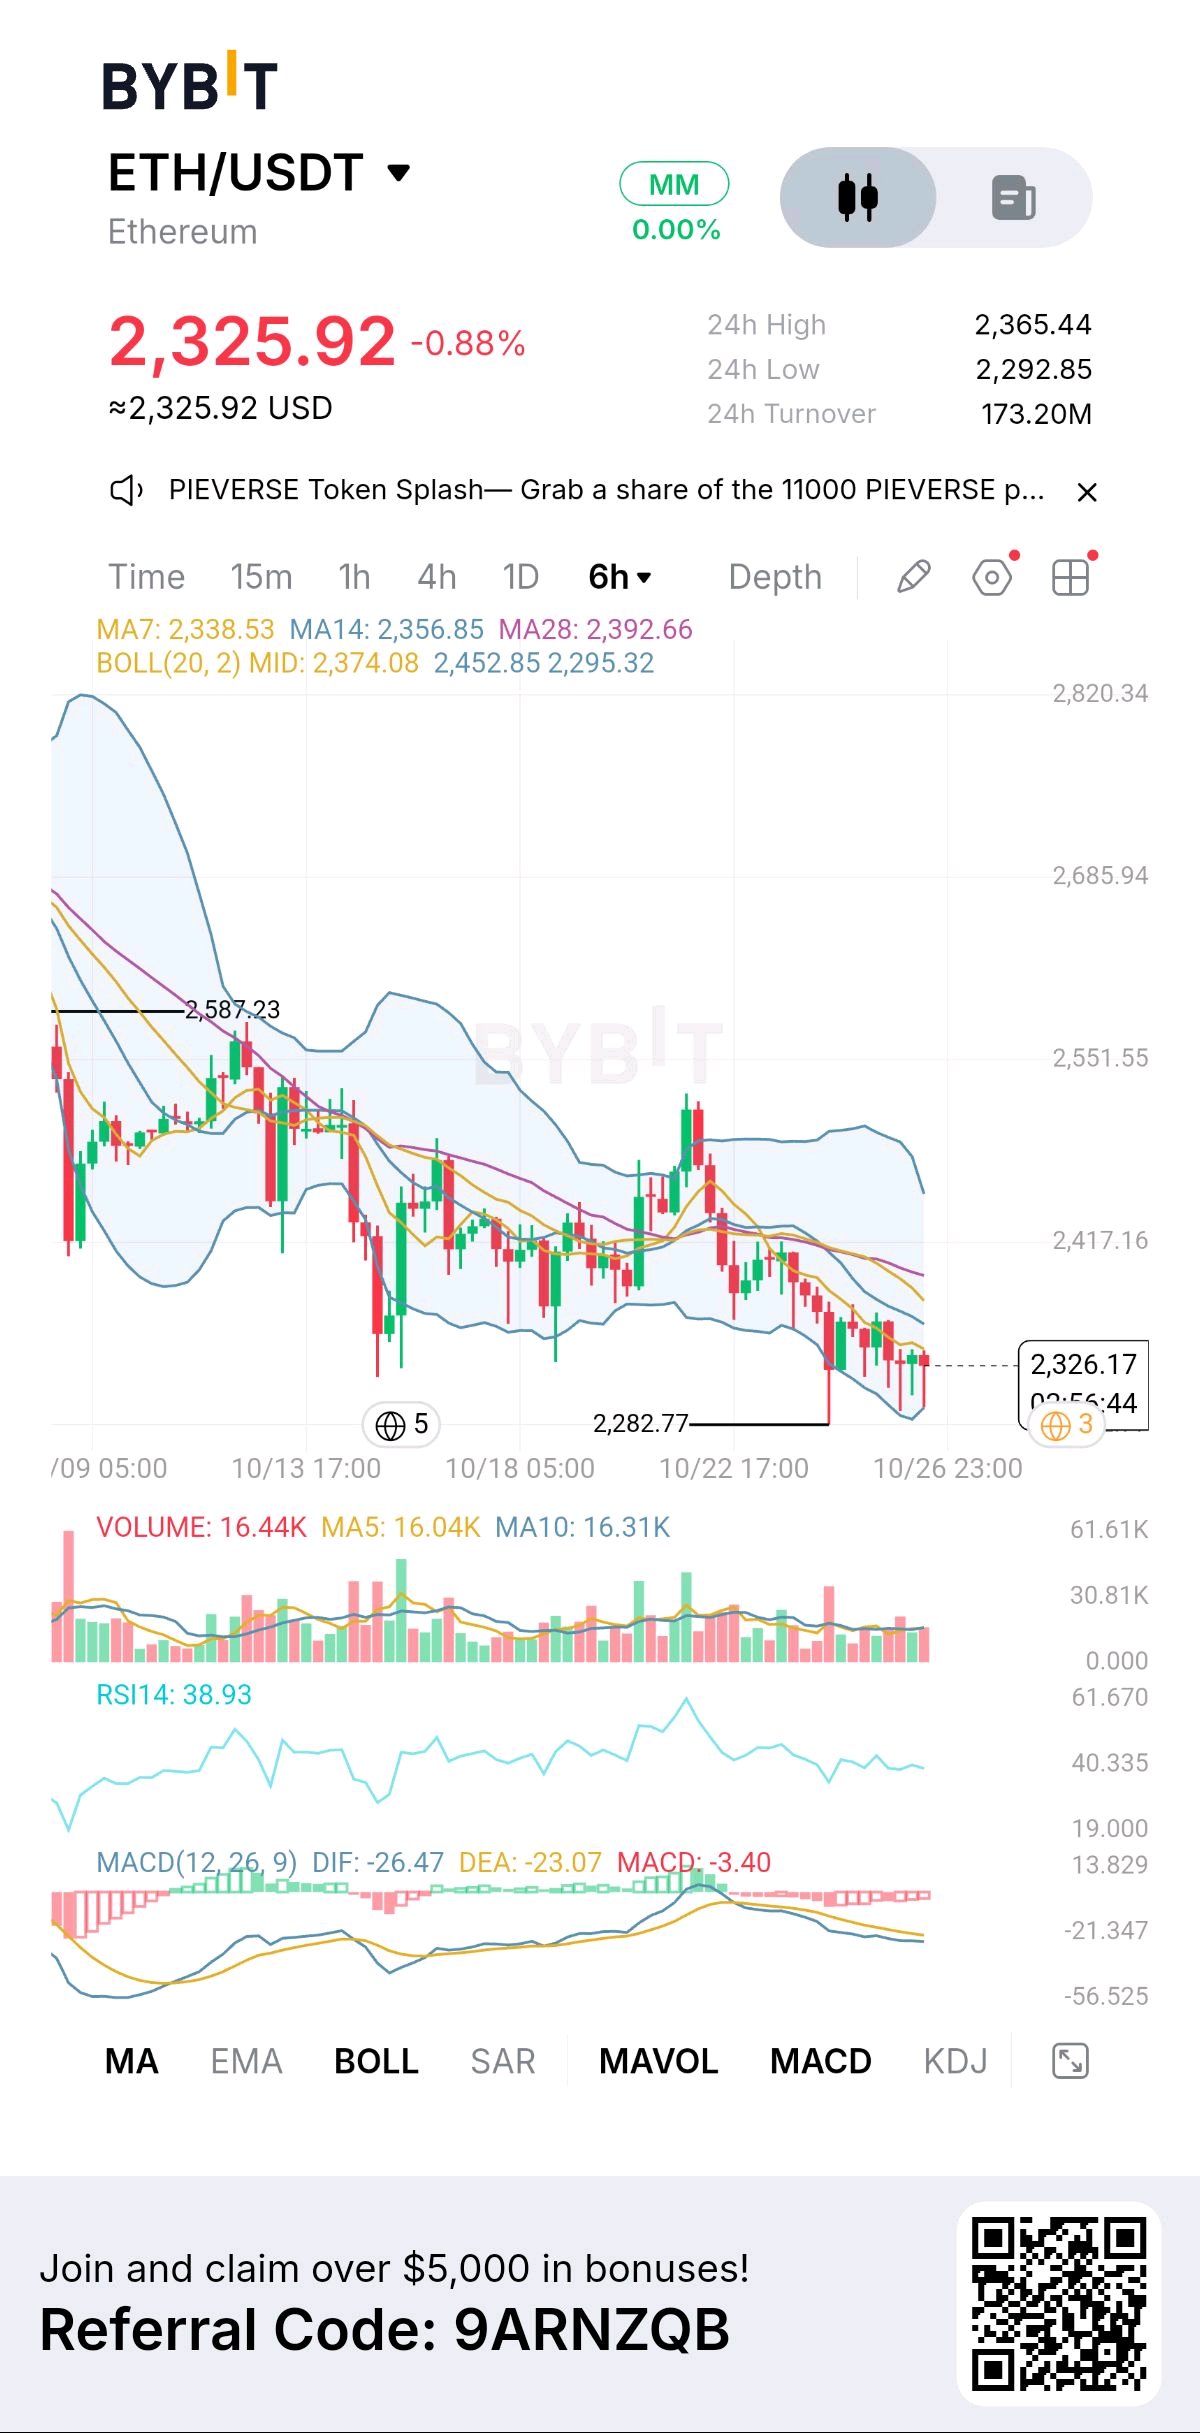
ETH is holding above $2,300, but the 6H chart still favours sellers. Price is sitting below every moving average, while MACD remains negative. The interesting part? RSI is weak, but not deeply oversold, meaning another leg down is still possible before buyers regain control. The Data Behind This Move ETH/USDT is at $2,325.92, down 0.88%, with a 24H high of $2,365.44 and low of $2,292.85. The marked swing low is $2,282.77. Volume reads 16.44K, slightly above MA5 at 16.04K and MA10 at 16.31K. Current Market Data — ETH is trading around $2,326 on October 26, with market cap near $285B, 24H market-wide volume around $8B and circulating supply around 122.16M ETH. These figures vary by provider and update time; the screenshot reflects Bybit’s specific market. ETH has also remained under pressure over the past week. Fundamentals — Ethereum remains a major smart-contract network powering DeFi, stablecoins, tokenized assets and staking. Institutional settlement activity and network upgrades support its long-term relevance, but adoption alone does not guarantee short-term price recovery. Tokenomics — ETH has no fixed maximum supply. Staking issues rewards to validators, while EIP-1559 burns part of transaction fees. The net supply change depends on issuance versus network activity and fee burning. Staking can reduce immediately liquid supply, but it does not create a guaranteed price floor. Macro + Market — The October 27–28 FOMC meeting is a key risk event. Rate expectations, dollar strength and Bitcoin’s direction could influence ETH’s next move. Even strong Ethereum-specific news may struggle to lift price if broader risk appetite weakens. Chart + Indicators — MA7 at $2,338.53, MA14 at $2,356.85 and MA28 at $2,392.66 all sit above price, creating layered resistance. Bollinger mid-band is $2,374.08, upper band $2,452.85 and lower band $2,295.32. RSI14 at 38.93 shows weak momentum, not a confirmed reversal. MACD DIF at -26.47 remains below DEA at -23.07, with a -3.40 histogram. Sellers still have the advantage unless price reclaims resistance. Bullish Scenario — Trigger: reclaim $2,356–$2,374 and hold on a 6H close. Entry zone: $2,357–$2,370 after confirmation. SL: $2,325. TP1: $2,392; TP2: $2,420. Failure to hold the reclaim weakens the setup. Bearish Scenario — Trigger: lose $2,282.77 on a decisive 6H close. Entry zone: $2,278–$2,285 after confirmation. SL: $2,315. TP1: $2,250; TP2: $2,220. These lower targets are projected zones, not screenshot levels. Personal Interpretation — I wouldn’t buy just because ETH is near support. I want to see a clear reclaim with stronger momentum, or a confirmed breakdown before considering a short. Why This Setup Matters — The $2,282.77 low is the key line separating a potential support bounce from fresh downside. Until ETH reclaims its moving averages, rallies may face selling pressure. Patience matters more than predicting the next candle. $ETHUSDT #IMPACTbyTrade

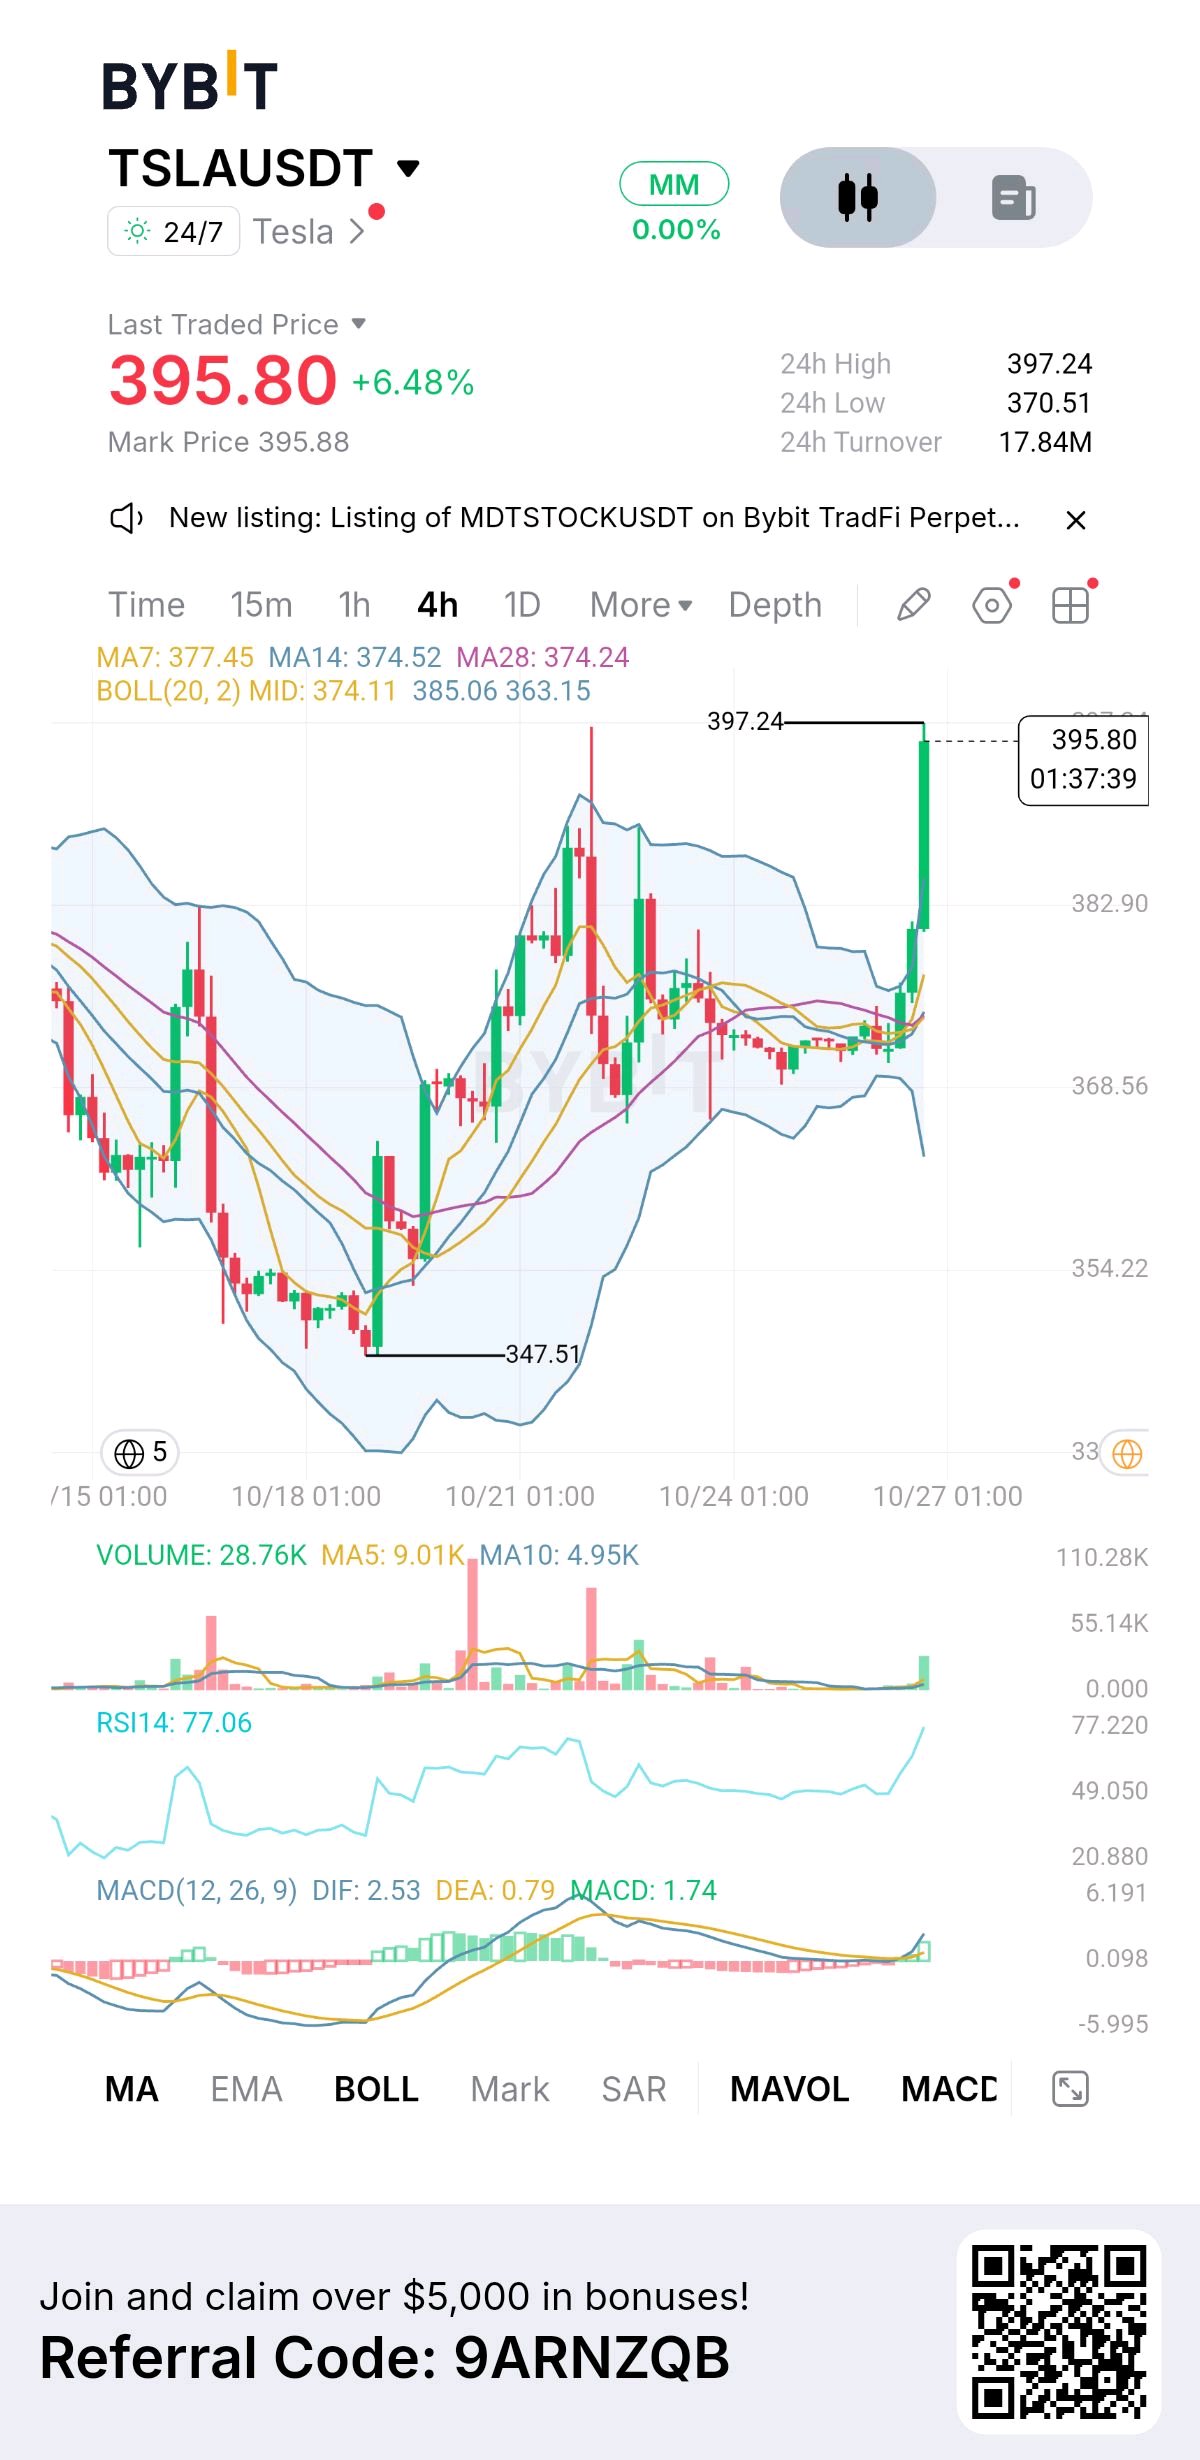
TSLA has surged 6.48% on the 4H chart, pushing above its entire moving-average cluster and the upper Bollinger Band. Momentum clearly favours buyers, but RSI is already above 77. The real question is whether this breakout can hold or whether late buyers are entering just as the rally needs a cooldown. WHAT I'M SEEING ON THE CHART — The Bybit TSLAUSDT chart shows $395.80, with a 24H high of $397.24 and low of $370.51. Price has rebounded from the marked $347.51 swing low. MA7 is $377.45, MA14 $374.52 and MA28 $374.24. Bollinger levels are $385.06 upper, $374.11 middle and $363.15 lower. RSI14 reads 77.06, while MACD DIF is 2.53, DEA 0.79 and histogram 1.74. Volume is 28.76K, above MA5 at 9.01K and MA10 at 4.95K. Current Market Data — Tesla’s underlying Nasdaq shares traded around $386 during October 26, while the screenshot’s Bybit perpetual is near $395.80. These are different instruments and prices can diverge. Tesla’s market value is approximately $1.47T. Its latest reported Q3 2026 results showed revenue near $28B, while net income fell 44% year over year to around $787M despite adjusted earnings beating expectations. Fundamentals — Tesla’s valuation reflects more than vehicle sales. Investors are also watching energy storage, autonomous driving, robotaxis and robotics. Q3 deliveries reached 486,532 vehicles, and energy-storage deployments were 13.7 GWh. The opportunity is substantial, but execution, margins and converting future-facing projects into durable profits remain important risks. Tokenomics — TSLA is an equity, not a cryptocurrency, so there are no crypto-style token unlocks, burns or staking rewards. TSLAUSDT on Bybit is a USDT-settled perpetual derivative, not direct ownership of Tesla shares. Funding costs, leverage and differences from the underlying stock can affect results. Macro + Market — The October 27–28 FOMC meeting could influence rate expectations and sentiment toward high-valuation growth stocks. A more hawkish outlook could pressure valuations, while a friendlier rate outlook may support risk appetite. Tesla’s move should therefore be judged alongside broader market conditions, not in isolation. Chart + Indicators — Price is above all three moving averages, showing a strong short-term bullish shift. MACD is positive, with DIF above DEA, confirming upward momentum. Volume is well above its short-term averages, suggesting increased participation. However, RSI at 77.06 signals stretched momentum, and price has broken above the $385.06 upper Bollinger Band. That can happen during strong trends, but it also raises the risk of a pullback. Watch $397.24 as immediate resistance, $385 as the first key reclaim/hold area, and $377–$374 as the moving-average support cluster. Bullish Scenario — A 4H close above $397.24 followed by a successful retest would strengthen continuation potential. Possible entry: $397–$400 after confirmation; SL: $389; TP1: $405; TP2: $415. A failed breakout or a move back below reclaimed support weakens this setup. Bearish Scenario — If price loses $385 and fails to reclaim it, momentum may cool toward the moving averages. Possible entry: $382–$385 after confirmation; SL: $398; TP1: $377.45; TP2: $374.50. These are conditional levels, not guaranteed outcomes. Personal Interpretation — I wouldn’t chase a 6.48% candle with RSI already overbought. I’d rather see whether buyers can turn $397 into support or whether price pulls back toward $385 first. The moving-average cluster gives a useful reference for judging whether the rally is holding its structure. Why This Setup Matters — TSLA is at a decision point: a confirmed breakout could extend the rally, while rejection near $397 followed by a loss of $385 could signal exhaustion. RSI alone is not a short signal, and positive MACD alone does not guarantee continuation. The setup matters because the next reaction can reveal whether buyers are still in control or momentum is fading. Waiting for a confirmed close, retest and volume response can offer a clearer risk-to-reward picture than entering emotionally after a sharp move. $TSLAXUSDT #IMPACTbyTrade

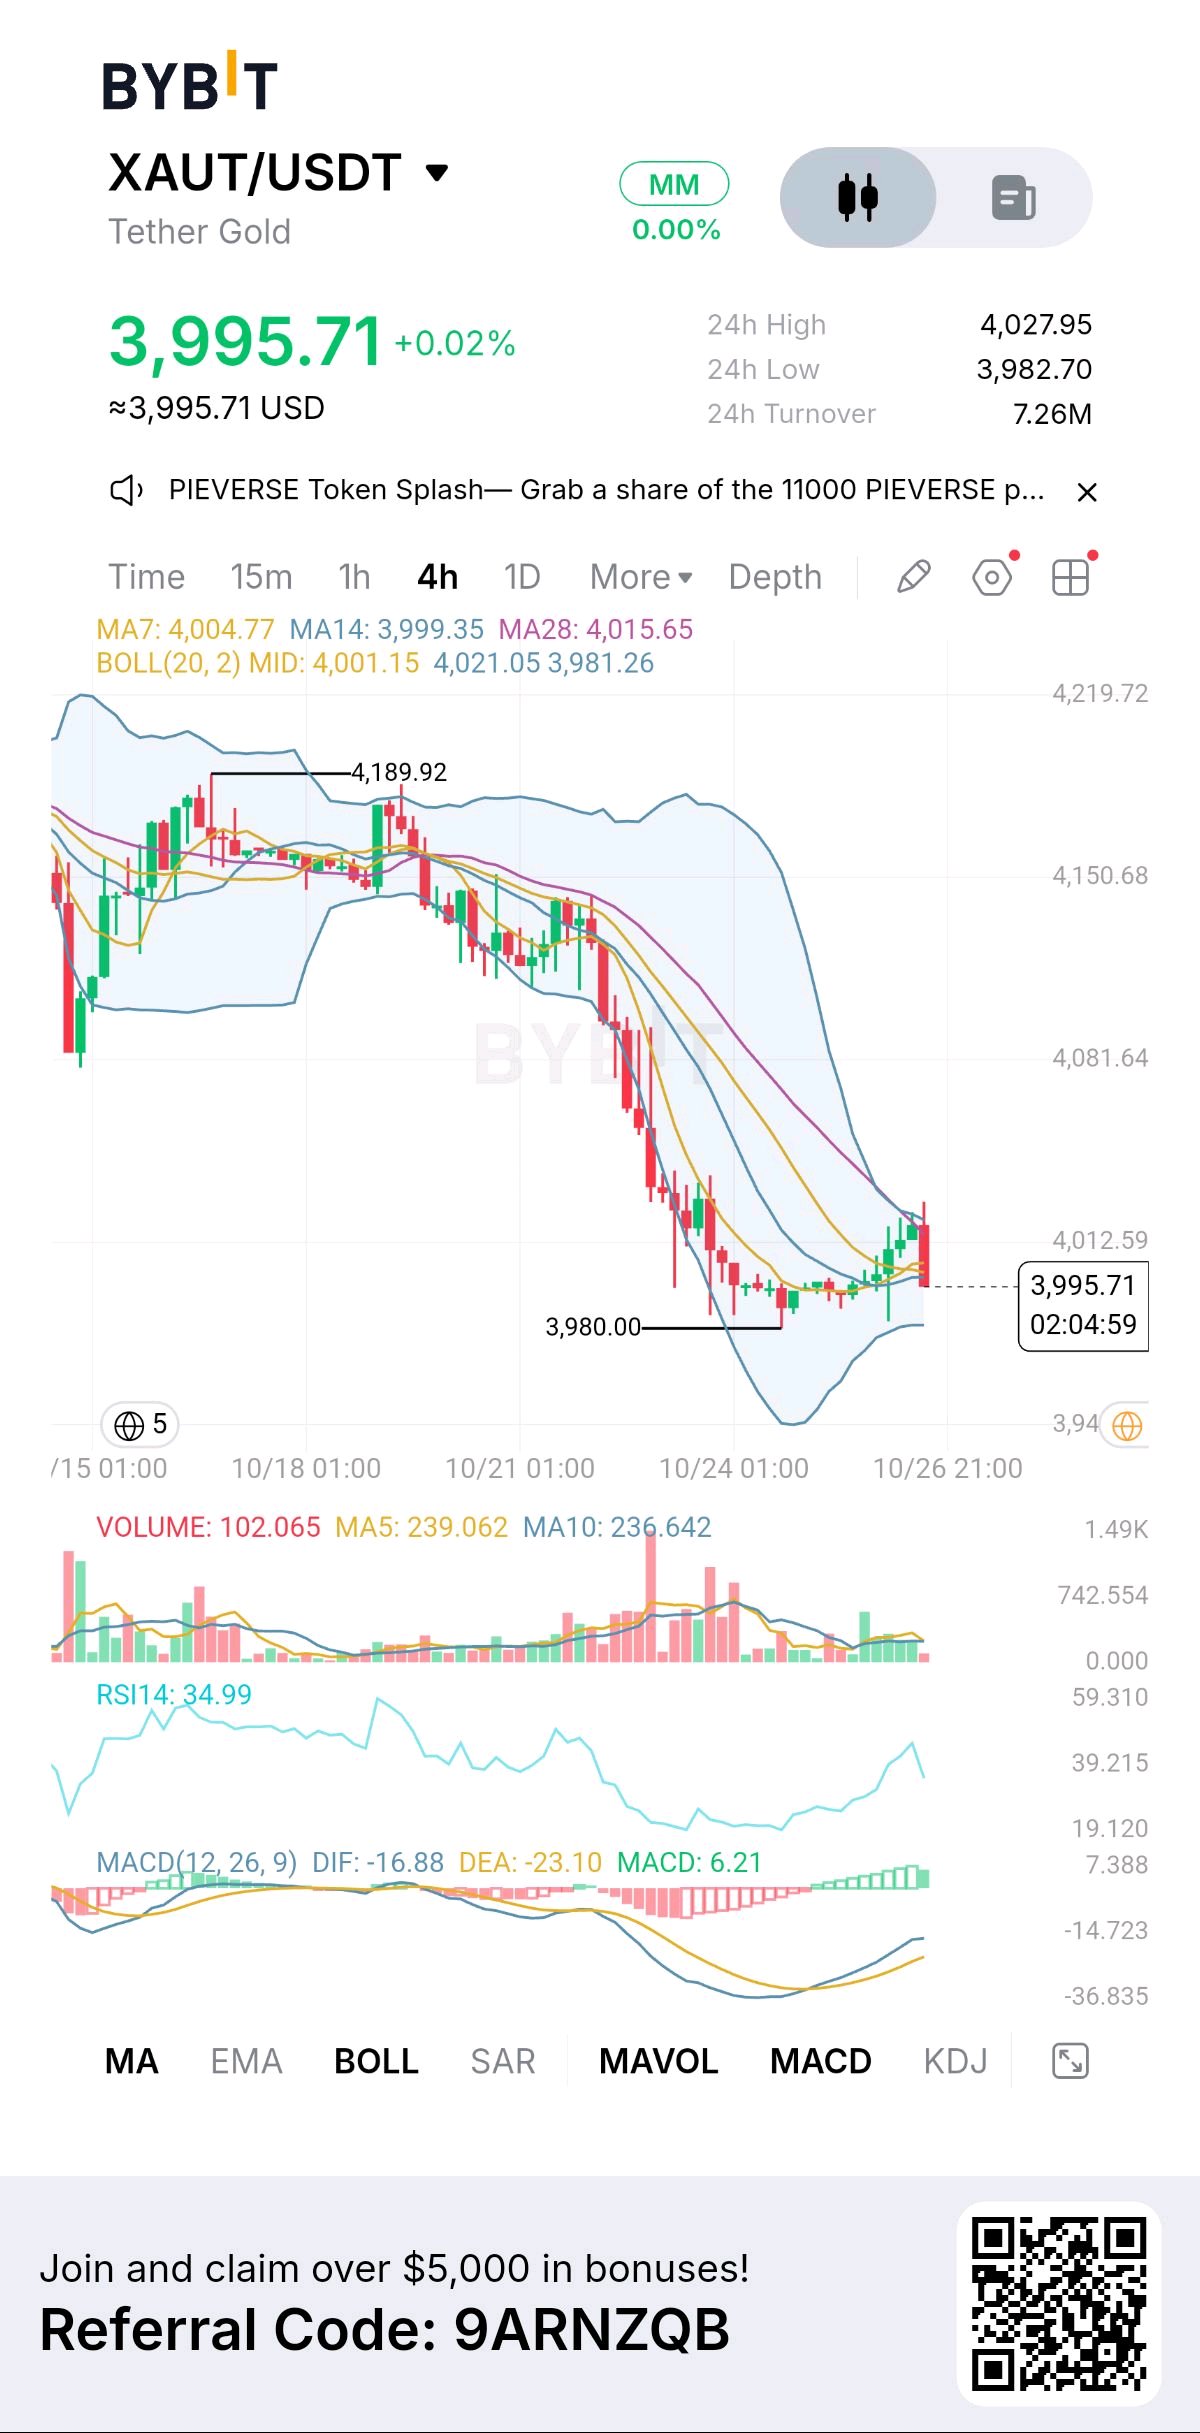
XAUT is backed by physical gold, yet its 4H chart is showing the kind of weakness usually associated with a risk asset. The important distinction is that we’re not simply trading gold here; we’re trading a tokenized claim on gold, where market liquidity and token pricing can also matter. WHAT I'M SEEING ON THE CHART — BYBIT shows XAUT at $3,995.71, with a 24H high of $4,027.95 and low of $3,982.70. Price has fallen from $4,189.92 and is trying to stabilize around the marked $3,980 support. The rebound has already met resistance near $4,012, so buyers haven’t regained control yet. Current Market Data — Market-wide quotes around October 26 put XAUT near $4,012, slightly above the screenshot price. Public trackers report roughly $95M–$180M in daily volume, but circulating-supply and market-cap estimates differ materially between providers. I wouldn’t treat one aggregator’s valuation as definitive without reconciling its supply data. Fundamentals — Tether Gold (XAUT) represents ownership of one fine troy ounce of physical gold held in Swiss vaults. It gives crypto users gold exposure without directly storing bullion and allows blockchain transfers. Tether reported 707,747 fine troy ounces of reserves at the end of Q2 2026, with 1:1 backing. The attraction is combining gold exposure with digital portability, although issuer, custody and redemption risks remain. Tokenomics — XAUT doesn’t have a fixed maximum supply like Bitcoin. Tokens are issued against physical gold, while redeemed tokens are removed from circulation. That makes supply demand-driven rather than based on mining emissions or scheduled investor unlocks. Direct issuance and redemption involve fees and eligibility requirements, and exchange prices can trade at a premium or discount to the underlying gold value. Macro + Chart — Gold responds to real yields, the dollar, inflation expectations and geopolitical risk. The October 27–28 Fed meeting could shift rate expectations and influence gold pricing. On the 4H chart, XAUT remains in a clear lower-high/lower-low structure. MA7 at $4,004.77, MA14 at $3,999.35 and MA28 at $4,015.65 cluster above or around price, creating a resistance band. Indicators — RSI14 is 34.99, showing weak momentum but not yet deeply oversold. MACD is still below zero, although its positive 6.21 histogram suggests the bearish momentum is easing. Price remains near the lower Bollinger Band at $3,981.26, while the middle band at $4,001.15 is the first reclaim level. The latest rejection warns that recovery is not confirmed. Bullish Scenario — Trigger: a 4H close above $4,015.65 and a successful retest. Entry: $4,012–$4,016; SL: $3,980; TP1: $4,027.95; TP2: $4,081.64. The reclaim would clear the MA28 and recent resistance; losing $3,980 invalidates the setup. Bearish Scenario — Trigger: a 4H close below $3,980, followed by a failed reclaim. Entry: $3,976–$3,980; SL: $4,005; TP1: $3,960; TP2: $3,940. These lower targets are projections, not confirmed support levels. A sustained reclaim above $4,005 weakens the bearish case. Personal Interpretation — I wouldn’t chase either direction inside this tight range. I want to see whether $3,980 holds and price can reclaim $4,015, or whether sellers force another breakdown. XAUT’s gold backing provides a different exposure from ordinary altcoins, but it doesn’t remove short-term price, liquidity or issuer risk. The real signal is whether buyers can defend support and recover resistance, not simply whether gold has a strong long-term narrative. $XAUTUSDT #IMPACTbyTrade

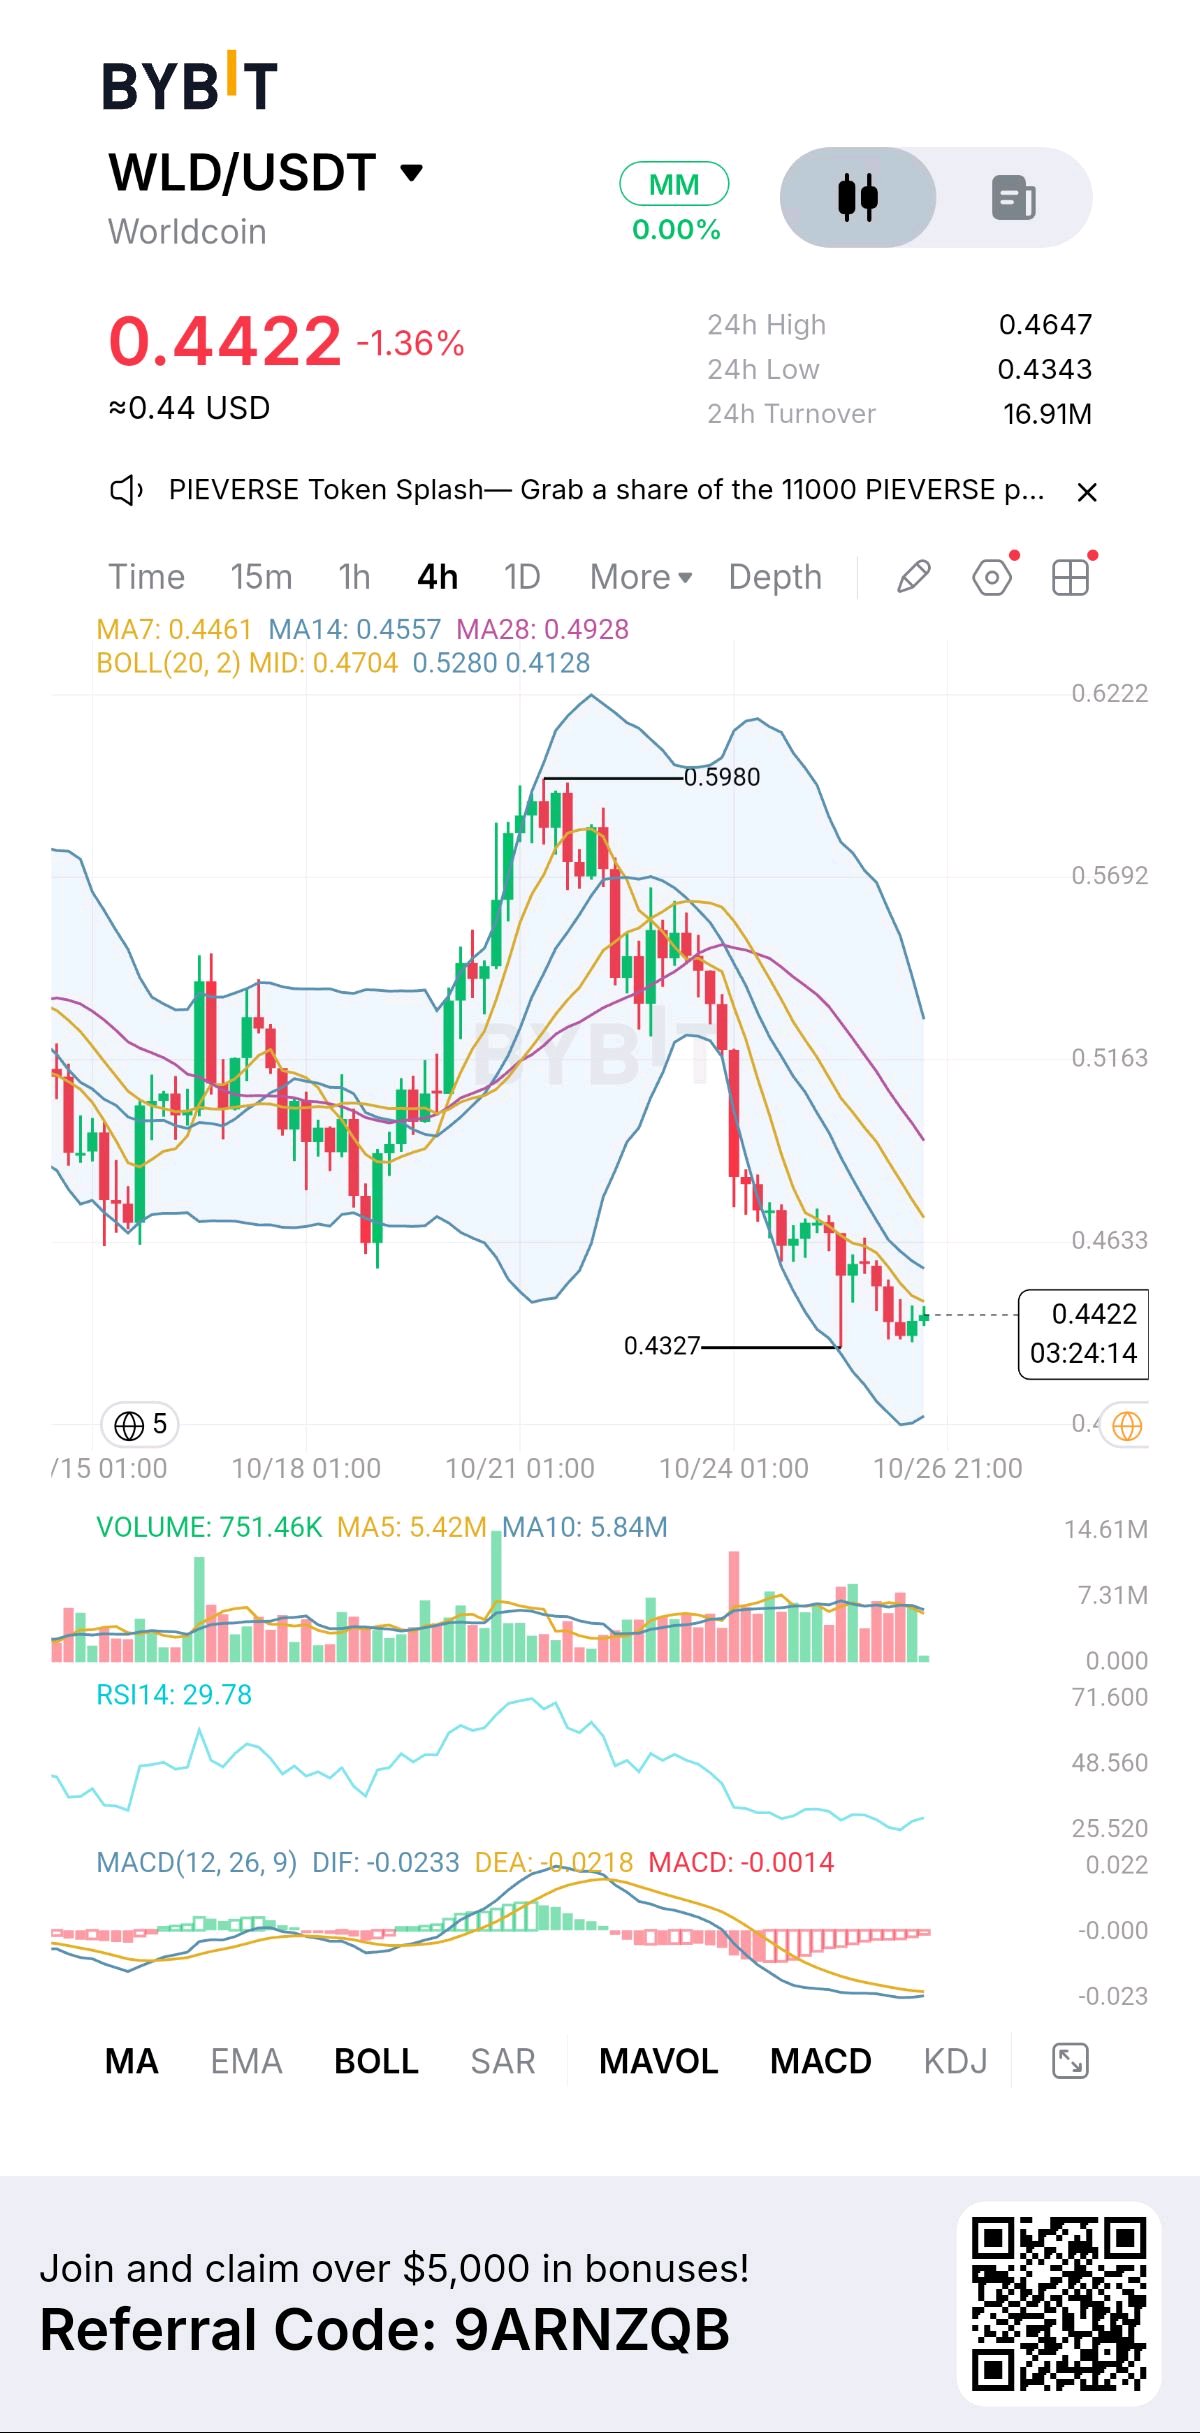
WLD has lost nearly 26% from its $0.5980 chart peak, yet the market is approaching a zone where another sell-off could meet exhausted sellers. The contradiction is simple: momentum is deeply bearish, but RSI is now oversold. That makes a relief bounce possible, not a confirmed bottom. The Data Behind This Move The BYBIT 4H chart shows WLD at $0.4422, down 1.36%, with a 24H range of $0.4343–$0.4647. Price recently marked $0.4327 after a steep decline. MA7 ($0.4461), MA14 ($0.4557) and MA28 ($0.4928) are all above price, confirming sellers still control the structure. Current Market Data — Market-wide data on October 26 puts WLD around $0.435, with approximately $1.62B market cap, $178M in 24H volume and 3.72B WLD circulating out of a 10B initial supply. The screenshot’s $0.4422 and $16.91M turnover are exchange-specific figures, so they should not be confused with global market data. Fundamentals — World is building a proof-of-human identity network for an internet increasingly crowded by AI bots and deepfakes. Its World ID app expanded to over 150 countries, while the project reports more than 18 million people holding a Proof of Human. New identity tools targeting financial institutions and online services could strengthen adoption, although partnerships and user numbers do not automatically create demand for WLD itself. Tokenomics — Supply remains the key risk. World’s published schedule reduced the daily unlock rate by 43% on July 24, 2026, to roughly 2.9M WLD daily across allocations. That is less pressure than before, but still meaningful relative to demand. The initial 10B supply cap also has a governance-defined inflation provision that cannot begin before 2038, with a maximum 1.5% annual rate. Unlocks are gradual, not a single cliff, but circulating supply can continue growing. Macro + Indicators — Broader crypto risk appetite and the October 28 Fed decision may influence speculative flows. On this chart, RSI14 is 29.78 and MACD is negative at −0.0014. The histogram looks less negative, hinting that downside momentum may be easing, but price remains below the Bollinger midline at $0.4704 and near the lower band at $0.4128. Bullish Scenario — Trigger: reclaim $0.456 on a 4H close and hold the retest. Entry: $0.452–$0.456; SL: $0.434; TP1: $0.470; TP2: $0.493. Failure to hold the reclaimed zone invalidates the setup. Bearish Scenario — Trigger: 4H close below $0.4327, followed by a failed retest. Entry: $0.430–$0.433; SL: $0.445; TP1: $0.420; TP2: $0.413. A strong reclaim of $0.445 weakens this scenario. Personal Interpretation — I’m not buying just because RSI is oversold. I want evidence that buyers can reclaim resistance while volume supports the move. WLD’s identity narrative is increasingly relevant, but the real test is whether adoption can outpace supply growth. That’s what makes this setup worth watching. $WLDUSDT #IMPACTbyTrade #ByXIMPACT

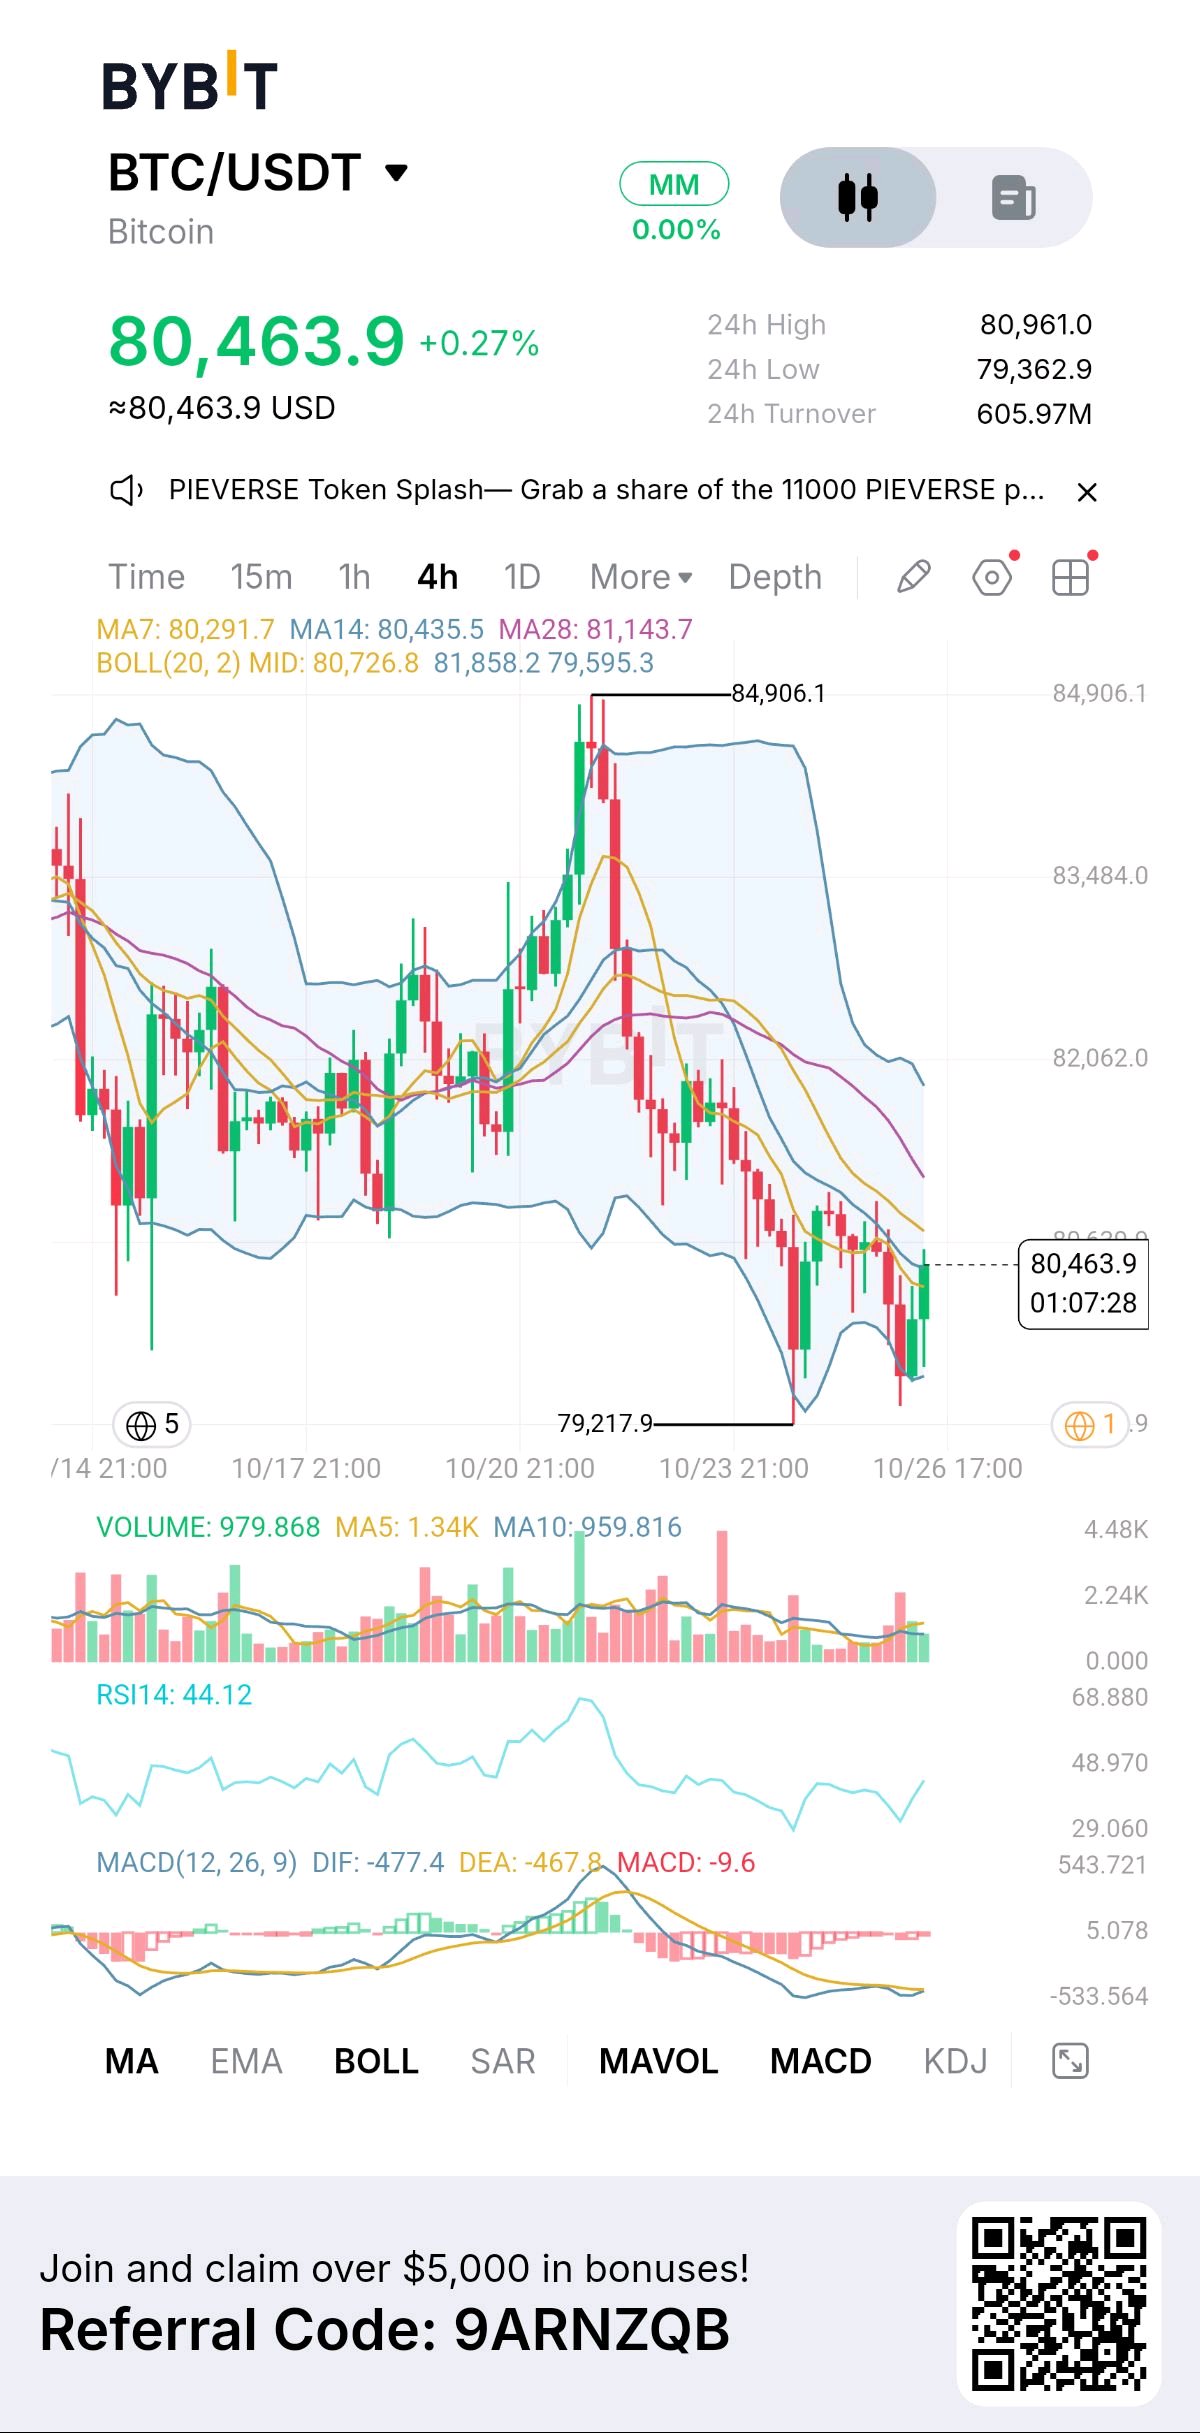
Bitcoin is bouncing from the $79,217 low, but the recovery is running straight into a resistance zone where sellers have repeatedly kept control. What interests me is that buyers are finally pushing price upward, yet the broader 4H structure still hasn’t confirmed a reversal. FACT — The BYBIT BTC/USDT 4H chart shows $80,463.9, up 0.27%, with a 24H high of $80,961 and low of $79,362.9. The marked swing high is $84,906.1 and the recent low is $79,217.9. MA7 is $80,291.7, MA14 is $80,435.5 and MA28 is $81,143.7. The Bollinger middle band sits at $80,726.8. Current Market Data —The screenshot captures BTC near $80.46K, with $605.97M in exchange-reported 24H turnover. Market-wide volume and market capitalization differ from individual exchange figures, so they should not be confused with this screenshot. Circulating supply is around 20.1 million BTC, with roughly 95.7% of its 21 million maximum supply already issued. Fundamentals — Bitcoin’s value proposition is its decentralized monetary network, predictable issuance and ability to transfer value without relying on a central authority. Institutional access, self-custody and long-term scarcity support its investment narrative, but adoption alone cannot prevent short-term corrections when liquidity weakens. Tokenomics — BTC has a hard cap of 21 million coins. Miners currently receive 3.125 BTC per block following the 2024 halving, with the next reduction expected around 2028. Bitcoin has no native staking yield or automatic supply-burning mechanism. Its scarcity is structural, but market price still depends on demand, liquidity and investor positioning. Macro + Market — Bitcoin remains sensitive to Federal Reserve expectations, Treasury yields, the dollar and broader risk appetite. The October 28 Fed decision and upcoming US economic releases could shift expectations for liquidity. If BTC cannot hold recent support, altcoins may remain under pressure even when their individual charts look stronger. Chart + Indicators — The 4H trend still shows lower highs after the $84,906 rejection. Price has reclaimed the short moving averages but remains below MA28 at $81,143.7 and the Bollinger middle band at $80,726.8. RSI is 44.12, recovering but below neutral 50. MACD remains negative at -9.6, with DIF at -477.4 below DEA at -467.8. Selling pressure may be easing, but bullish confirmation is still missing. Bullish Scenario — Trigger: a 4H close above $81,143 followed by a successful retest. Entry: $81,150–$81,350; SL: $80,400; TP1: $82,062; TP2: $83,484. Reclaiming the MA28 would be the first meaningful structural improvement. A failed retest would invalidate this entry. Bearish Scenario — Trigger: a 4H breakdown below $79,217 followed by rejection on a retest. Entry: $79,150–$79,250; SL: $80,000; TP1: $78,500; TP2: $77,800. Losing the marked low would expose further downside, although the lower targets are projections rather than confirmed support levels. Personal Interpretation — I wouldn’t chase this bounce just because the candles look stronger. I want to see BTC reclaim $81,143 with follow-through, or break support convincingly. Until then, I’m treating this as a recovery attempt inside a weak structure. Why This Setup Matters — The key battle is whether buyers can turn the $79,217 area into a durable floor. A confirmed reclaim could open the way toward higher resistance, while another rejection may bring the recent lows back into play. The reaction around these levels matters more than predicting the next candle. $BTCUSDT #IMPACTbyTrade #ByXIMPACT