Mdleganttop1
💹 Bybit Square | Trade Smart, Earn Big 🚀 Crypto Moves | Bybit Square Hustler 💎 Trade 💰 Learn 📚 Grow 🌱 | Bybit Square 📈 Market Insights & Smart Trading | Bybit S
SPCX/USDT — Market Recovery in Focus
SPCX is trading near $147.99 after retreating from the $176.31 peak. Price is attempting to stabilize around the $143–$148 region, but buyers still need to overcome nearby resistance. A strong move above $150.55 with increased buying volume could support a recovery toward higher price levels. LONG POSITION — ROUND 1 Entry Zone: $145.00–$148.00 Take-Profit Targets: TP1: $150.55 TP2: $154.89 TP3: $158.00 TP4: $162.00 Stop Loss: $141.80 Support Levels: $144.92 / $142.32 Resistance Levels: $149.14 / $150.55 / $154.89 / $155.76 Breakout Watch: A sustained move above $150.55 with stronger buying activity could improve the bullish outlook. Failure to hold support may weaken the setup. Risk Management: Confirm the price action before entry, control position size, and avoid chasing sudden price spikes. This is a speculative chart-based plan, not a guarantee of profit. #ByXIMPACT #2026FinancialPassport #IMPACTbyTrade #MyByXTake #AnthropicS1Filing $SPCXXUSDT $MNTUSDT


The trap has begun... $BTC
While retail is loading up, whales are waiting for the final drop My roadmap: 1. 3-5 days of chopping 2. Liquidity sweep at $75k / $70k 3. "Long Setup" forming 4. Recovery to $87k 5. Long targets swept: $98k / $116k Now you know, don't say I didn't warn you... #ByXIMPACT #2026FinancialPassport #FOMCRateDecision #MidtermsMarketWatch #MyByXTake $BTCUSDT $DOGEUSDT
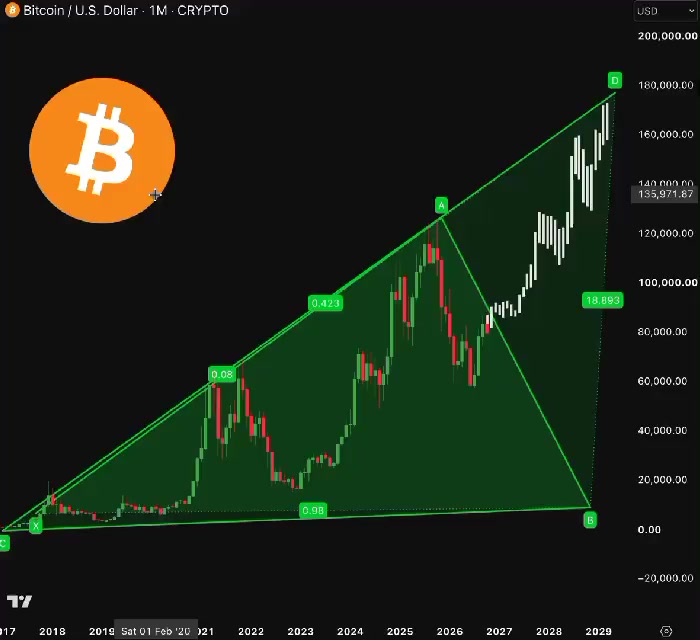
🇺🇸 PRESIDENT TRUMP: Bitcoin surged 3,900% during my first term, from $898 to $35,900, and could one day surpass gold! He is a "BIG CRYPTO GUY." 🚀 #ByXIMPACT #2026FinancialPassport #FOMCRateDecision #MidtermsMarketWatch #MyByXTake $BTCUSDT $DOGEUSDT

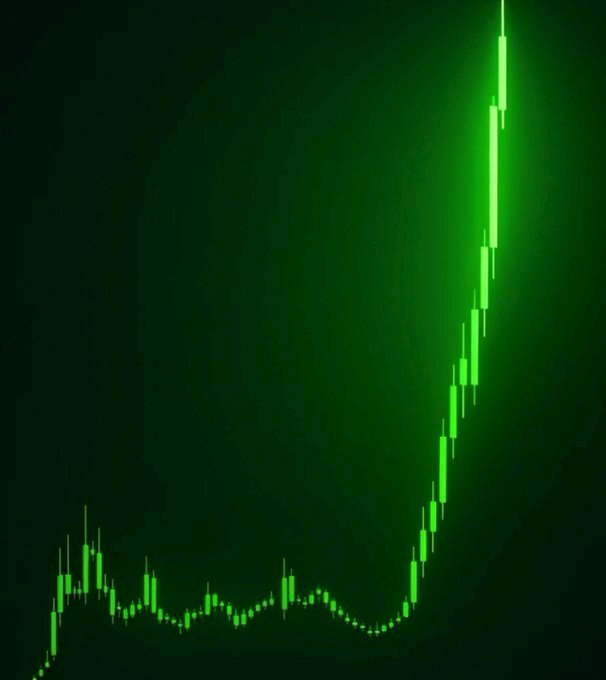
TSLAX/USDT: Bulls Drive Price Toward $400
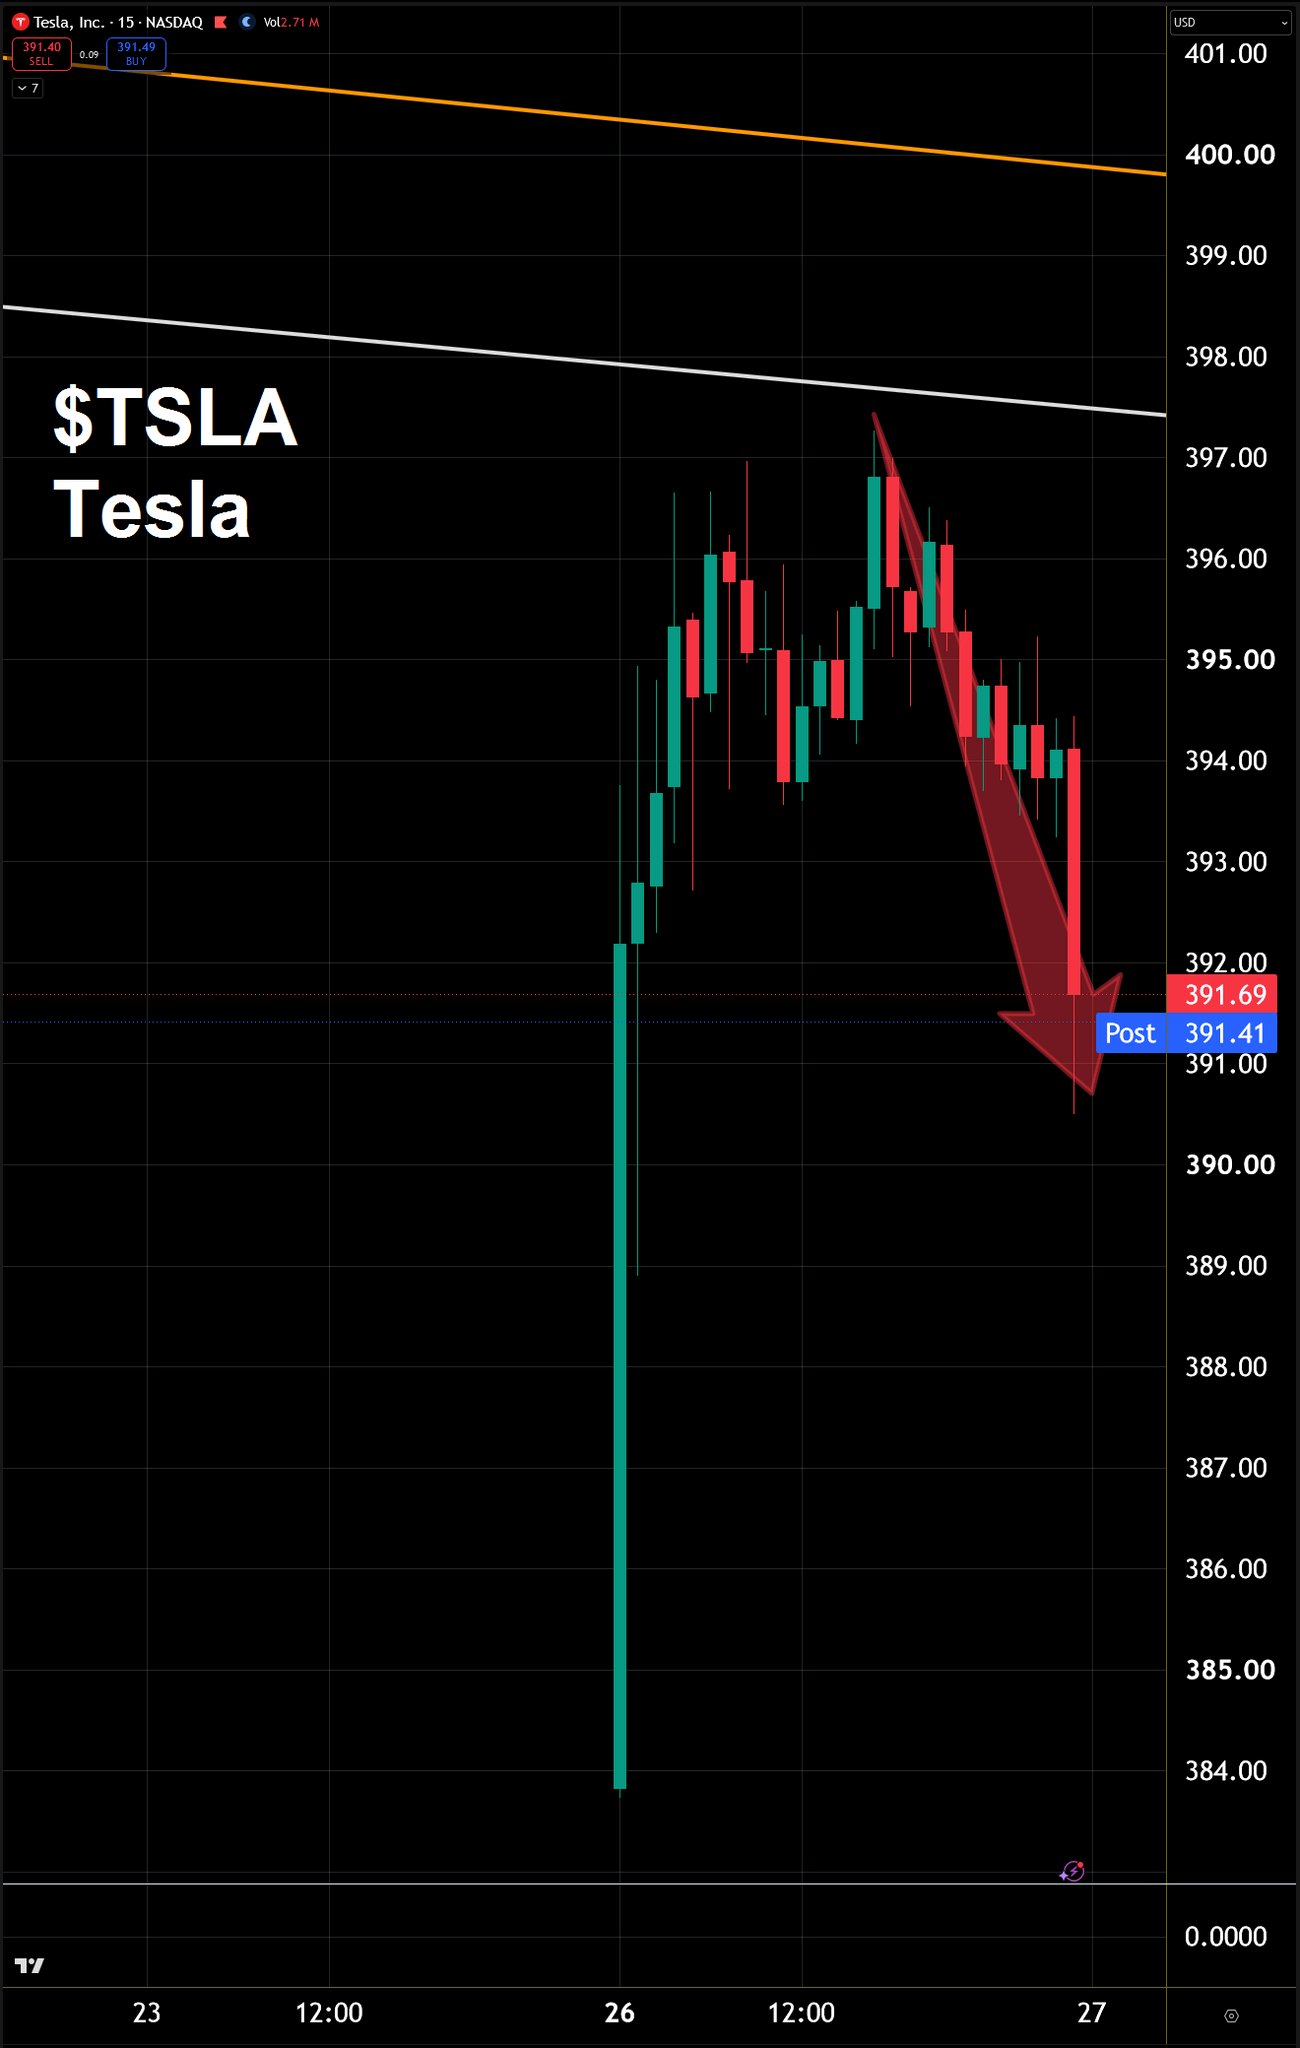
TSLAX is making a strong comeback, trading around $392.56 after gaining 5.71% in the last 24 hours. The 4-hour chart shows a powerful upward candle emerging from the $372–$373 region, pushing price above the moving averages and bringing the recent high of $398.13 into focus. The immediate challenge is the $398–$400 zone. If buyers maintain pressure and break through this barrier, the rally could extend further as momentum traders watch for continuation. However, after such a sharp move, some profit-taking or a short consolidation would not be surprising. #ByXIMPACT #Bybit8thAnniversary #FOMCRateDecision #WSOT2026 #IMPACTbyTrade $TSLAXUSDT $ETHUSDT
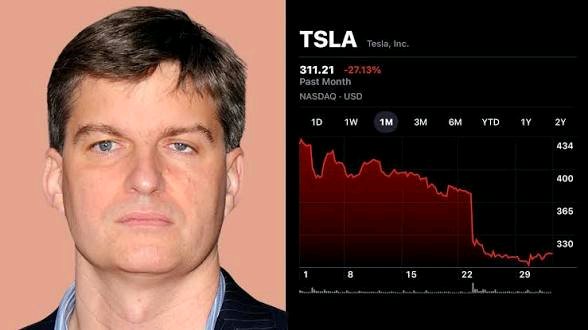

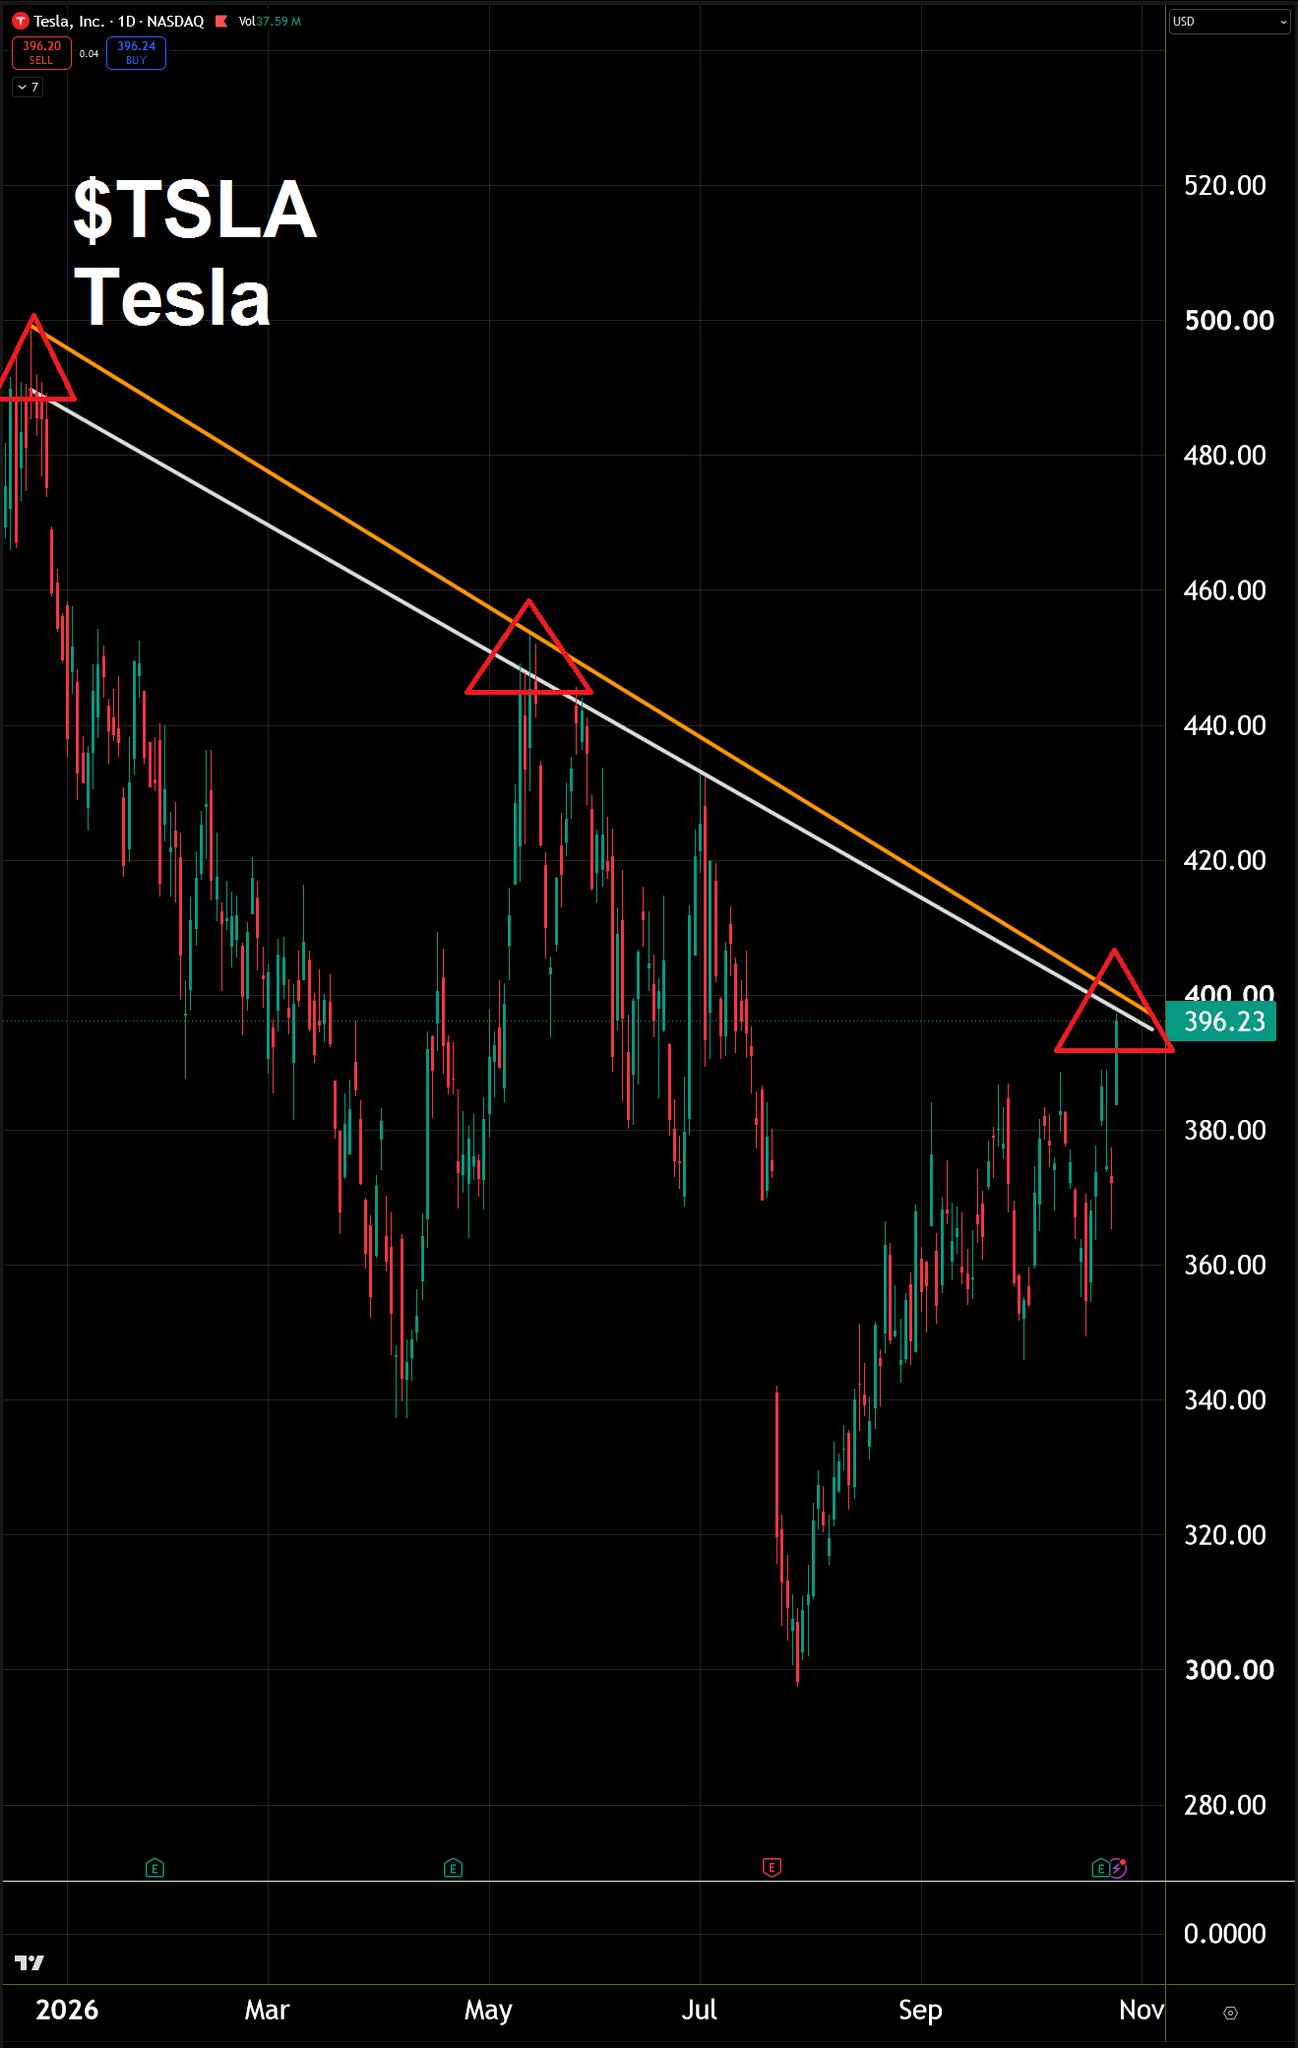
You see? 👍 $TSLA #Tesla #Finance You are welcome to follow the trading master anytime you prefer #ByXIMPACT #Bybit8thAnniversary #FOMCRateDecision #MidtermsMarketWatch #MyByXTake $TSLAXUSDT $SOLUSDT
SOL Long Setup: Buyers Must Reclaim $102.60
Solana is trading near $101.59 after a prolonged decline from the $113.42 chart high. Price is attempting to stabilize, but the moving averages overhead suggest that buyers still need to prove their strength. A long setup becomes more attractive only if SOL can reclaim nearby resistance rather than bounce briefly and fade again. LONG TRADE PLAN Entry Zone: $101.70–$102.00, only after a bullish reaction and confirmation on the chart. Confirmation Level: $102.60 — a sustained move above this area would strengthen the recovery case. Target 1: $103.50 Target 2: $104.80 Target 3: $106.58 Support to Watch: $100.00–$99.89 Major Support: $98.62 Invalidation: If SOL breaks below $99.89 and fails to recover, avoid forcing the long idea. A decisive move below $98.62 would invalidate this recovery setup. Risk Management: Wait for confirmation before entering, keep position size controlled, and define your stop-loss according to your own risk limit. The targets above are potential upside checkpoints, not guaranteed outcomes. The key trigger is a successful reclaim of $102.60. Until then, SOL remains in a fragile recovery attempt rather than a confirmed bullish reversal. #ByXIMPACT #2026FinancialPassport #FOMCRateDecision #MidtermsMarketWatch #MyByXTake $SOLUSDT $ETHUSDT


BREAKING:
Tom Lee's BitMine bought $24.3 Million worth of $ETH last week, bringing its total holdings to $14.1 Billion. Tom Lee predicts ETH will hit $62,000 in the long term. #ByXIMPACT #AnthropicS1Filing #MyByXTake #IMPACTbyTrade #MidtermsMarketWatch $ETHUSDT $BTCUSDT

BTC Reclaims 80K, But 81K Is the Real Test
Bitcoin is trading at $80,465 on the 4-hour chart, down 0.31% on the day. That number hides a busy session: price swung about 1,600 points between $79,363 and $80,961 and has now climbed back to the upper part of that range. The bigger picture is less friendly. BTC is about 5% below the $84,906 peak, and every bounce since that high has stalled lower than the last. The question now is whether this recovery is the start of a turn or just another pause inside a downtrend. WHAT THE CHART SHOWS Floor tested twice: Price touched $79,218 earlier and came back to $79,363 in the last 24 hours. Two touches at nearly the same level suggest buyers are defending this zone. Fast averages reclaimed: Price is above the 7-period ($80,269) and 14-period ($80,413) moving averages. That is the first sign of short-term strength. Slow average still overhead: The 28-period average sits at $81,013, and its exponential version at $80,954. Price has not closed above either, so the downtrend has not been broken yet. Volume is waking up: The latest candle shows 2.07K, above its 5-period average (1.68K) and well above its 10-period average (1.14K). The bounce has real participation behind it. RESISTANCE LEVELS: WHAT BULLS MUST CLEAR $80,521: The 14-period exponential average, directly above price. $80,961: The 24-hour high. A close above it would be the first higher high in days. $81,013: The 28-period moving average and the line that decides the short-term trend. $82,062: The next chart level and the likely first target after a breakout. $83,484: A major level where price turned down earlier in the move. $84,906: The swing high and the final ceiling on this chart. SUPPORT LEVELS: WHERE BUYERS MAY STEP IN $80,330–$80,270: The 7-period averages overlap here, giving the nearest support. $79,363: The 24-hour low and the first real floor. $79,218: The swing low and the last line of defense. This level has already been tested once. Below $79,218: There is no support visible on this chart. A close under it would open the door to a fast drop. THREE SCENARIOS Buy the floor: If price dips back to $79,500–$79,350 and holds with a bullish candle, look for entries in that zone. Stop loss below $79,150. Targets: $80,269, then $80,961. That is roughly 3 to 5 times the risk. Reclaim and run: If a 4-hour candle closes above $81,013, wait for a retest of that level before buying, around $80,950–$81,050. Stop loss below $80,500. Targets: $82,062, then $83,484. That is roughly 2 to 5 times the risk. Floor fails: If a 4-hour candle closes below $79,200, stop buying and wait. A short can be considered on a retest of $79,250 from below, with a stop above $79,700. There are no chart levels below, so take profit in pieces and trail your stop. RISK RULES Risk no more than 1–2% of your account per trade. Wait for the 4-hour candle to close. Wicks on this chart are long and prove nothing. Every trade needs a stop loss before you enter. Take partial profit at the first target and move your stop to entry. Keep leverage low. A 1,000-point move can happen in a single candle. THE BOTTOM LINE Buyers have defended $79,200 twice and volume is rising, which is a good start. But until Bitcoin closes above $81,013, this is a bounce inside a downtrend, not a reversal. Respect the floor, watch the ceiling, and let the candle close tell you which way it breaks. Educational technical analysis, not financial advice. Crypto is high risk. Trade only with money you can afford to lose. #Bitcoin #BTC #CryptoAnalysis #ByXIMPACT #AnthropicS1Filing #IMPACTbyTrade #MyByXTake #MidtermsMarketWatch $BTCUSDT $MNTUSDT


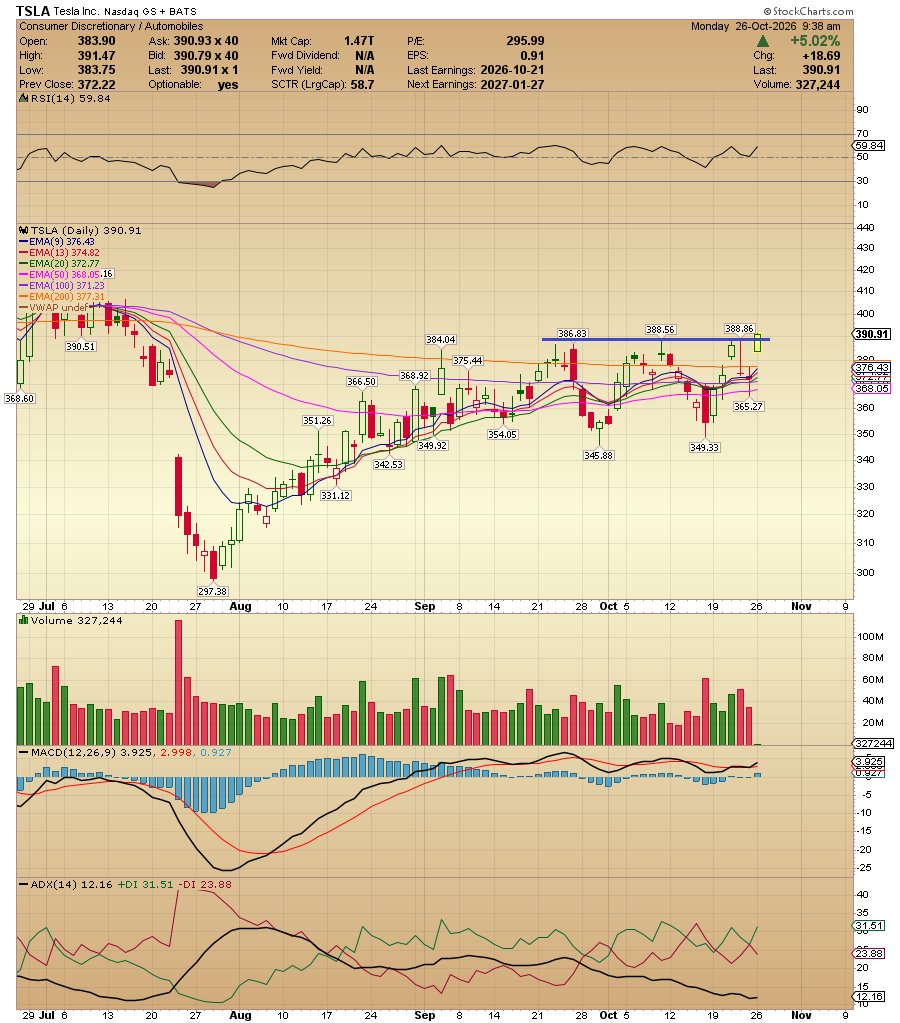
tsla is breaking out. Lets see if it holds
#ByXIMPACT #2026FinancialPassport #Bybit8thAnniversary #FOMCRateDecision #MidtermsMarketWatch $TSLAXUSDT $SOLUSDT
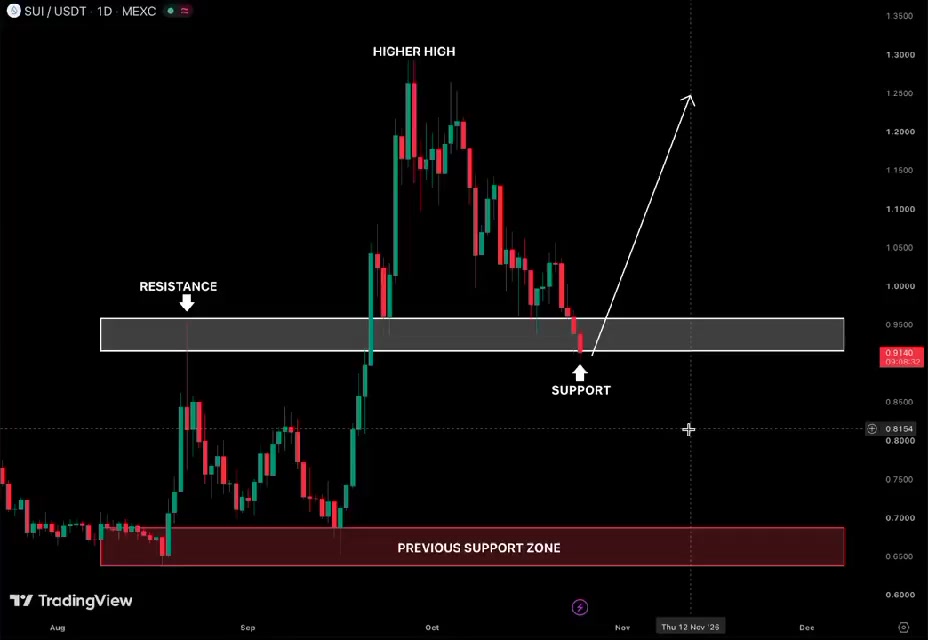
sui is testing the breakout zone again
This was resistance before, and now bulls need to prove it can hold as support If it does, a bounce toward $1.10 and potentially $1.25 wouldn’t surprise me Let’s see if buyers actually show up or if this level was just temporary support #ByXIMPACT #2026FinancialPassport #Bybit8thAnniversary #FOMCRateDecision #MidtermsMarketWatch $SUIUSDT $SOLUSDT
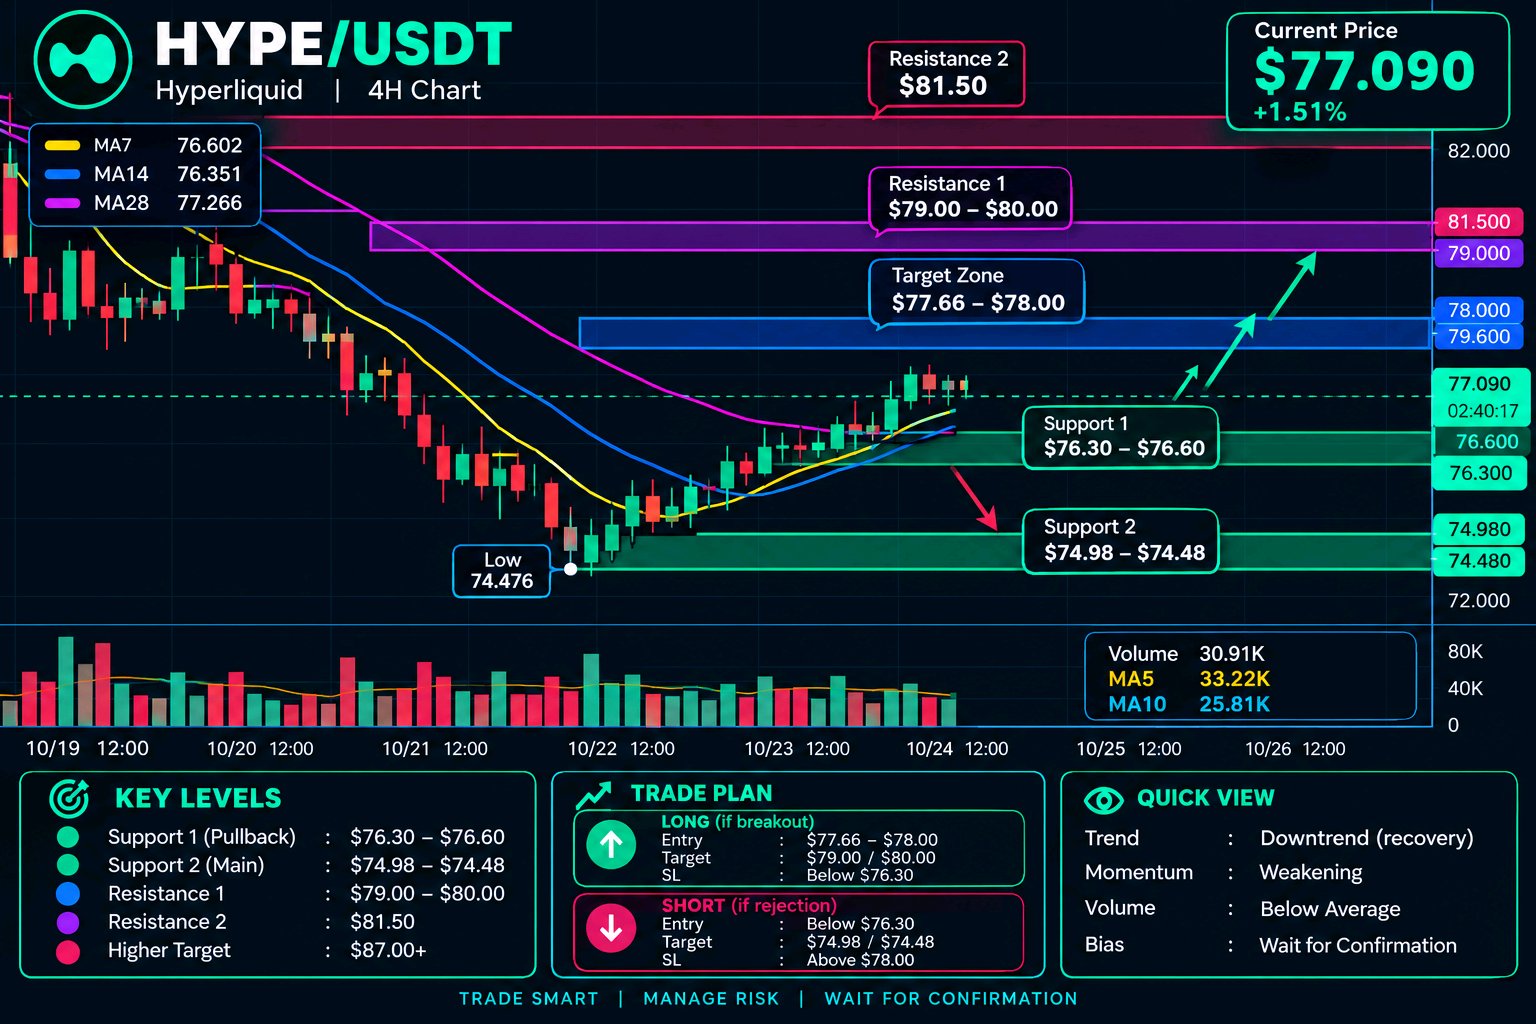
HYPE HAS REBOUNDED — BUT CAN BUYERS TAKE CONTROL?
A sharp decline can create an opportunity, but the first bounce does not automatically mean the trend has changed. HYPE is showing signs of short-term recovery after falling from the $88 region, and the next few candles could reveal whether buyers are building momentum or simply reacting to oversold conditions. On the 4-hour chart, Hyperliquid has recovered from the recent $74.476 swing low to around $77.09. Price is back above the short-term MA7 and MA14, while the MA28 near $77.266 remains an immediate hurdle. That makes this a decision area rather than a confirmed breakout. WHAT THE LEVELS ARE TELLING US The $76.30–$76.60 region is the first area to monitor for a pullback. Holding above it would help preserve the current recovery structure. Below that, $74.98–$74.48 forms the more important support area; losing this zone would weaken the rebound and expose HYPE to renewed selling pressure. On the upside, buyers first need to reclaim $77.27 and then challenge the $77.66–$78.00 region. A convincing 4-hour close above that area, supported by stronger volume, would improve the chance of a move toward $79.00–$80.00. The previous recovery attempt near $81.50 remains a higher resistance reference, not an immediate expectation. THE TRADE DECISION Rather than chasing the green candles, I would wait for one of two clearer signals: • Recovery scenario: A 4-hour close above $78.00 followed by a successful retest could provide a conditional long setup, with $79.00 and $80.00 as potential objectives. A return below the reclaimed area would question the breakout. • Weakness scenario: If HYPE fails around $77.27–$78.00 and loses $76.30, the recovery would look less convincing. A move toward $74.98–$74.48 could then come back into focus. Volume matters here. The latest reading is around 30.91K, below the displayed MA5 of 33.22K. Buyers need stronger participation to support a more convincing advance. MY TAKE: HYPE is attempting to stabilize, but the broader 4-hour moving-average structure still shows overhead pressure. Confirmation matters more than guessing the next candle. Let price prove its direction, define risk before entering, and avoid treating either scenario as guaranteed. Which would change your view first: a confirmed close above $78, or a breakdown below $76.30? #ByXIMPACT #2026FinancialPassport #Bybit8thAnniversary #FOMCRateDecision #MidtermsMarketWatch $HYPEUSDT $SOLUSDT

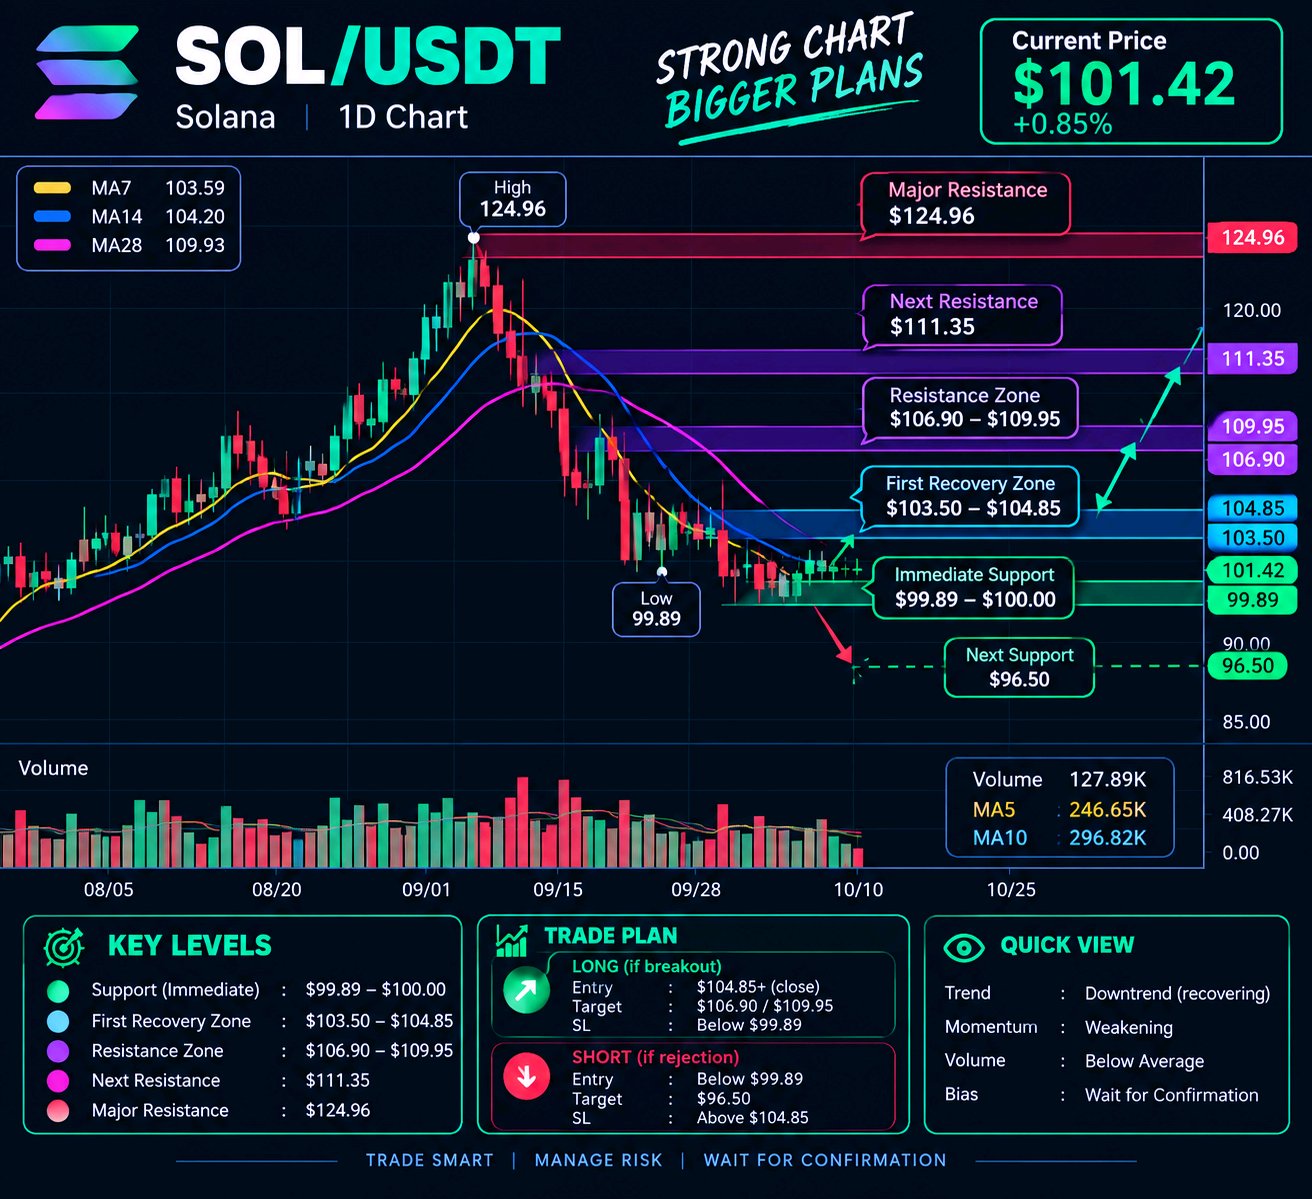
SOLANA’S NEXT MOVE DEPENDS ON ONE THING
A strong rally can change the mood of a market, but holding those gains is often the harder part. Solana’s chart is now showing that challenge: after climbing toward $125, SOL has pulled back considerably, and buyers need to prove they can rebuild momentum rather than simply pause the decline. On the daily chart, SOL is around $101.42, up 0.85% at the time of the screenshot. The short-term moving averages sit above price, with MA7 near $103.59, MA14 at $104.20 and MA28 around $109.93. This suggests the recovery is still facing overhead pressure. Volume has also eased from the stronger activity seen during the earlier rally. THE LEVELS THAT MATTER $99.89–$100.00 — Immediate floor: The recent daily low is near $99.89. If buyers defend this area and price begins forming higher lows, it could provide a base for another recovery attempt. A sustained move below it would weaken that idea. $103.50–$104.85 — First recovery test: This region overlaps the short-term moving averages. Reclaiming it with stronger volume would be an early sign that buyers are regaining control, rather than just reacting to the sell-off. $106.90–$109.95 — Larger resistance band: This area sits near the higher moving averages. If SOL clears the first barrier, this is a more demanding test where sellers could return. $111.35 and $124.96 — Higher reference points: These are broader chart areas to keep in view if momentum improves significantly. They are not immediate expectations; price would need to overcome the nearer barriers first. HOW I’D READ THE NEXT MOVE A daily close above $104.85 with improving volume would make a recovery scenario more credible, with $106.90–$109.95 as the next region to assess. If SOL instead loses the $99.89 floor, I would avoid assuming the dip has finished and wait for price to establish fresh support. For now, the chart shows a market trying to stabilize after a major advance. The key is not guessing the bottom; it is watching whether buyers can turn a temporary bounce into a confirmed change in direction. #ByXIMPACT #MyByXTake #MidtermsMarketWatch #FOMCRateDecision #Bybit8thAnniversary $SOLUSDT $BTCUSDT

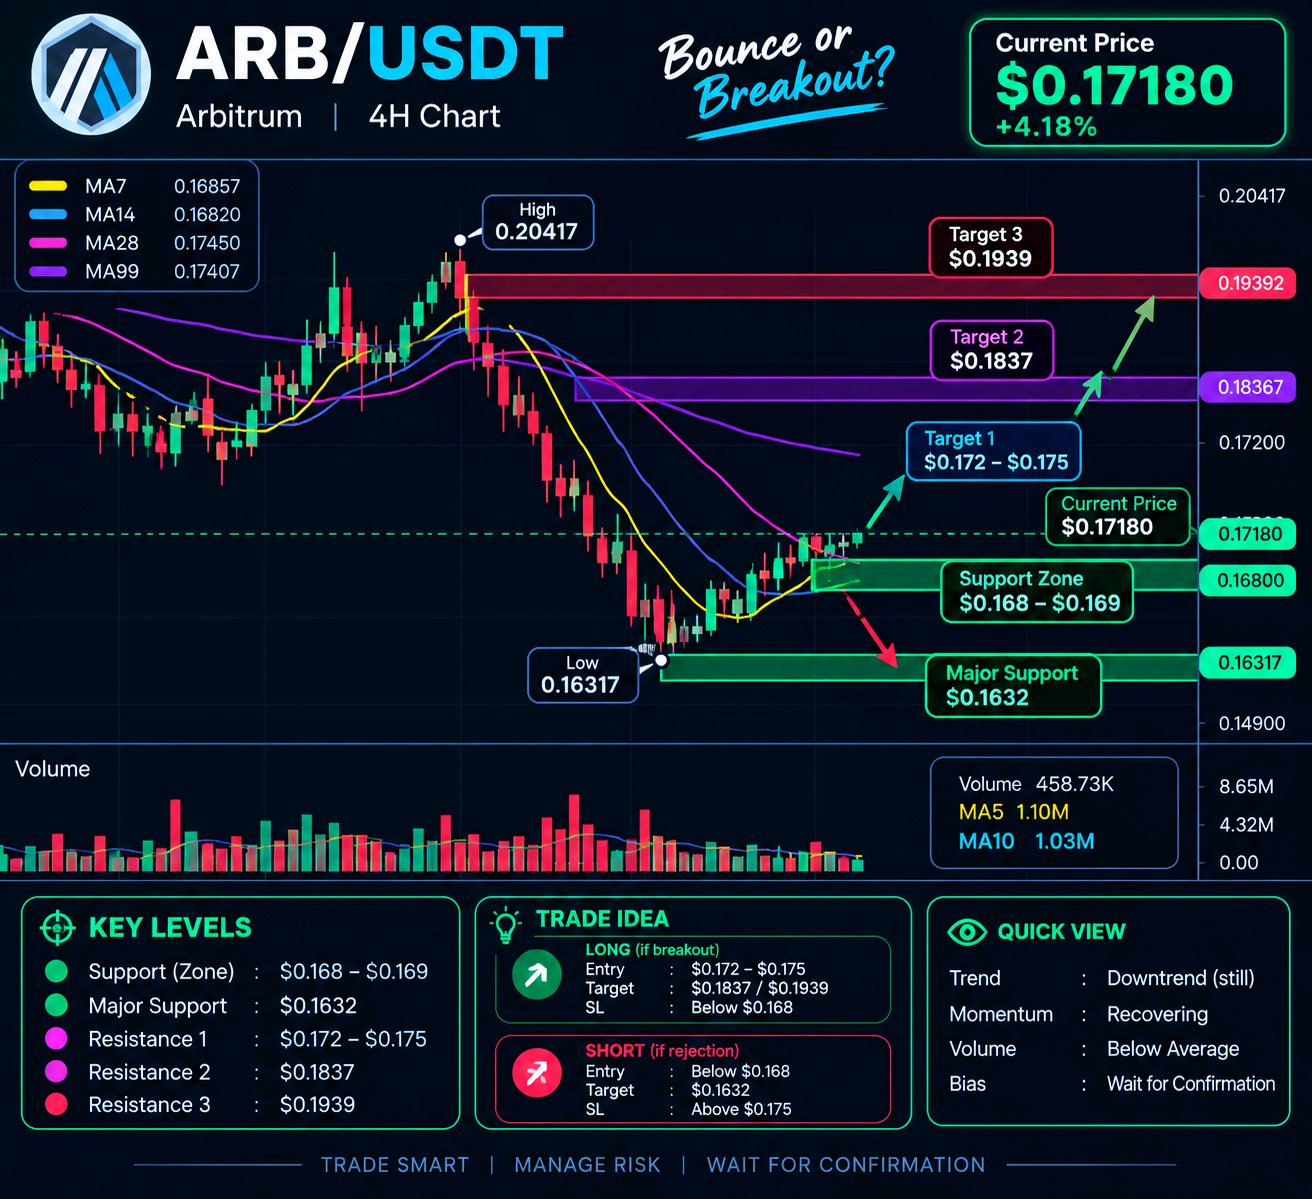
ARB’S REBOUND IS REAL — BUT IS IT STRONG?
Arbitrum is showing a short-term recovery after a sustained decline, but one green move does not automatically mean the trend has changed. The important question is whether buyers can keep control when the price reaches overhead resistance. On the 4-hour chart, ARB is around $0.17180, up 4.18%, after touching the recent low near $0.16317. Price has bounced from that area, while the moving averages still show pressure from the earlier downtrend. Volume is also below its recent averages, so the recovery needs stronger participation to look convincing. WHAT THE CHART IS TELLING US The first challenge sits around $0.172–$0.175. This area matters because the longer moving averages are clustered nearby. A clear 4H close above it, supported by rising volume, would strengthen the recovery case. If buyers manage to hold above that zone, the next areas to monitor are $0.1837 and then $0.1939. These are potential resistance areas, not guaranteed targets. On the downside, $0.168–$0.169 is a nearby area to watch for support. Losing it could weaken the bounce and bring $0.1632 back into focus. A decisive break below the recent low would signal that sellers may still be in control. THE TRADE IDEA Rather than chasing the first green candle, I would look for confirmation: a strong close above resistance with improving volume, or a rejection that shows buyers are not ready yet. If the price remains trapped between support and resistance, waiting may be the better decision. ARB has bounced, but the next move depends on follow-through. Let price confirm the direction before making a decision. #ByXIMPACT #2026FinancialPassport #BybitStocks #FOMCMinutes:Hawkish #Bybit8thAnniversary $ARBUSDT $MNTUSDT

AAPL Holds $346.80: Key Levels to Watch
📊 AAPLUSDT | 4H Market Analysis 💰 Price: $346.80 | 24H High: $347.71 | 24H Low: $345.11 🔹 Support: $345.10–$343.70 — Buyers may defend this area. 🔹 Resistance: $347.70–$351.76 — A breakout could open room for further upside. 🔹 Key Level: $346.50 — Holding above it may support short-term stability. 🔹 MA/EMA: Moving averages are clustered near $346.50–$346.80, indicating consolidation. 🔹 Liquidity: Above $347.71, buy-side liquidity may attract price. Below $345.11, sell-side liquidity could be tested. 📈 Market Bias: Neutral to slightly bullish while price holds support. A clear break below $345.11 would weaken the setup. ⚠️ These levels are based on the supplied 4H chart, not a live market feed. Confirm price action and volume before trading. #MyByXTake #MidtermsMarketWatch #Bybit8thAnniversary #2026FinancialPassport #ByXIMPACT $AAPLXUSDT $SOLUSDT


🚨BREAKING NEWS: THE MOST IMPORTANT
WEEK OF 2026 IS COMING🚨 There's a topic that concerns all crypto investors, and I'm revealing it this week: If there's going to be an agreement between the US and Iran, I expect it to happen this week Trump needs to wrap this up before the midterm elections, and he's running out of time This week, things will come to a head, and I see a high chance of an agreement being reached If an agreement is made, the pressure on the markets will lift, and rally mode will kick back in... #MyByXTake #MidtermsMarketWatch #FOMCRateDecision #Bybit8thAnniversary #2026FinancialPassport $BTCUSDT $SOLUSDT

🇺🇸 Pete Hegseth confirmed to Congress that Bitcoin is a tool to project American power. He also said the Pentagon is running classified programs on it that give the U.S. leverage against China’s digital control model. Details remain secret. #ByXIMPACT #MyByXTake #Bybit8thAnniversary #FOMCMinutes:Hawkish #BybitStocks $BTCUSDT $MNTUSDT


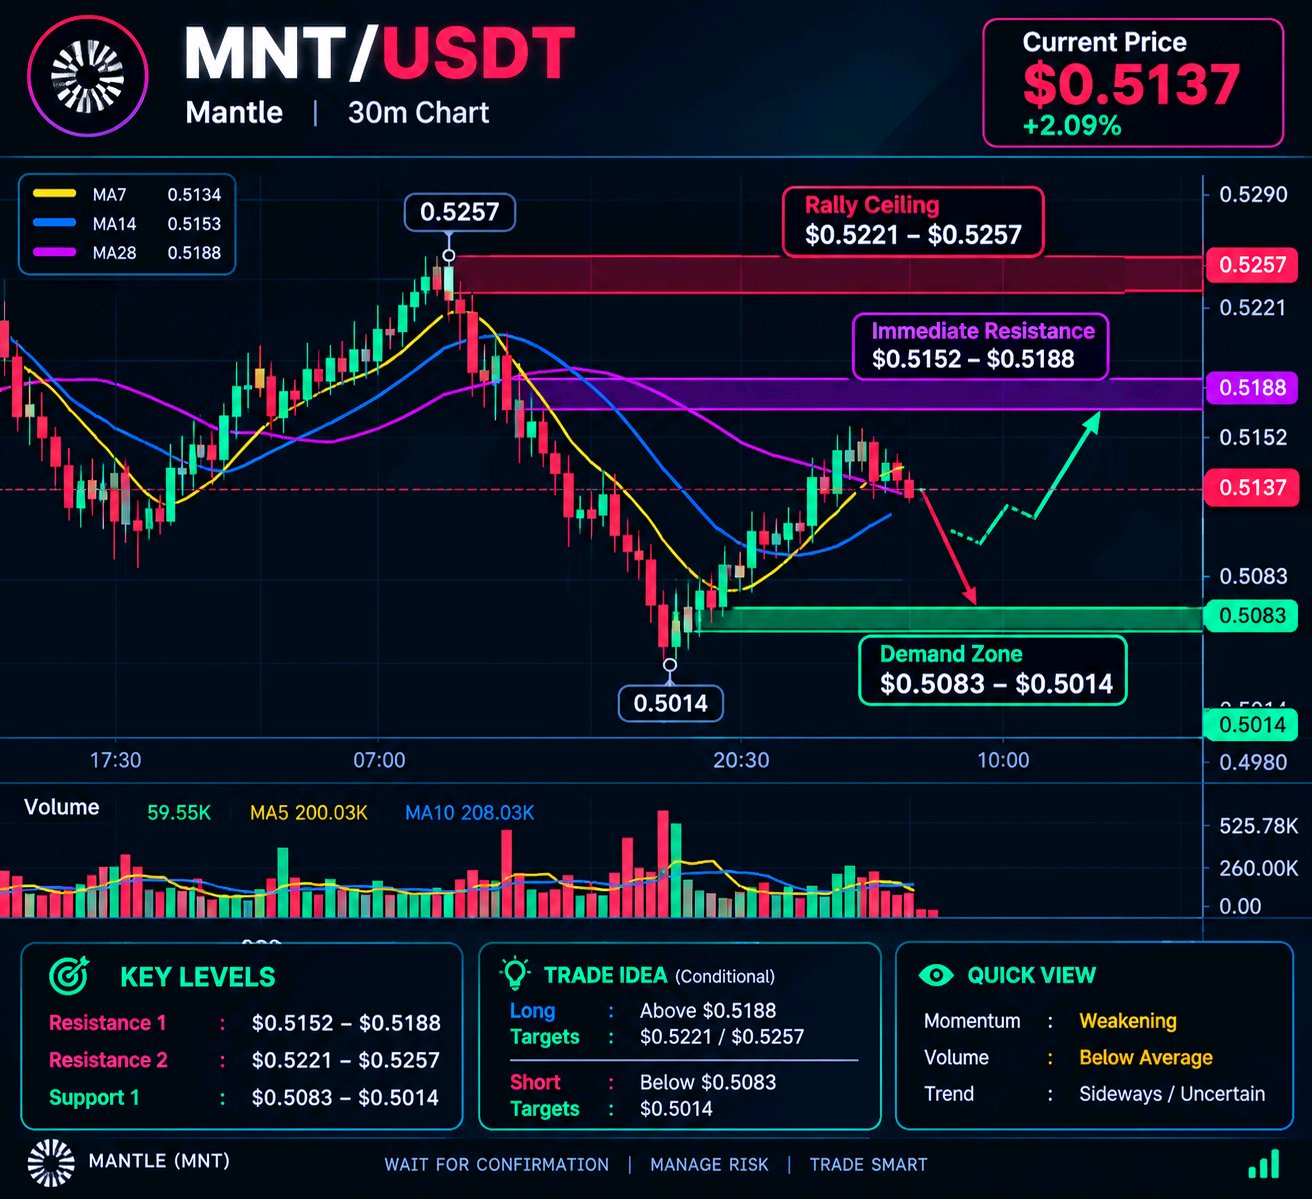
MANTLE AT A TURNING POINT: WILL BUYERS FIGHT BACK?
A strong move can attract attention, but the way a market behaves after that move often reveals much more. When a rally loses momentum and price starts slipping, traders need to determine whether buyers are preparing another attempt or sellers are gradually taking control. That is the situation developing on the MNT/USDT 30-minute chart. Mantle is hovering around $0.5137, after climbing from the $0.5014 low to a recent peak of $0.5257. The rebound was meaningful, but the rejection near the high has brought price back toward a decision area. The latest candles show that recovery momentum has weakened. THE LEVELS THAT TELL THE STORY $0.5083–$0.5014 | Demand zone This is the first area to monitor if selling pressure continues. The market previously found buyers around this region, with $0.5014 marking the visible swing low. A defense here could create a base for another recovery. A decisive breakdown, however, would suggest that buyers are losing control of the short-term structure. $0.5152–$0.5188 | Immediate resistance The moving averages are clustered above the current price, creating an overhead hurdle. Reclaiming this area and holding it on a retest would be an early sign that buyers are returning. Repeated rejection would keep the short-term pressure tilted toward sellers. $0.5221–$0.5257 | Rally ceiling This zone represents the next major challenge for a stronger recovery. Buyers would need to push through the previous high at $0.5257 with convincing volume before a continuation scenario becomes more credible. HOW I WOULD READ THE NEXT MOVE Rather than entering just because price looks inexpensive, I would wait for one of two clear developments. A recovery above $0.5188, supported by stronger buying volume, could open a move toward $0.5221 and potentially $0.5257. If MNT fails to reclaim resistance and breaks below $0.5083, attention shifts toward $0.5014 instead. One additional detail matters: the displayed volume is about 59.55K, below the five-period and ten-period volume averages. That suggests the current bounce needs stronger participation before it can be treated as a convincing reversal. THE REAL EDGE IS CONFIRMATION MNT does not need to move immediately for a useful trading opportunity to develop. The important question is whether buyers can reclaim resistance or sellers can force a fresh breakdown. Until price confirms either direction, protecting capital is more important than predicting the next candle. Chart levels are reference points, not guarantees. Wait for confirmation and define your risk before entering. #ByXIMPACT #2026FinancialPassport #MyByXTake #MidtermsMarketWatch #Bybit8thAnniversary $MNTUSDT $BTCUSDT

NEAR: THE NEXT MOVE COULD BE DECIDED HERE
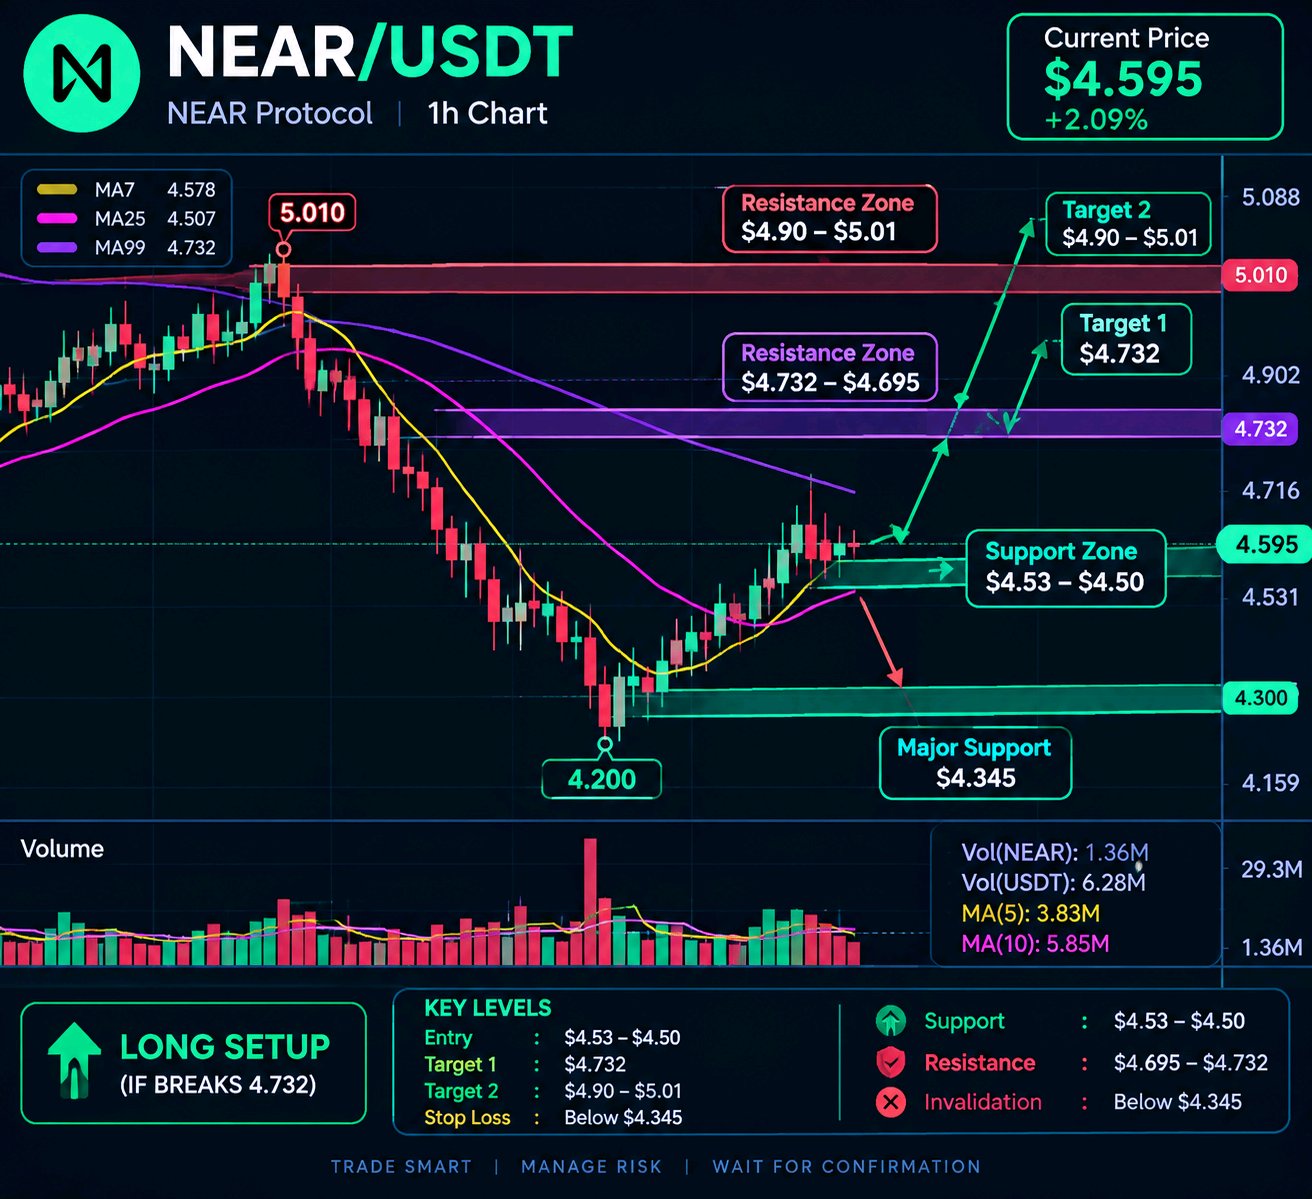
Markets often reveal their direction through price behavior rather than a single green candle. After a sustained decline, a recovery can be the beginning of a trend reversal—or simply a temporary pause before sellers return. NEAR is now approaching a point where the difference matters. WHAT THE CHART IS TELLING US NEAR/USDT is around $4.595, up approximately 2.09% in the latest snapshot. On the 1-hour chart, price has rebounded from the $4.20 swing low and climbed toward $4.70. The recovery is encouraging, but the broader structure still needs confirmation: the 99-period moving average sits near $4.732, above the current price. The short-term averages offer a more constructive signal. MA(7) is around $4.578, while MA(25) is near $4.507. Price holding above both suggests buyers have improved their near-term position. However, the latest volume reading is below the displayed 5-period and 10-period volume averages, so a stronger participation surge would make a breakout more convincing. LEVELS THAT MATTER — AND WHY - $4.53–$4.50 | First support area: This zone is close to the current consolidation and the 25-period moving average. Holding it would suggest that buyers are defending the recent recovery. - $4.345 | Major chart support: This area marks the recent base before the rebound. A move back toward it would weaken the recovery structure. - $4.695–$4.732 | Immediate resistance: The recent high and 99-period moving average create a difficult overhead zone. A clean hourly close above it, supported by rising volume, would improve the bullish case. - $4.90–$5.01 | Higher resistance: If NEAR clears the first barrier, this region becomes a broader upside reference. It is a potential destination, not a guaranteed target. A CONDITIONAL TRADE IDEA Rather than buying simply because price has bounced, watch how it behaves at resistance. A confirmed breakout above $4.732, followed by a successful retest, could offer a possible long setup toward $4.90 and then $5.00–$5.01. The idea loses strength if price breaks back below the reclaimed zone. If buyers fail at resistance and NEAR loses $4.50, a pullback toward $4.345 becomes more plausible. A decisive break beneath that support would put the $4.20 swing low back into focus. THE TAKEAWAY NEAR has shown that buyers can respond after a sharp decline, but recovery alone does not prove a trend change. The next useful evidence will be a resistance break, a convincing retest, and stronger volume. Until those signals appear, patience is more valuable than chasing a fast candle. This is a chart-based scenario, not a guaranteed prediction. Keep position size and risk within limits. #ByXIMPACT #FOMCRateDecision #BybitStocks #FOMCMinutes:Hawkish #MidtermsMarketWatch $NEARUSDT $MNTUSDT

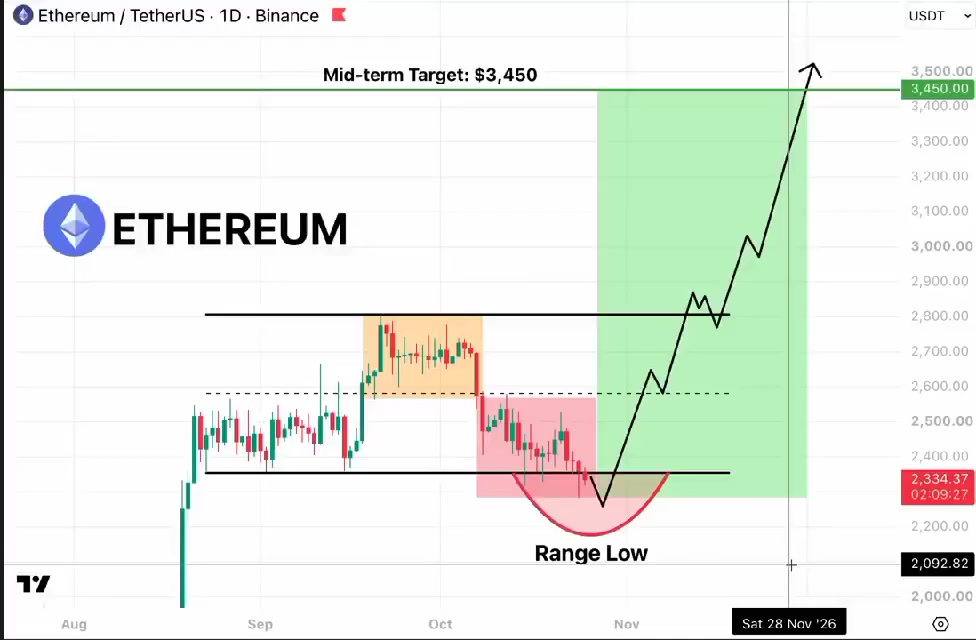
eth is coiling up for the next big move
Look at the daily chart ETH has been stuck in a range between ~$2,350 and $2,800 for weeks Price just dipped below range low, shaking out weak hands right at support Classic spring behavior: sweep the lows, trap late sellers, reclaim the level Smart money isn't selling here, it's quietly loading while retail loses patience Reclaim $2,350, flip the mid-range at ~$2,580 and a breakout above $2,800 opens the door to $3,450 Every day spent in this box adds fuel to the move. Altcoins will follow with force Don't blink. This chart won't stay quiet for long #ByXIMPACT #FOMCRateDecision #MidtermsMarketWatch #FOMCMinutes:Hawkish #USCPI $ETHUSDT $DOGEUSDT
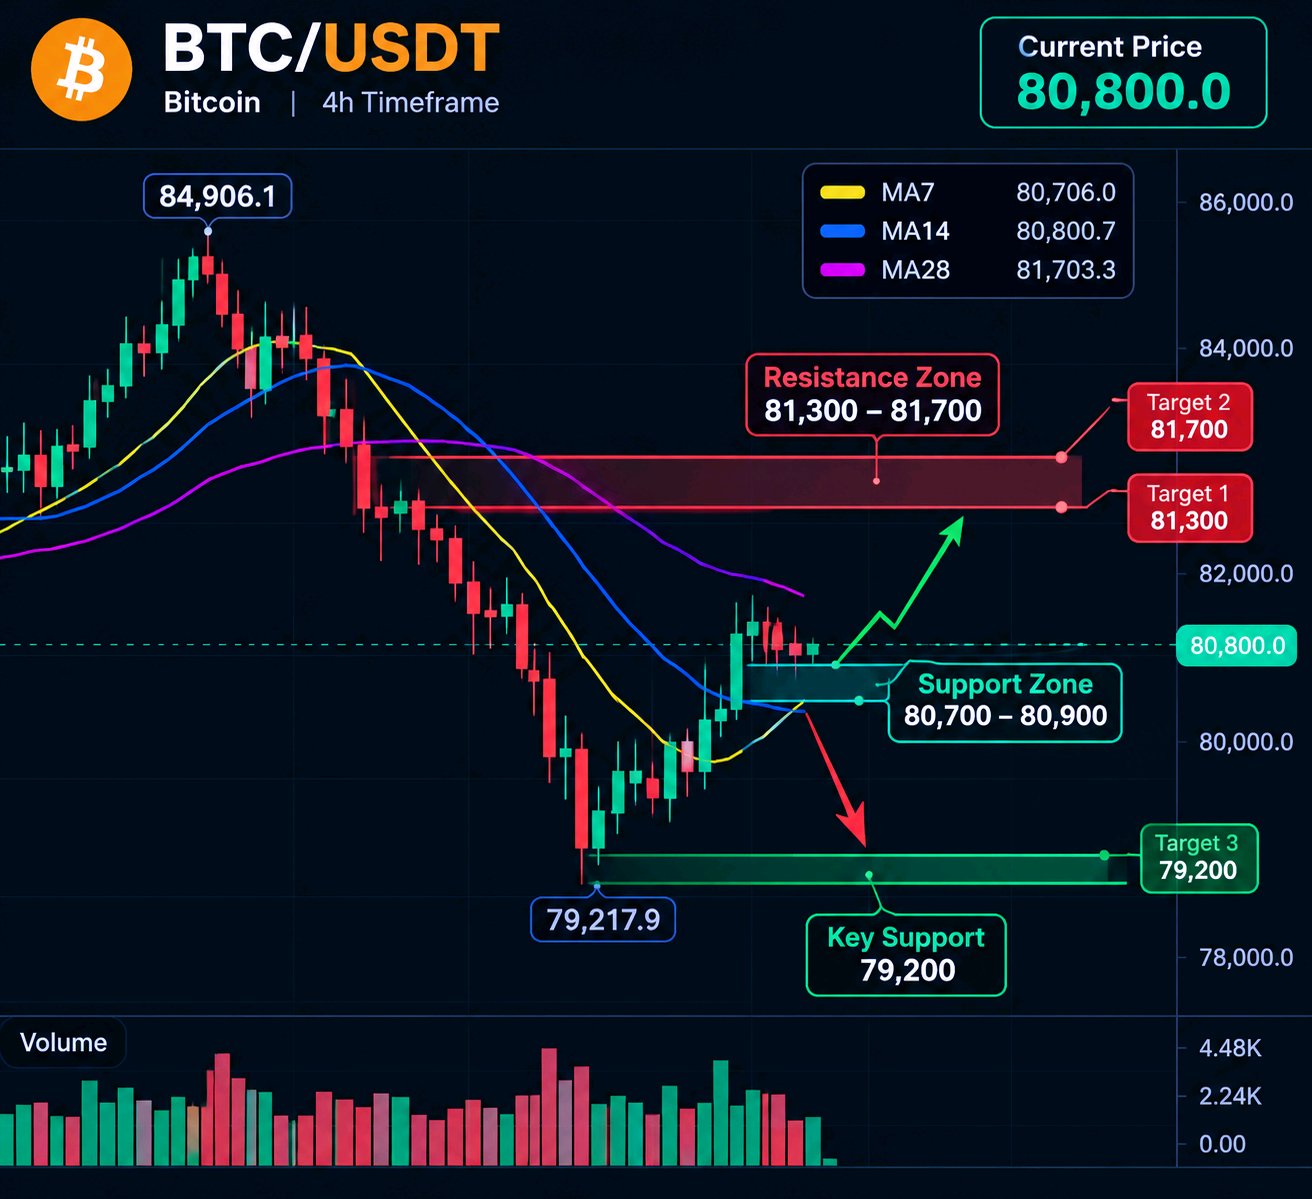
BITCOIN LONG SETUP: CAN BUYERS RECLAIM $81K?
Bitcoin doesn’t need a dramatic green candle to reveal a change in momentum. Sometimes, the more important clue is how price behaves after a sharp sell-off—whether buyers can defend the low, whether rebounds attract fresh demand, and whether resistance starts turning into support. That is what makes the current BTC chart worth watching. After reaching a recent high of 84,906.1, Bitcoin fell sharply toward 79,217.9 before recovering to around 80,800 in this chart snapshot. The rebound is encouraging, but it has not yet confirmed a full trend reversal. THREE LEVELS THAT COULD SHAPE THE NEXT MOVE 79,200 — The recovery’s critical test This area marks the recent swing low. If buyers continue defending it and price builds a higher low, the market could be forming a base. A clear break below it would weaken the recovery idea and increase downside risk. 80,700–80,900 — The momentum checkpoint Bitcoin is trading around the short-term moving averages here. Holding above this zone could help stabilize price, while repeated rejection may show that buyers still lack control. Watch the candle closes rather than reacting to every intraday move. 81,300–81,700 — Where buyers must prove their strength The longer short-term averages cluster around this region. Reclaiming it and holding above it would provide stronger evidence of improving momentum. If price stalls here, the rebound may remain only a temporary relief move. WHAT WOULD MAKE A TRADE SETUP MORE CONVINCING? A potential LONG scenario needs support to hold, a higher low to develop, and price to reclaim resistance with stronger participation. A potential SHORT scenario becomes more credible if BTC breaks the recent low or rallies into resistance and fails to continue. Volume matters, too. In this snapshot, the latest volume sits below the displayed MA5 and MA10 volume averages. A breakout without stronger participation deserves extra caution; increased volume accompanying a confirmed move would provide more useful evidence. THE TAKEAWAY The most important question is not whether Bitcoin will rise or fall next. It is which side can prove its strength first. I would rather wait for confirmation than enter because a candle looks promising. Mark the invalidation level before considering a trade, manage risk carefully, and remember that no chart pattern guarantees the outcome. #ByXIMPACT #MyByXTake #MidtermsMarketWatch #FOMCRateDecision #FOMCMinutes:Hawkish $BTCUSDT $SOLUSDT