SULTAN
Crypto Influencer
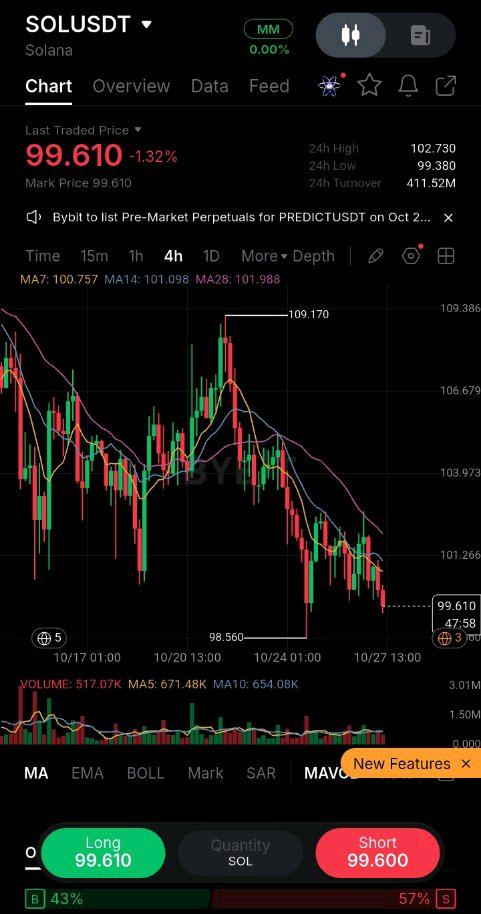
Here is the ByX post based on the chart provided. --- SOL/USDT: The 98.56 Retest Is the Only Thing That Matters Right Now What caught my attention on this 1H chart isn't the -1.32% drop to 99.610. It’s the specific way price is hugging the lower boundary of this recent decline. We had a sharp rejection from the 109.170 swing high, followed by a cascade of lower highs. But look at the recent price action: SOL printed a low of 98.560 and has since bounced, yet it’s struggling to push back above the 28 MA at 101.988. This isn't a clean trend continuation; it’s a compression zone sitting right on a key demand area. The volume footprint is declining on this consolidation, which tells me sellers are losing conviction, but buyers haven't stepped up with aggression yet. The current price of 99.610 is essentially a no-trade zone for me. The risk/reward here is poor because you are mid-range between the 98.560 floor and the 102.730 ceiling. My Trade Plan: I am not chasing this bounce. I’d rather wait for a clear reaction. · Entry Area: $98.50–$98.80 on a successful retest that holds. · Confirmation: A 1H close back above the 15 MA (100.157) with visible volume expansion. · Invalidation: A firm breakdown below $98.56. If that floor cracks, the next logical liquidity pocket is lower, and the thesis is dead. · Targets: TP1 at $101.20, TP2 at $102.730. If price reclaims $101.988 with strength, the bearish structure breaks. Until then, this is a waiting game. The chart is teaching a classic lesson here: don’t confuse a pause in a downtrend with a reversal. $SOLUSDT #ByXIMPACT
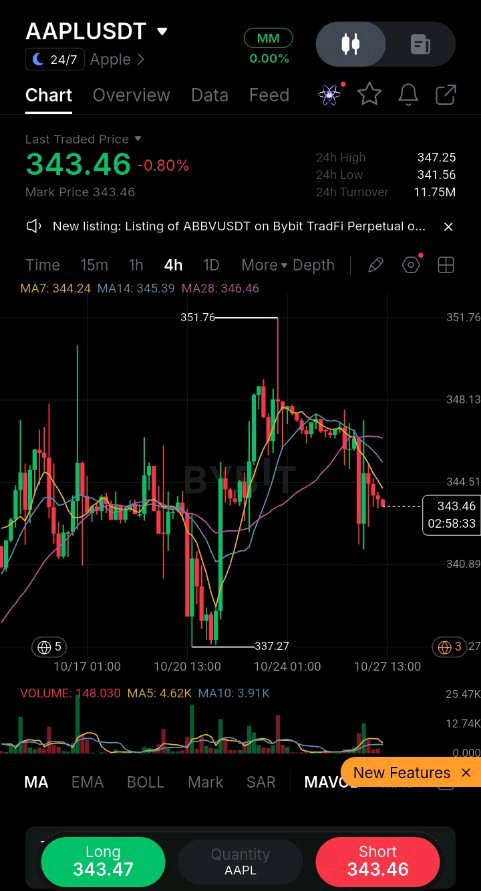
The most interesting part of this AAPLUSDT 4H chart isn’t the recent drop to 343.46; it’s how price is treating the 344.24 level. I initially saw a routine pullback, but looking closer, the market is compressing right at the 7-period MA (344.24) and the 14-period MA (345.39). Price is currently hovering below both, sitting at 343.46 (-0.80%), which tells me buyers are losing the immediate momentum battle. What catches my attention is the structure from the 351.76 swing high down to the 337.27 low. The recovery was sharp, but the subsequent lower high near 348.13 suggests the bounce might lack follow-through. Volume confirms this caution—current volume is 1.48K against a 10-period MA of 3.91K. That’s thin participation, making the current range between 340.89 support and 345.39 resistance feel fragile. For me, the key decision point is 345.39. A clean break and close above that MA cluster would shift my bias back to neutral-bullish, targeting a retest of 348.13. However, I wouldn't chase it here. If price loses 340.89, the 337.27 low becomes the next logical test, and the thin volume suggests a breakdown could accelerate quickly. My plan is to wait. I’d only consider a long if we see a higher low form above 340.89 with volume expansion. Otherwise, the risk/reward is poor. The lesson here is that consolidating below key moving averages with declining volume often precedes a violent move—but direction requires confirmation. $AAPLXUSDT #ByXIMPACT

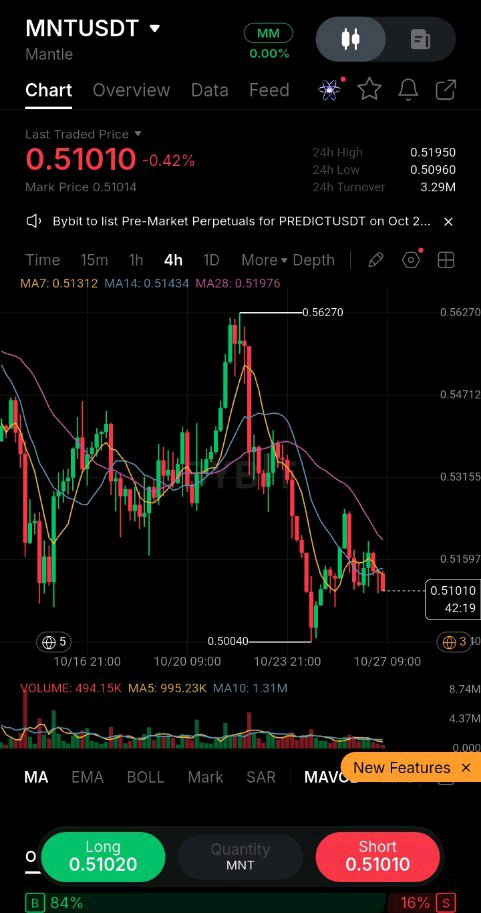
MNTUSDT: The 0.5100 Defense What catches my eye on this 4H chart isn't the recent drop from 0.5627, but how price is behaving right now at the 0.5100 level. MNT had a strong run, peaking at 0.5627, before sellers stepped in and drove it down to a swing low of 0.50040. Since that low, we've seen a steady grind higher. The interesting part is the current consolidation. Price is hugging the 0.51010 mark, holding above the 0.50040 support but struggling to clear the 0.51950 24H high. What I'm watching closely is the moving average structure. The 4H price is currently sandwiched between the MA14 at 0.51434 and the MA28 at 0.51976. The fact that MNT is holding above the 0.50 psychological level despite the recent sell-off tells me buyers are still defending this zone. However, the lack of strong volume (currently 494.15K) on this bounce suggests a wait-and-see approach from the broader market. My Trade Plan: I'm not chasing here. I'd prefer to see a confirmed 4H close above the MA28 (0.51976) to target the previous high of 0.5627. · Entry: A retest of 0.5150 after a breakout confirmation. · Invalidation: A 4H close below 0.50040. If that breaks, the structure shifts bearish. · Targets: TP1 at 0.5300, TP2 at 0.5620. What I'm Watching Next: If price loses 0.50040, I'll be looking for a deeper flush. But if it reclaims 0.51976 with volume, the setup is back on. The lesson here? Chasing a bounce without a structural reclaim is how traders get trapped. Wait for the MA to flip to support. $MNTUSDT #ByXIMPACT

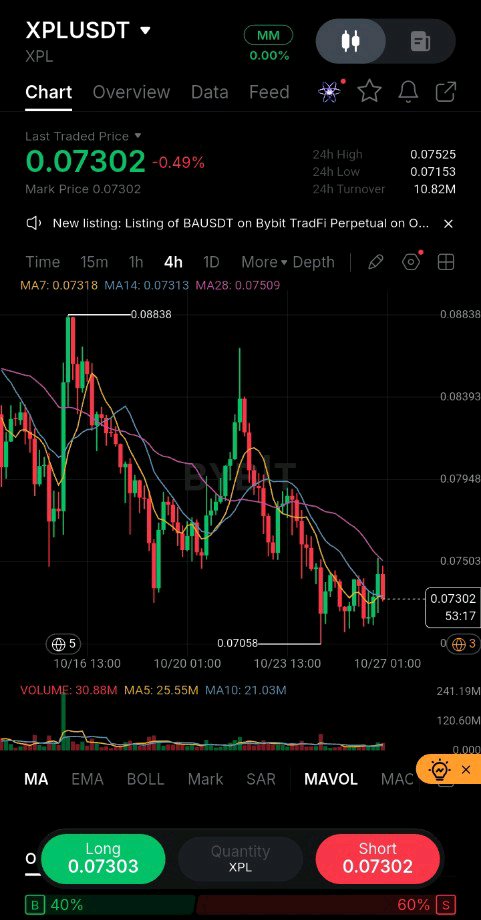
XPLUSDT is at a decision point, and the 0.07153 level is doing all the heavy lifting. What caught my attention on the 4H chart isn't the 0.49% drop to 0.07302 — it's the structure around that recent 0.07058 swing low. Price flushed down to it, got bought back up, and now we’re compressing sideways while the 24H turnover sits at 10.82M. Initially, it looks like a standard downtrend recovery after that 0.08838 peak. But look closer: the MA7 at 0.07318 is flattening out, and price is currently holding above the MA28 at 0.07509. That’s a subtle sign that sellers are losing their immediate grip. The interesting part is the volume. At 30.88M, it’s actually trailing below the MA5 of 25.55M, which tells me the recent downside is losing conviction. We are building a range between the 0.07058 floor and the 0.07525 ceiling. My plan: I wouldn't chase here. The R:R is terrible right in the middle of this range. I’m watching for a confirmed 4H close above 0.07525. If that happens with a volume spike, it opens the door to 0.07948. Conversely, if 0.07058 breaks, I'm out — no heroics. The bottom line: This is a compression zone. The market is forcing a decision, but I’d rather wait for the retest than get chopped up in the middle. $XPLUSDT #ByXIMPACT

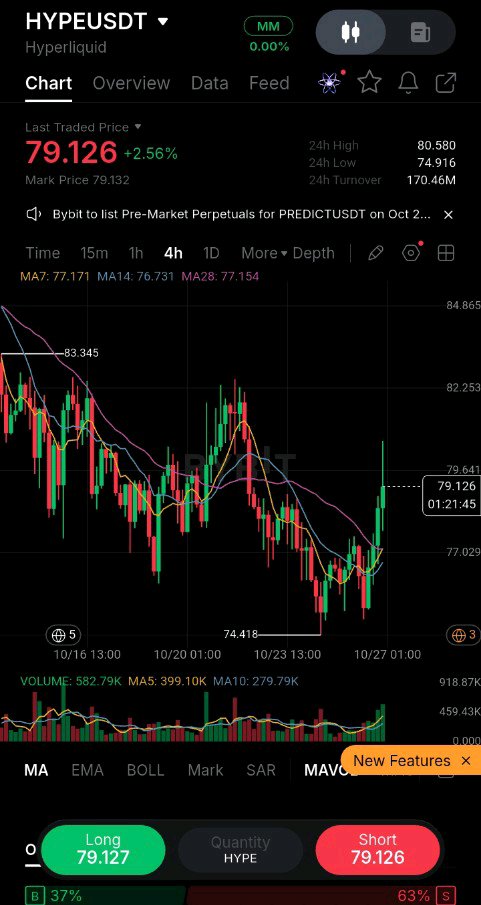
HYPEUSDT: The 79.6 Rejection That Changes the Setup What caught my attention on this 4H chart wasn't the +2.56% bounce to 79.126. It was the fact that price is currently pressing directly into the 79.641 resistance after recovering from the 74.418 swing low. Looking at the structure, the market has been in a clear corrective phase, printing lower highs from the 83.345 and 82.253 peaks. But the recent action shows a potential shift. The 4H MA7 (77.171) and MA14 (76.731) are curving upward, and price is holding above them. That’s a sign of short-term buyer strength. However, here is where I’m skeptical. We are hitting the 79.641 level right as volume is declining. The volume bars are shrinking on this push. In my experience, a low-volume test of resistance often fails, or it leads to a liquidity sweep before a real move. I’m not chasing a breakout here. My Trade Plan: I’d rather wait for a confirmed 4H close above 79.641. If that happens, the target opens up to 82.253. The invalidation for a long would be a drop below the MA7 at 77.171, which would signal that the recovery is losing steam. If price gets rejected here, I’m watching for a retest of 77.02 as a potential support flip. If that fails, the 74.418 low is back in play. The key takeaway? Don’t confuse a bounce with a trend reversal until the structure confirms it. This is a decision point, not a guaranteed entry. $HYPEUSDT #ByXIMPACT

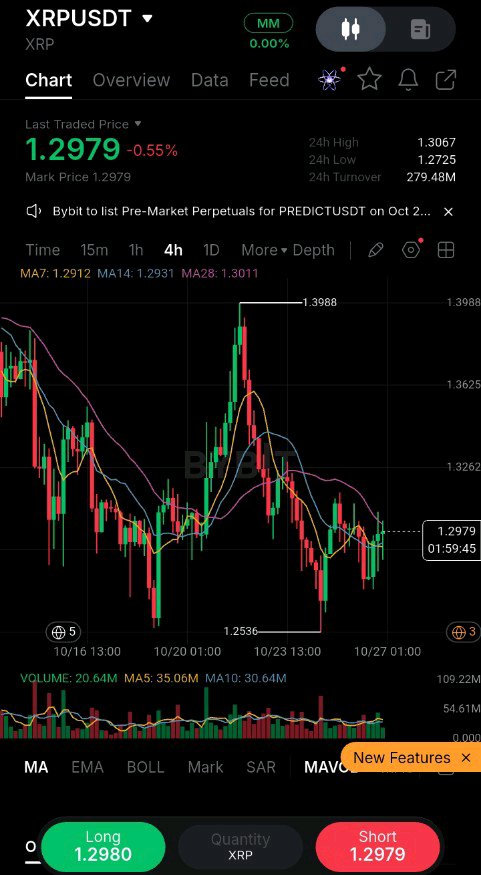
XRP: The 1.30 Rejection Matters More Than the Breakout Everyone is watching for XRP to break 1.39. But I’m looking at the 1.25 floor. XRP is currently sitting at 1.2979, down 0.55%, squeezed between a recent swing high of 1.3988 and a stubborn support base at 1.2536. On the 4H chart, the price action looks like a classic range, but the volume profile tells a different story. Look at the moving averages: MA7 is at 1.2912 and MA14 is at 1.2931. Price is literally trapped between them. The real signal isn't the potential breakout above 1.39. It's the persistent defense of the 1.25–1.26 zone. Buyers have stepped in here multiple times, but notice how the bounces are getting shallower. The volume bars are shrinking, and the MA5 volume is barely holding above the MA10. This isn't accumulation; it's exhaustion. I’d rather wait for a retest than chase a breakout. If price pumps to 1.39 on this weak volume, it’s a trap. My trade plan: · Setup: Wait for a retest of 1.25–1.26 with a bullish rejection candle (hammer/doji). · Confirmation: A strong 4H close back above 1.30 with volume expansion. · Invalidation: A daily close below 1.2536. That breaks the range and opens 1.11. · Targets: TP1 at 1.39. TP2 at 1.45. If we lose 1.25, the entire structure collapses. The lesson here: a breakout without volume is just a liquidity grab. Don't be the exit liquidity for someone else's trade. $XRPUSDT #ByXIMPACT

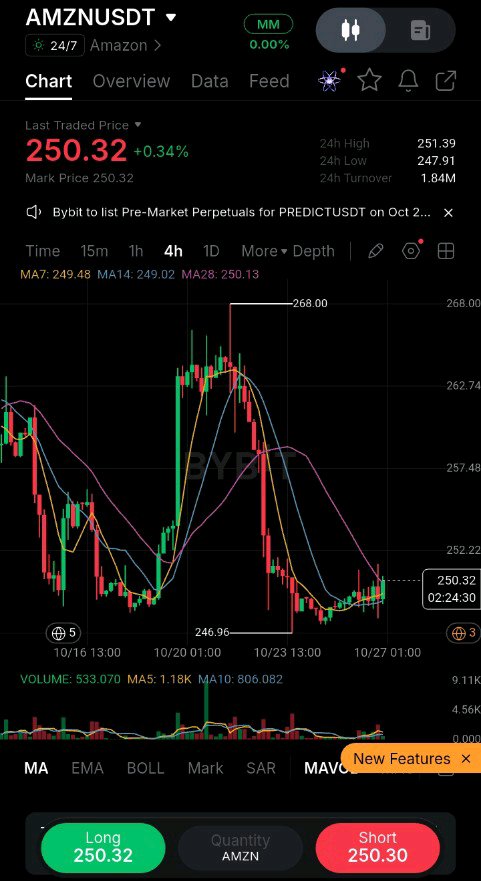
I initially noticed the 250.32 print on AMZNUSDT and expected to see a continuation of the recent sell-off. But after looking closer, the more interesting part is the hesitation below 251.39. The 4H structure tells the story. Price rejected 268.00 hard, printed a sharp lower high, and swept down to 246.95. That sweep wasn't random; it tapped the demand zone and produced a strong reaction back toward the MA28 at 250.13. Now price is compressing between the 247.91 low and the 251.39 high, and that compression matters because it's happening right at the moving average cluster. What I'm watching: the 249.48 MA7 is flattening while the MA14 at 249.02 and MA28 at 250.13 sit just above. That's a lot of resistance stacked in a tight area. For me, the key level is 251.39. A 4H close above that, followed by a successful retest, would confirm the higher low and open the path back toward 257.48. Until then, this is just a bounce inside a broken structure. My concern here is the volume. The green bars on the recovery are noticeably smaller than the red bars on the drop, which suggests buyers aren't fully committed yet. If price loses 246.95, the thesis weakens and I'd expect another leg lower. I wouldn't chase this bounce before confirmation. $AMZNXUSDT #ByXIMPACT

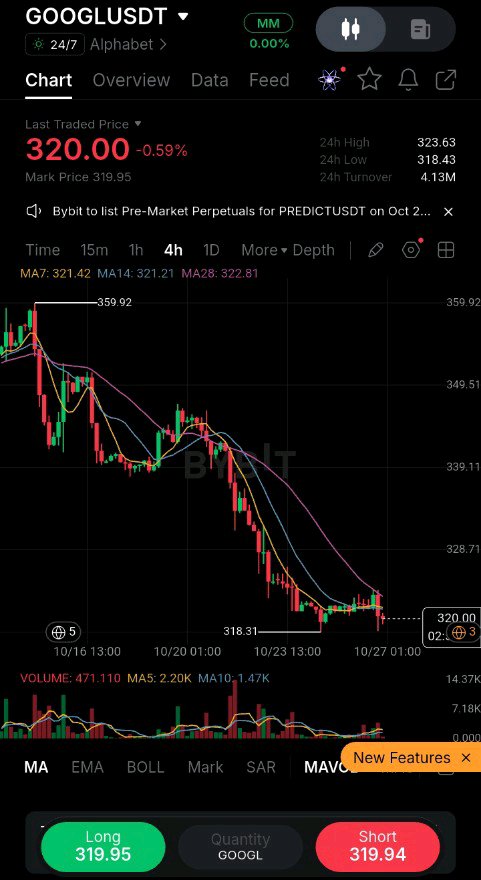
GOOGLUSDT – The 318 Floor Is Getting Interesting What caught my attention on this 4H chart isn’t the -0.59% drift to 320.00. It’s the way sellers keep testing the 318.31 low and failing to break it cleanly. We’ve seen this level defended before, and price is now compressing right above it. That’s a story worth watching. The structure is clearly bearish from the 359.92 swing high. Lower highs, lower lows, and the MA stack confirms it: MA7 at 321.42, MA14 at 321.21, MA28 at 322.81. Price is trading below all three, so rallies are still being sold. But here’s the nuance — the 318 area is acting like a floor. Volume around this recent basing is modest (411K vs. MA5 at 5.2M), not the aggressive selling you’d expect if a real breakdown were loading. That divergence between price action and volume is what I’m watching. I’m not chasing a short into support. The risk/reward is poor down here. My plan is conditional: · Long trigger: A 4H close above 322.81 with follow-through, targeting 328.71 first, then 339.11. Invalidation below 318.31. · Short trigger: Only if price breaks and closes below 318.31, with a retest that rejects. Then 315 becomes the first target. The key insight: 318 is the decision point. Sellers have had multiple chances to break it and haven’t. That doesn’t mean it won’t break — it means the market hasn’t proven it yet. For me, waiting for confirmation here beats guessing direction. $GOOGLXUSDT #ByXIMPACT

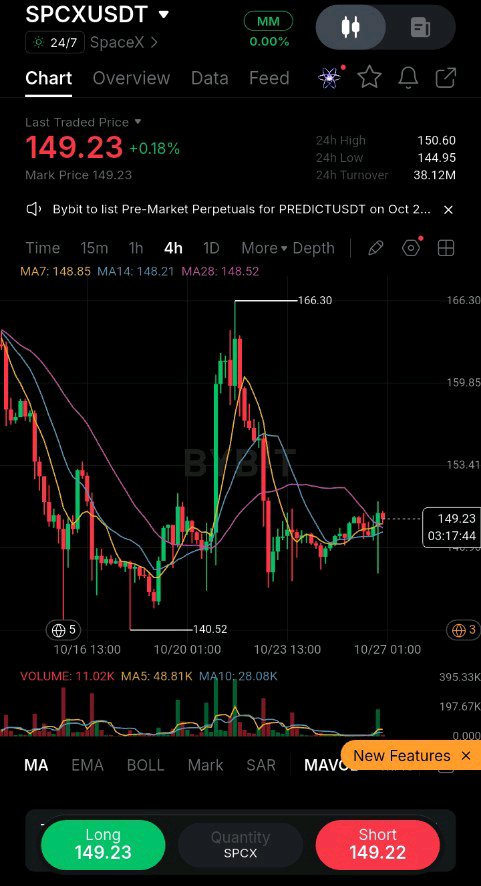
SPCXUSDT: The 148.52 Line in the Sand I was looking at the 4H chart for SPCXUSDT, and the most interesting part isn’t the recent bounce from 140.52—it’s how price is currently trapped under the moving averages. Right now, we are sitting at 149.23, up 0.18% in the last 24 hours. The market structure is recovering, but it’s facing immediate friction. After the massive drop from the 166.30 peak, buyers stepped in aggressively near 140.52, forming a local higher low. That’s a good sign for bulls. However, the recovery has stalled right into the MA cluster. The 28-period MA at 148.52 and the 14-period MA at 148.21 are acting as a tight ceiling. I wouldn’t chase this long right here. The volume profile is thinning out as we approach this resistance, showing a lack of aggressive buying pressure to reclaim the trend. My Trade Plan: For me, the key is the 148.50 level. If price can break and close above the MA cluster on the 4H, it sets up a potential retest of the recent high at 166.30. I’d look for a long entry on a confirmed retest of 148.50 as support, targeting 153.41, then 159.85. If we lose the recent higher low at 145.00, the setup invalidates, and a sweep back toward 140.52 becomes the likely scenario. What I’m Watching Next: It’s a game of patience. The chart is showing a classic recovery that needs a catalyst to break the 148.50 ceiling. Until then, it’s just a range between 140.50 and 148.50. $SPCXXUSDT #ByXIMPACT

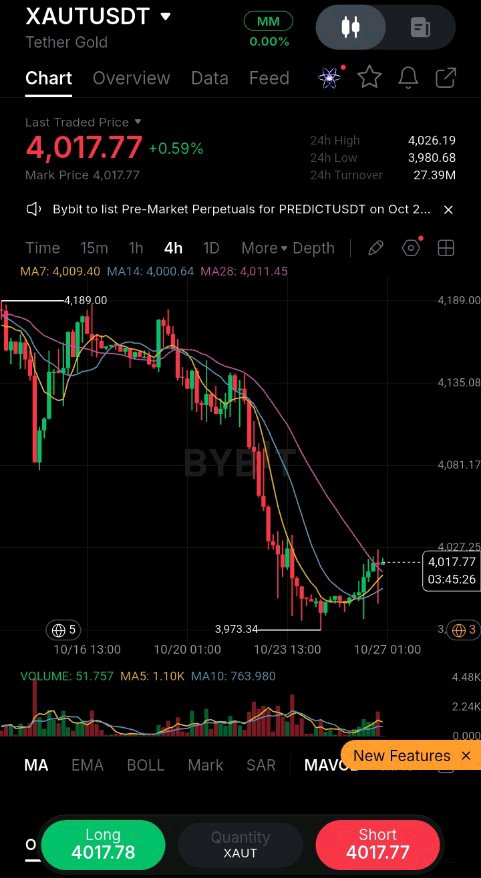
The first thing that caught my eye on this 4H XAUT chart isn't the bounce—it's how violently the market rejected $4,189. That wasn't a normal pullback; it was a structural breakdown that dragged price all the way down to $3,973 before buyers finally stepped in. What I find more interesting now is the recovery. Price is currently sitting at $4,017, up 0.59%, but look at the moving averages. The MA7 ($4,009) and MA14 ($4,000) are starting to flatten out, yet the MA28 at $4,011 is acting like immediate overhead friction. Price is basically sandwiched between short-term recovery momentum and the heavier 28-period average. This isn't a clean trend yet. It’s a relief bounce inside a broken structure. The volume profile confirms this—the recent green candles lack the aggressive volume expansion we saw during the sell-off. That tells me buyers are hesitant to chase above $4,020 without confirmation. My concern here is chasing this bounce prematurely. The real decision point is the $4,050–$4,080 zone. If price can break and close above $4,080 with volume, I’d look for a retest of that level as support to target $4,135. However, I wouldn't touch it right now. The risk/reward is poor at $4,017 because you're buying directly into moving average resistance. If price loses the $3,973 swing low, the entire recovery thesis is invalidated, and I’d expect a flush toward $3,950. For me, the trade is waiting for either a confirmed breakout above $4,080 or a retest of the $3,973 demand zone with a clear rejection candle. The middle is just noise. $XAUTUSDT #ByXIMPACT

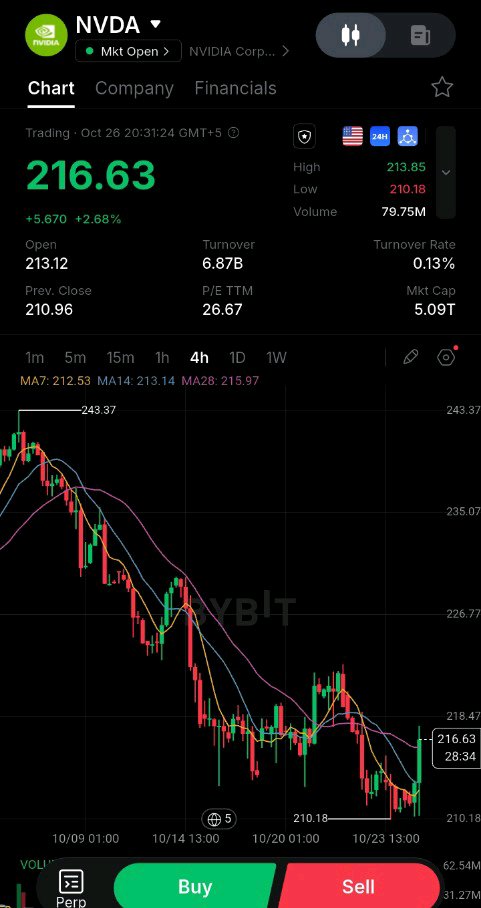
NVDA: The 4H Chart Is Sending a Clear Warning, Not a Buy Signal What caught my attention on this NVDA 4H chart isn’t the +2.68% bounce to 216.63. It’s the fact that price is currently trapped directly underneath a cluster of major moving averages. Look closely at the levels. The MA7 sits at 212.53, the MA14 is at 213.14, and the MA28 is right at 215.97. Price is wedged right into this dynamic resistance. The market structure is still technically bearish. We saw a sharp drop from the 243.37 local high down to a low of 210.18. The current green candles represent a relief bounce, but buyers haven't broken any higher highs. They are just testing the floor of the previous breakdown. My concern here is the lack of volume confirmation. The turnover sits at 6.87B, which isn't exactly signaling aggressive institutional accumulation at this level. I wouldn’t chase this bounce. The risk/reward is poor until we see a definitive close above the MA cluster. If I were planning a trade, I’d want to see a 4H candle close above 216.00 to prove buyers have absorbed the selling pressure. If that happens, a retest of 226.77 becomes the logical target. Conversely, if price rejects here and loses the 210.18 low, the bearish continuation is confirmed. $TSLAXUSDT #ByXIMPACT

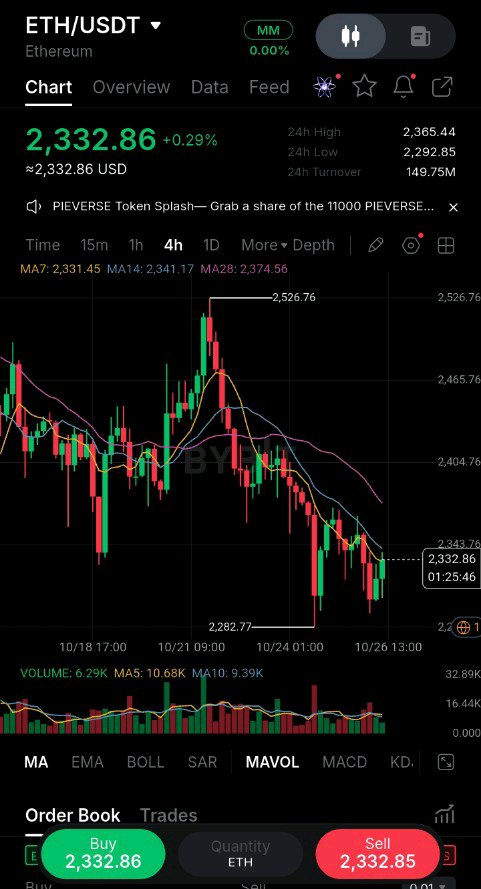
The most interesting part of this 4H ETH/USDT chart isn’t the drop from 2,526; it’s how price is behaving at the 2,282 floor. We had a clean structural breakdown from the mid-2,400s, but instead of accelerating lower, ETH is showing exhaustion. Look at the recent candles: buyers are aggressively defending this 2,282 level, forming a short-term base. We’re currently hovering at 2,332, but the bounce lacks conviction. The volume profile confirms this—the recent green candles have noticeably less volume than the sell-off that preceded them. This tells me we’re in a compression zone, not a confirmed reversal. The market is catching its breath, but sellers haven't fully relinquished control. My Trade Plan: I wouldn't chase this bounce right now. The risk/reward is poor in the middle of this range. · Bullish Trigger: I need to see a 4H close above the 2,374 MA cluster. If that happens, I’d look for a retest of that level as support to target 2,450. · Bearish Scenario: If price loses 2,282 on a closing basis, the base collapses. My invalidation is a 4H close below 2,280, which opens the door for a sweep of lower liquidity. The key lesson here is learning to distinguish between accumulation and a dead-cat bounce. Right now, the lack of buying volume suggests patience is the best position. $ETHUSDT #ByXIMPACT

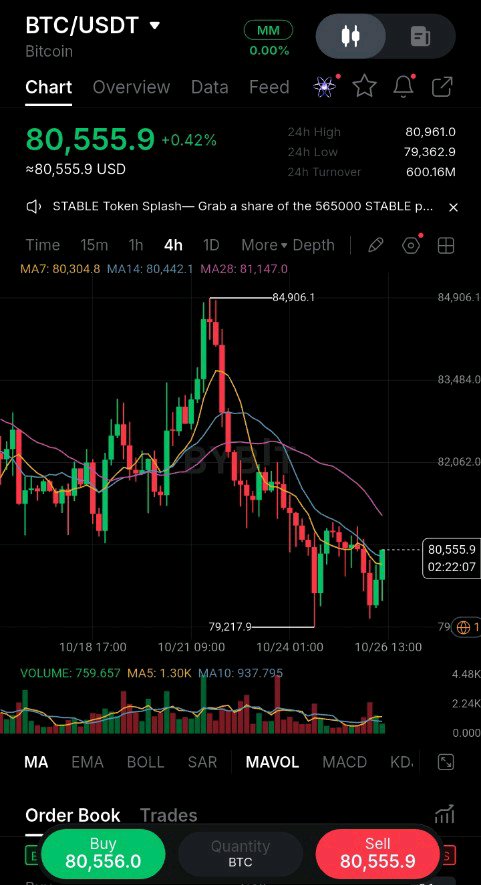
The 79.2K Sweep Was the Real Story What caught my attention on this 4H BTC/USDT chart wasn't the bounce itself, but the failure right before it. Price spent days bleeding lower from the 84.9K swing high, and the initial breakdown to 79,217 looked like a clean continuation short. But that 79,217 print got bought aggressively, and now we're sitting at 80,555 — back inside the prior structure with a +0.42% green candle that closed well off its low. That matters because sellers had their chance to extend the move and didn't take it. The 79.2K level now acts as a failed breakdown, which often shifts the burden of proof to the bears. Here's my honest read: we're still consolidating after a sharp impulse down, not trending cleanly. The MA cluster at 80,442 (MA14) is the immediate pivot. A 4H close above it would suggest the sweep has run its course and open a path toward the 81,147 MA28 and the supply shelf near 82,000. My plan: I'm not chasing green candles here. I'd rather see a retest of 79.8K–80.1K hold, with a higher low forming, before considering a long. Invalidation is a clean break below 79,217 — if that goes, the failed-breakdown thesis dies and lower lows are back on the table. First target 81,147, second 82,000. The lesson: a wick below support that gets reclaimed is often smarter money than the candle itself. Watching how price handles that MA cluster in the next few hours. $BTCUSDT #ByXIMPACT

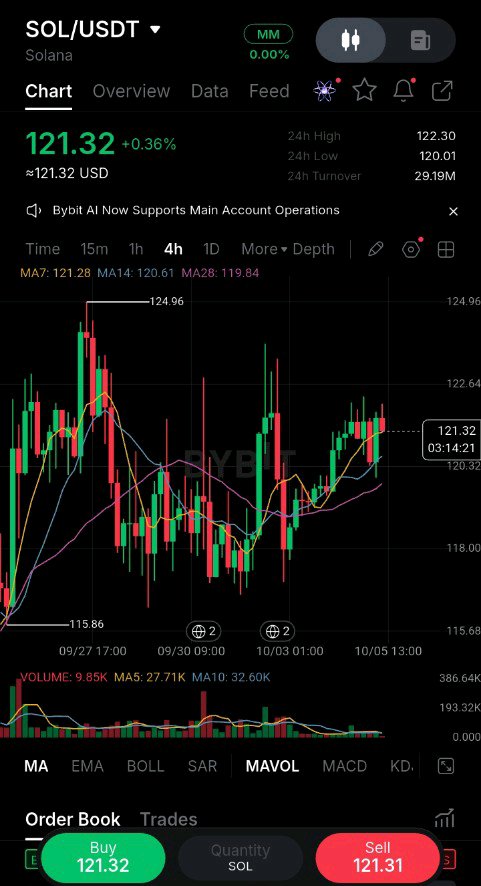
SOL is coiling under $122, but the volume tells the real story. What caught my attention on this 4H chart isn't the +0.36% move to $121.32. It's the volume profile at the bottom. We're looking at 9.85K in current volume against a moving average of 27.71K. Price recovered from the $115.86 swing low and pushed back up, but it did so on fading participation. That's a classic divergence between price and conviction. Looking at the structure, SOL is wedged between the $124.96 swing high and the $120.01 session low. The moving averages are telling a specific story: the MA7 at $121.28 and MA14 at $120.61 are flat, while MA28 at $119.84 is acting as a slow floor. Price is literally pinned between these lines. This isn't a trend. It's compression. The interesting part is the 24H high at $122.30. Every time price approaches that zone, buyers step back. We saw a rejection there recently, and until we reclaim it with volume expansion, this remains a range-bound game. My plan: I'm not chasing this mid-range chop. I'd rather wait for a clean break and close above $122.30 to target the $124.96 liquidity pocket. If that happens with volume above 27K, I'd look for a retest entry toward $123.00. Invalidation is clear: a 4H close below $119.84 kills the bullish structure and opens the door back to $115.86. The lesson here? Price movement without volume is just noise. Chasing a +0.36% green candle in a compressed range is how traders get chopped up. $SOLUSDT #ByXIMPACT
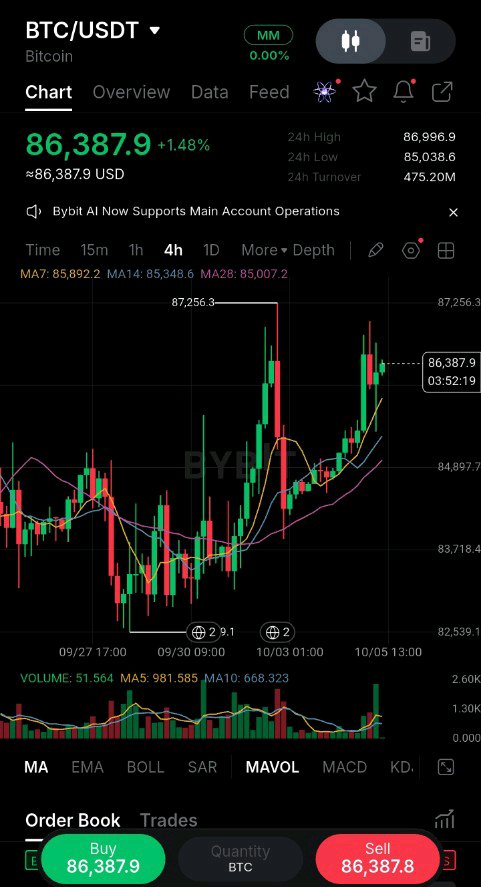
BTC/USDT: The 87K Breakout Looks Great, But I'm Not Chasing Yet BTC is pushing $86,387 on the 4H chart, up 1.48% and pressing into new local highs after that clean reclaim from the $82,500 zone. On the surface, it looks like a textbook breakout. Price swept the 09/30 lows, built a higher low, then ran straight through the 87,256 swing high. But the part that catches my eye isn't the move itself—it's the structure underneath it. Look at the 24H range: 85,038 low to 86,996 high. We're trading near the top of that, but the candles are getting smaller as we approach 87,256. The MAs are stacked bullishly (MA7: 85,892, MA14: 85,348, MA28: 85,007), which confirms trend, but the volume on this last leg isn't screaming conviction. That's my concern. I'd rather wait for one of two things: either a clean 4H close above 87,256 with volume expansion, or a pullback that holds 85,300–85,500 as support. That second option is the higher-quality trade for me—better R:R, clearer invalidation. If price loses 85,000, the breakout thesis weakens fast and we're likely back in the range. My plan: Watching for a retest entry at 85,400–85,600. Invalidation at 84,800. TP1 at 87,250, TP2 at 88,500. Risk/reward roughly 1:2.5 if it plays out. Not perfect, but acceptable. The lesson here: breakouts without volume are often traps. Confirmation matters more than $BTCUSDT #ByXIMPACT

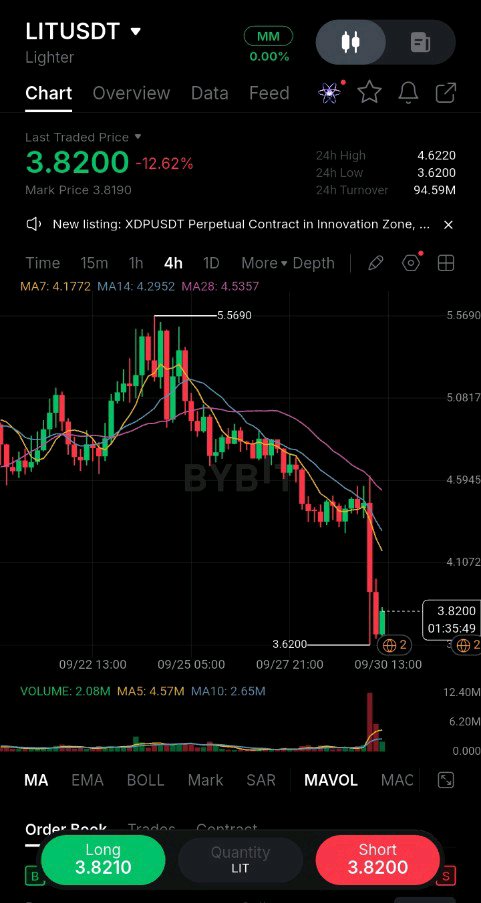
LITUSDT: The 12% Drop Everyone Saw Coming (But Nobody Wanted to Hear) I’ll be honest—when I first looked at this LIT chart, my eyes went straight to that massive -12.62% candle. It’s ugly, sure. But the more interesting part isn't the drop itself; it's where price is sitting right now. Let's look at the structure. LIT had been grinding lower with lower highs since the 5.56 peak back on 09/25. The 4H chart shows a clear breakdown from the 4.10–4.20 range. But here’s what actually caught my attention: the current price is 3.820, and we are sitting directly on a critical support shelf that dates back to the 3.62 swing low from 09/27. The volume spike on this recent dump is notable (2.08M vs the 4.57M MA), but it hasn't broken the 3.62 floor yet. That tells me sellers are aggressive, but they haven't fully won. The MA7 (4.17) and MA14 (4.29) are now acting as overhead resistance, confirming the bearish momentum. My Trade Plan: I’m not chasing this short. The risk/reward is poor down here at 3.82. Instead, I’m waiting for a reaction. · Bullish trigger: If price reclaims 4.10 with volume, I’d look for a relief bounce toward 4.40. · Bearish trigger: A clean 4H close below 3.62 opens the door to 3.40. · Invalidation: Any strong reclaim of the 4.29 MA14 kills the bearish thesis. The lesson here? Don’t let a big red candle blind you to the level. 3.62 is the line in the sand. If it holds, we chop. If it breaks, we bleed. $LITUSDT #ByXIMPACT
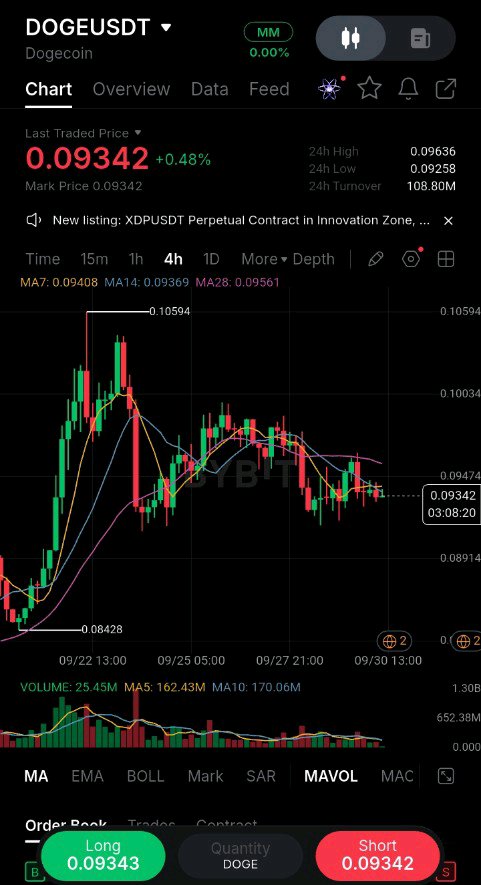
DOGEUSDT: The 4H Compression Before the Decision What caught my attention on this 4H DOGEUSDT chart isn’t the -0.48% daily move — it’s where price is sitting relative to the moving averages. DOGE is trading at 0.09342, pinned right below the MA7 at 0.09408 and MA14 at 0.09369. The MA28 sits higher at 0.09561. That’s a cluster of resistance directly overhead, and price is failing to reclaim it. Look at the structure. We printed a swing high at 0.10594, then a series of lower highs. The recent low at 0.08428 was bought up, but the bounce has been weak. Volume tells the story: current volume is 25.45M against an MA5 of 162.43M. Buyers simply aren’t showing up with conviction. This isn’t a breakdown yet, but it’s not a bullish reversal either. It’s compression beneath resistance — a decision point. My trade plan: · Long trigger: A 4H close above 0.09408 with volume expanding past 100M. That would put the MA28 at 0.09561 in play as TP1. · Invalidation: A clean loss of 0.09250 opens the door back to 0.08914, with 0.08428 as the deeper support. · Short trigger: Rejection at 0.09408 with a lower high formation. Right now, I’d rather wait. The risk/reward for a long here is poor because you’re buying directly into resistance with declining volume. The lesson: Don’t confuse a bounce with a breakout. A move from 0.08428 to 0.09342 looks impressive, but until DOGE reclaims its moving average cluster, sellers still control the structure. $DOGEUSDT #ByXIMPACT

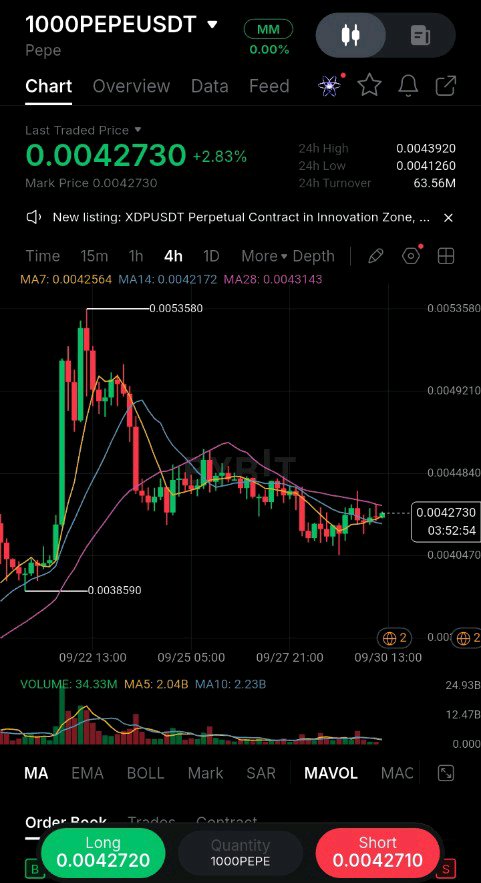
1000PEPE: The 4H Compression Nobody Is Talking About Most traders are staring at the -2.83% red candle on 1000PEPE and calling it a pullback. But the 4H chart tells a more interesting story. Look at the structure. Price ran to 0.0053580, got rejected hard, and flushed down to 0.0038590. Since that low, we haven't made a lower low — we've been building a tight compression between 0.0041260 and 0.0043920. That's not random chop. That's the market deciding where the next leg goes. What catches my eye is the MA behavior. The 4H MAs are flattening: MA7 at 0.0042564, MA14 at 0.0042172, MA28 at 0.0043143. Price is sitting right on top of them, which means the moving averages have caught up to price — a classic compression signal. Volume is also drying up at 34.33M on the visible bar, down from the spike during the drop. Sellers are losing conviction. My read: this is a decision point, not a trend. The range is 0.0041260 to 0.0043920. I'm watching for a 4H close above 0.0043920 to confirm a breakout toward 0.0046000. Invalidation is a clean break below 0.0041260, which opens the door back to 0.0038590. I wouldn't chase this mid-range. The edge comes from waiting for either a confirmed breakout with volume or a retest of the range low that holds. Right now, R:R is only attractive near the boundaries. The lesson: compression doesn't tell you direction — it tells you a move is coming. Your job is to let the market prove which side it's on before risking capital. $PEPEUSDT #ByXIMPACT
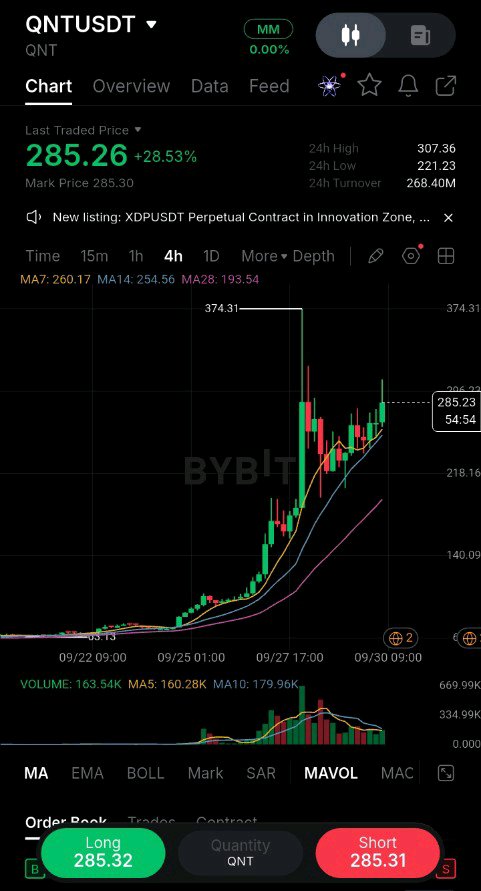
QNTUSDT: The 374 Breakout and the Retest That Matters QNT is up 28.53% to 285.26, but the real story isn't the green candle—it's the structure that formed after the 374.31 spike. What caught my attention was the violent rejection from 374.31 and how price has since settled into a tight consolidation between 270 and 307. Most traders see a pullback and immediately look for the next leg up. But look closer at the volume: the massive green bars that drove the breakout are gone. Volume has dropped to 163.54K against a moving average of 160.28K. That tells me the initial impulse is cooling, and the market is now deciding whether this is a healthy reset or a distribution phase. The 24h range is 221.23 to 307.36, which is a massive 86-point spread. That volatility is a trap for anyone chasing green candles right now. I'd rather wait for a clean retest of the 285–290 zone to hold as support. If buyers defend that area and we see a higher low form, the next logical target is a retest of 307, then 374. But here's my concern: if price loses 270, the structure weakens, and a sweep of the 221 low becomes likely. That's the invalidation for any long thesis. For me, the trade is conditional. I'm not entering until I see a confirmed higher low above 280 with volume expansion. If that happens, TP1 is 307, TP2 is 340. Risk is defined by a close below 270. The lesson here? A 28% move doesn't mean you chase. It means you wait for the market to prove it can hold the new range. $QNTUSDT #ByXIMPACT
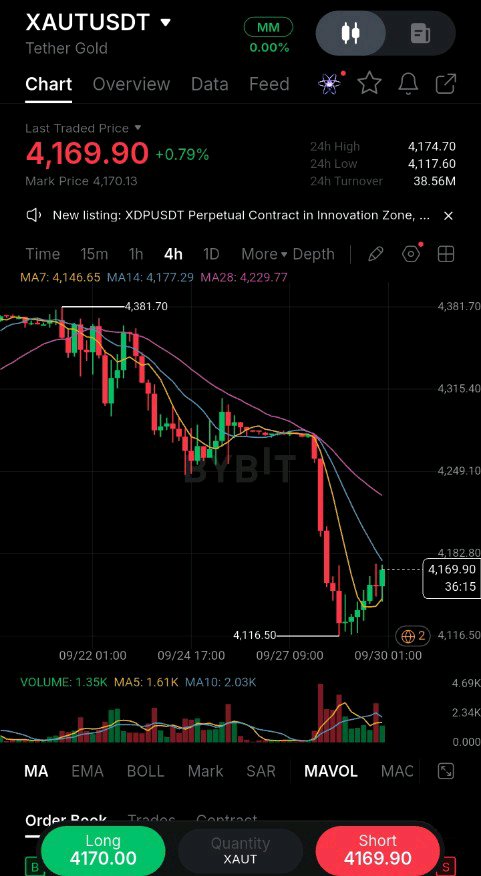
XAUUSDT: The 4,116 Floor Is Doing All the Work Right Now What caught my attention on this 4H chart isn't the bounce — it's where the bounce stopped. XAUUSDT printed a sharp drop from the 4,381 swing high down to 4,116.50, and that low is now the level that matters. Price is trading at 4,169.90, up 0.79%, but look at the structure: we're still making lower highs, and the 4H moving averages are stacked bearishly above price — MA7 at 4,146.65, MA14 at 4,177.29, MA28 at 4,229.77. The recovery candle is green, but it's sitting directly under the MA14, which is the first real test. Here's the part I find interesting: volume on the sell-off into 4,116.50 was visibly heavier than the volume on this bounce. That tells me the down move had participation, while the up move is still tentative. This isn't a confirmed reversal — it's a relief bounce inside a broken structure. Key levels I'm watching: · Resistance: 4,177 (MA14), then 4,229 (MA28) · Support: 4,146 (MA7), then the 4,116.50 swing low · Breakdown trigger: a 4H close below 4,116.50 My plan: I'm not chasing this green candle. I'd rather wait for either a reclaim and close above 4,177 with follow-through, or a retest of 4,116 that holds with a higher low. If 4,116.50 breaks, the next logical magnet is the 4,050–4,060 area. Invalidation: Loss of 4,116.50 on a closing basis kills the bounce thesis. The lesson here: A bounce into overhead MAs after a high-volume drop is often a decision point, not a bottom. Confirmation beats anticipation. $XAUTUSDT #ByXIMPACT