BTCHOLDER
𝐂𝐫𝐲𝐩𝐭𝐨 & 𝐌𝐚𝐫𝐤𝐞𝐭 𝐀𝐧𝐚𝐥𝐲𝐬𝐢𝐬 📊 𝐓𝐞𝐜𝐡𝐧𝐢𝐜𝐚𝐥 𝐀𝐧𝐚𝐥𝐲𝐬𝐢𝐬 | 𝐏𝐫𝐢𝐜𝐞 𝐀𝐜𝐭𝐢𝐨𝐧 🎯 𝐇𝐢𝐠𝐡-𝐏𝐫𝐨𝐛𝐚𝐛𝐢𝐥𝐢𝐭𝐲 𝐒𝐞𝐭𝐮𝐩𝐬 🛡️ 𝐑𝐢𝐬𝐤 𝐌𝐚𝐧𝐚𝐠𝐞𝐦𝐞𝐧𝐭 𝐅𝐢𝐫𝐬𝐭 🧠 𝐃𝐢𝐬𝐜𝐢𝐩𝐥𝐢𝐧𝐞 • 𝐏𝐚𝐭𝐢𝐞𝐧𝐜𝐞 • 𝐂𝐨𝐧𝐬𝐢𝐬𝐭𝐞𝐧𝐜𝐲 🚀 𝐓𝐫𝐚𝐝𝐞 exp
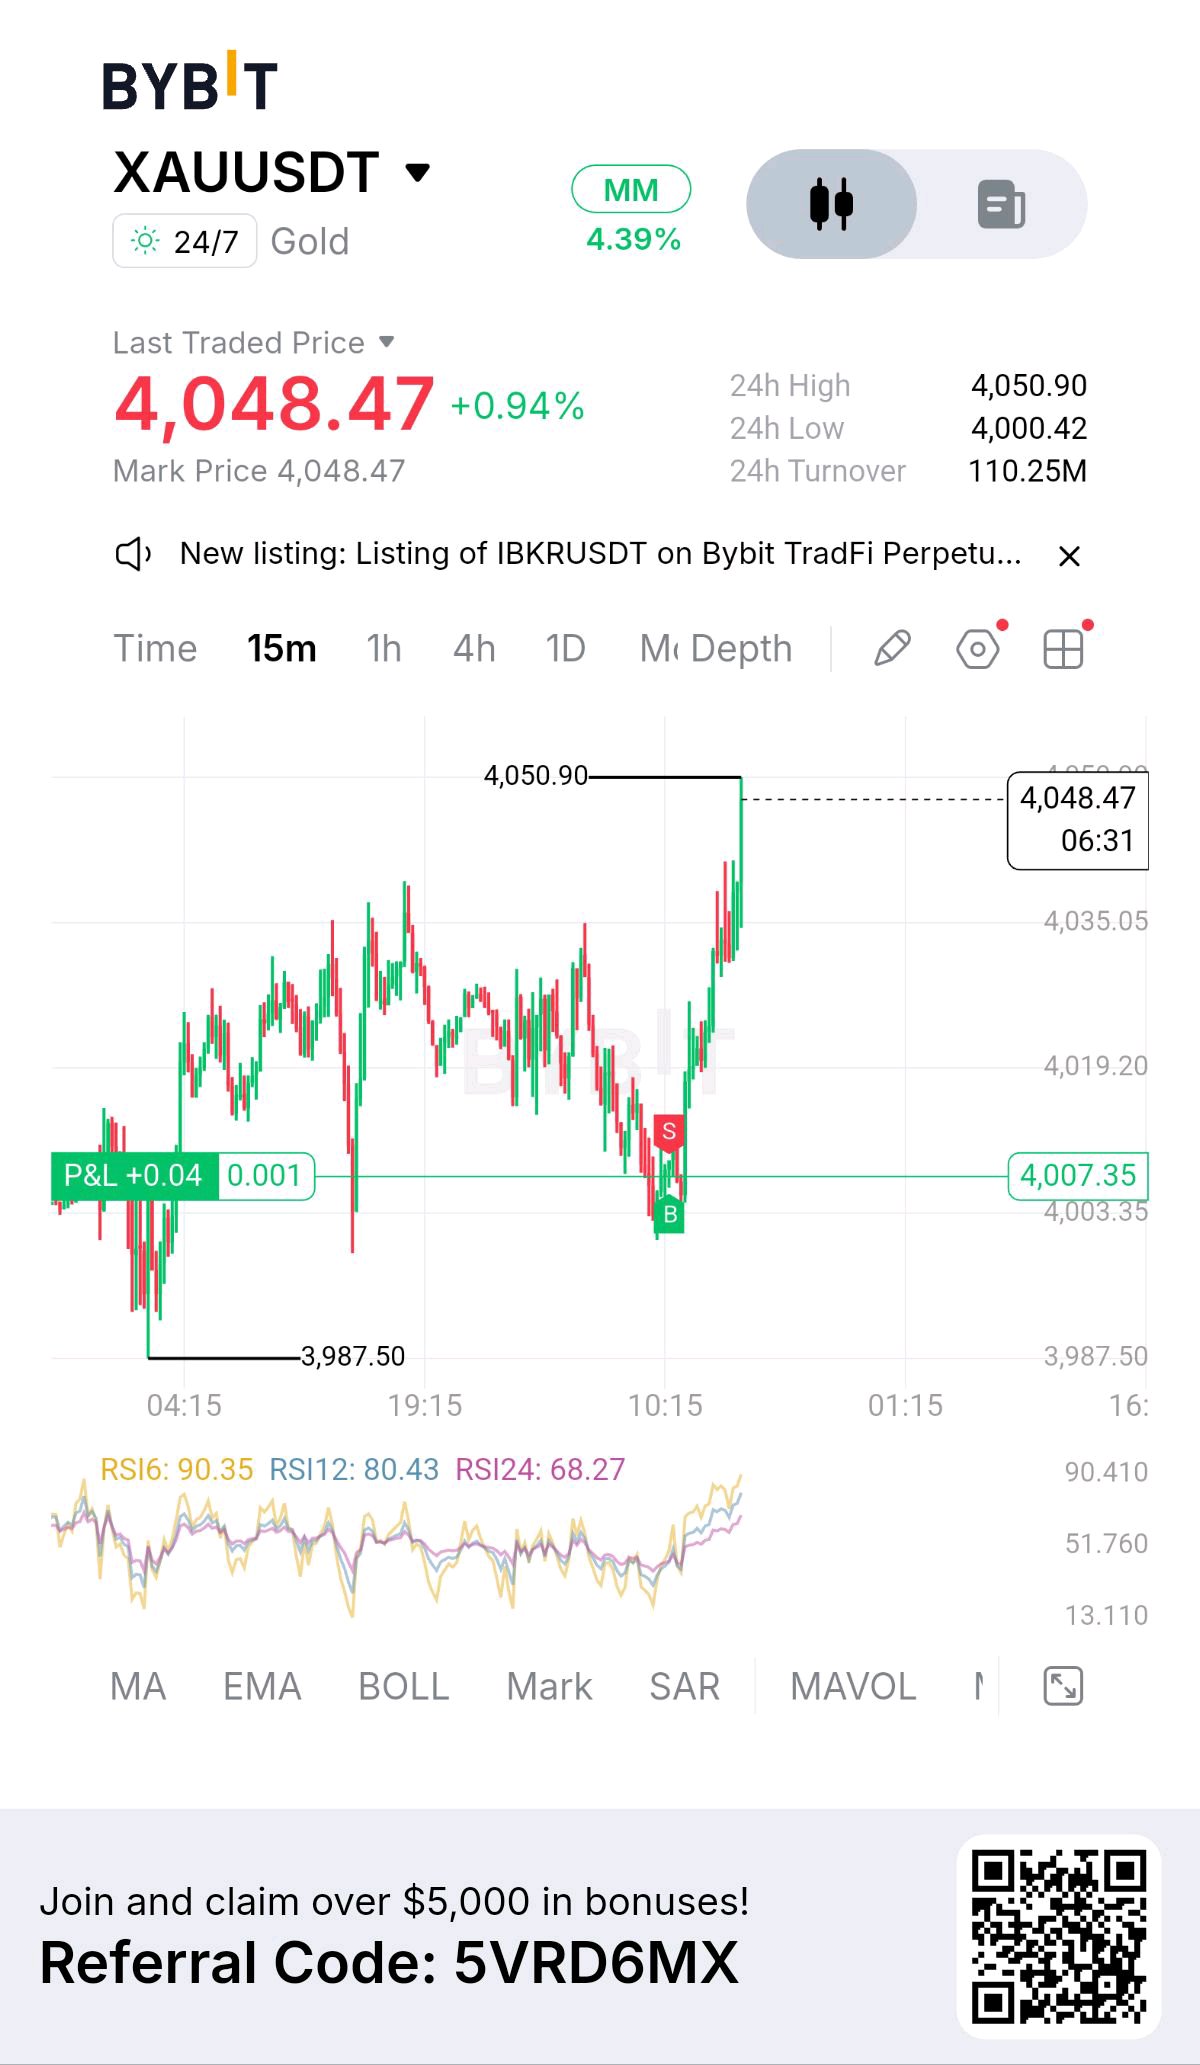
I almost scrolled past $XAUUSDT because the +0.94% move looked ordinary, but the 15m chart caught my attention. Price is sitting at 4,048.47, and we're now approaching the 24h high of 4,050.90. That's the level I'm watching closely. What caught my eye is the recovery itself. Price dropped toward 3,987.50 earlier, then started rebuilding and eventually pushed through the 4,003–4,007 area. Buyers stepped in aggressively, and the latest move has brought price back toward the top of the 24h range. That's a meaningful shift in short-term momentum. But there's something I wouldn't ignore here: the RSI readings. RSI6 is at 90.35, RSI12 at 80.43, and RSI24 at 68.27. Short-term momentum is extremely stretched. That doesn't automatically mean a reversal is coming, but it does tell me chasing this move right below resistance is risky. Turnover is 110.25M, which shows meaningful activity, but the real test is whether buyers can sustain the push above resistance rather than just wick through it. My read: · Bias: Short-term bullish momentum, but approaching a major intraday decision zone. · Bullish trigger: A 15-minute close above 4,050.90, followed by a successful retest → potential continuation toward fresh highs. · Bearish trigger: Rejection around 4,050.90 followed by a loss of 4,035.05 → opens the door for a pullback toward 4,019.20, then 4,007.35. · Invalidation: If price remains trapped below 4,050.90, I don't want to assume the breakout is already confirmed. One lesson I've learned is that a strong recovery and a good entry aren't always the same thing. The move looks impressive, but with short-term RSI this elevated, I'd rather wait for confirmation or a healthier pullback than chase green candles into resistance. Would you wait for a confirmed break above 4,050.90, or do you think sellers will defend this level first? #ByXIMPACT $XAUTUSDT

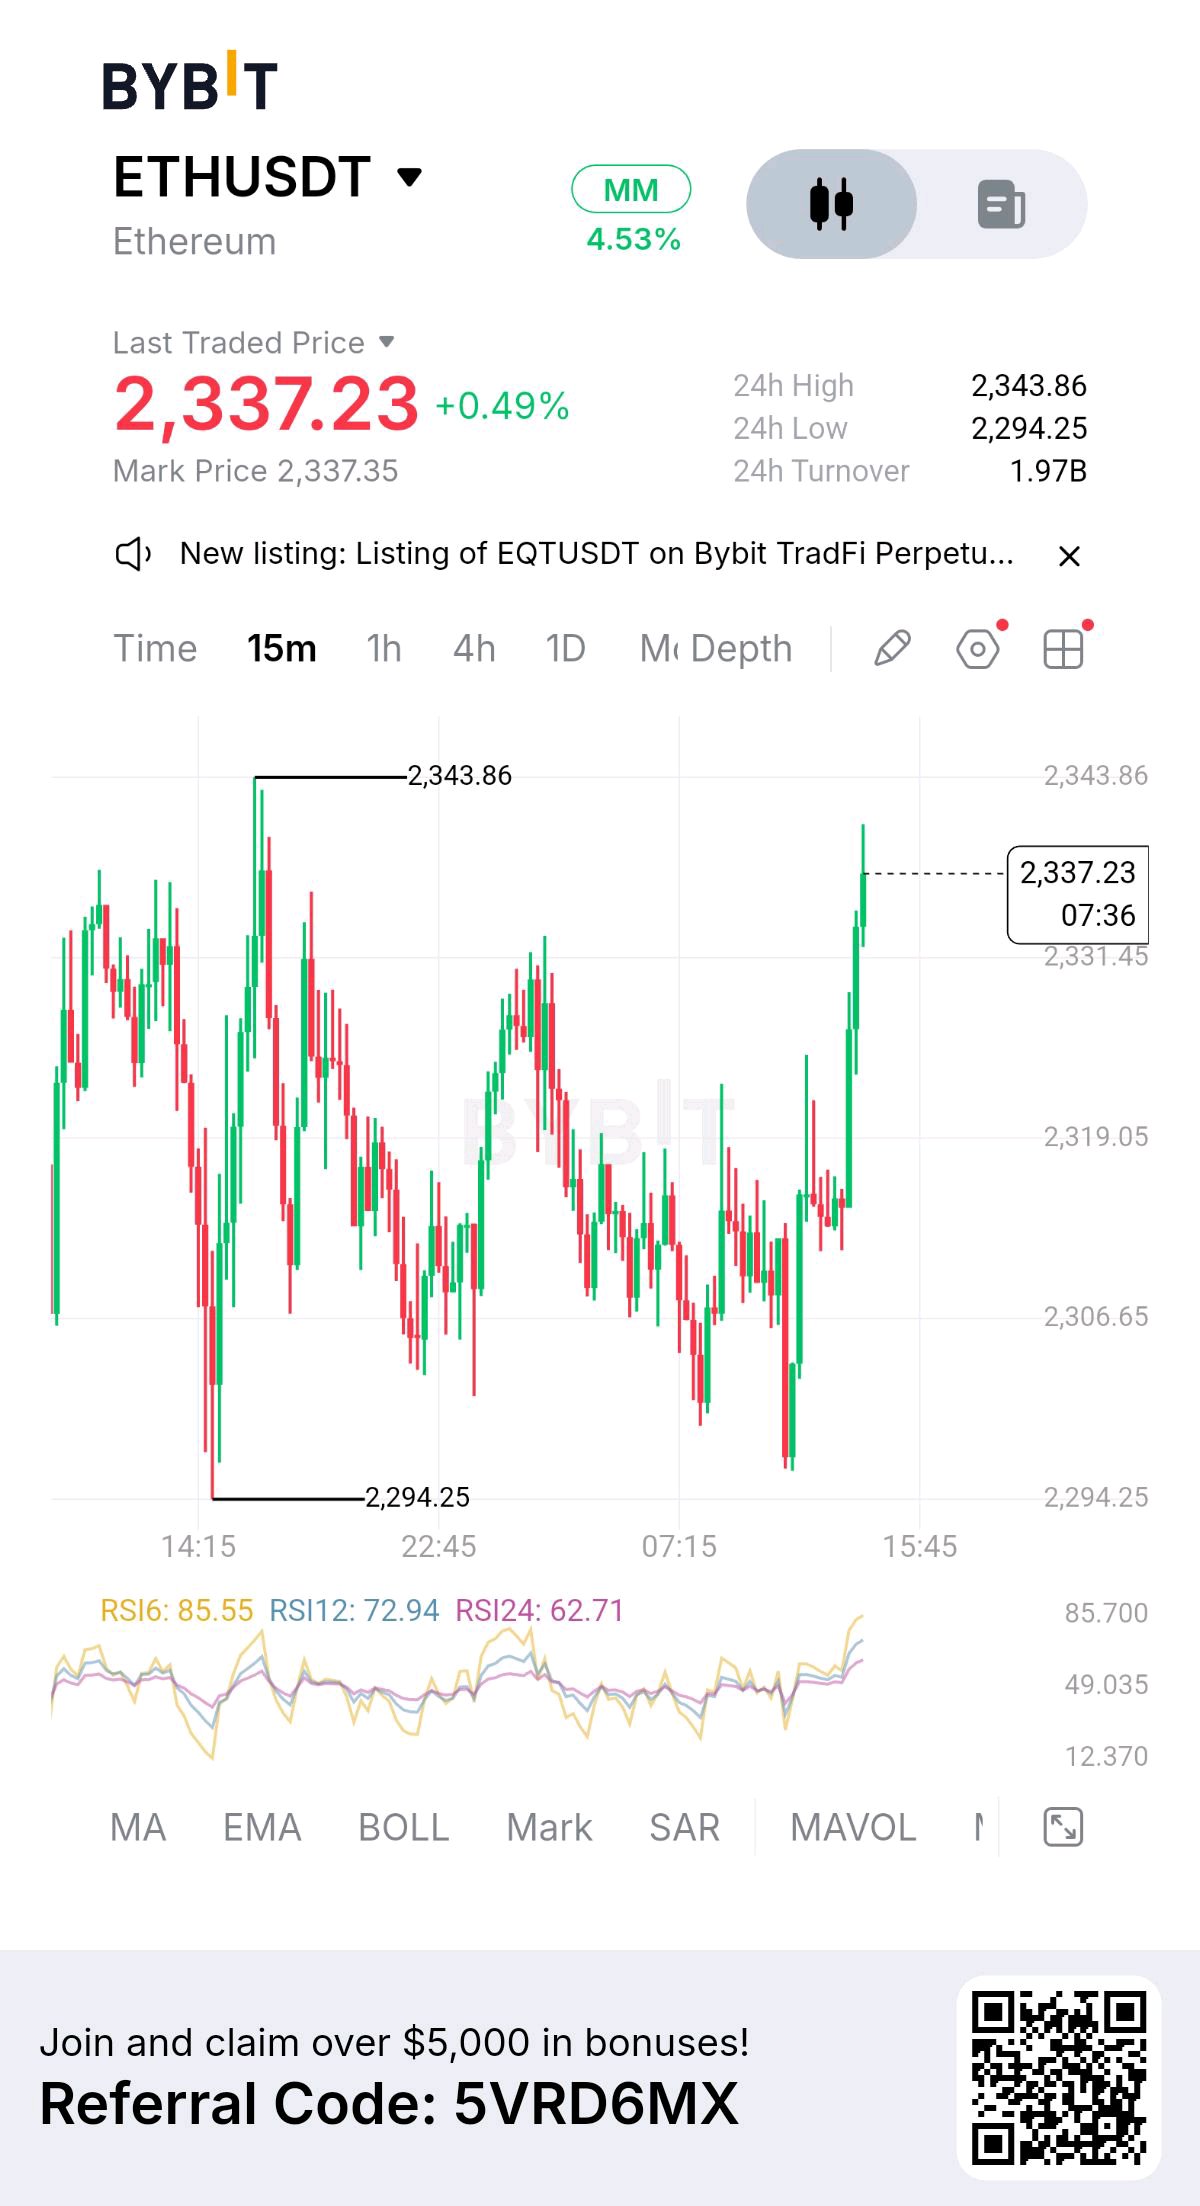
I've been watching $ETHUSDT, and the 15m chart is showing a setup that's worth pointing out. We're currently at 2,337.23, up +0.49%, and the short-term structure has shifted in a way that's worth paying attention to. Price recovered strongly after dropping toward the 2,294.25 low. For most of the session, ETH was moving unevenly, with sellers keeping price under pressure. But the latest move changed the picture. Buyers stepped in aggressively, pushing price from the consolidation area around 2,310–2,315 toward 2,337. That recovery is important, but there's still one level I'm watching closely: 2,343.86. That's the 24H high, and price is now approaching that resistance zone. If buyers can break above it and hold, we could see another leg higher. But if price gets rejected there, this could turn into a short-term pullback rather than a clean breakout. The 24H high is 2,343.86, while the low is 2,294.25. Turnover is around 1.97B, showing substantial market activity, although turnover alone doesn't confirm buying pressure. RSI6 is at 85.55, RSI12 at 72.94, and RSI24 at 62.71. Short-term momentum is strong, but RSI6 and RSI12 are already elevated. That makes me cautious about chasing the move after such a sharp push. My read: · Bias: Short-term bullish momentum, but price is approaching resistance. · Bullish trigger: A 15-minute close above 2,343.86, followed by a successful retest with sustained buying activity → I'll watch for continuation higher. · Bearish trigger: A rejection around 2,343–2,344 followed by a loss of the 2,331 area → could open a pullback toward 2,319 and potentially 2,306. · Invalidation: If ETH keeps moving between 2,319 and 2,344 without clear confirmation, I'm waiting instead of forcing a trade. A lesson I've learned: when price suddenly pushes higher after consolidation, I don't automatically assume the breakout will continue. Strong momentum can attract buyers, but it can also leave late entries exposed to a pullback. I want to see whether buyers can actually defend the breakout, not just push price into resistance. Would you wait for ETH to break above 2,343.86, or are you watching for a pullback and retest first? #ByXIMPACT $ETHUSDT

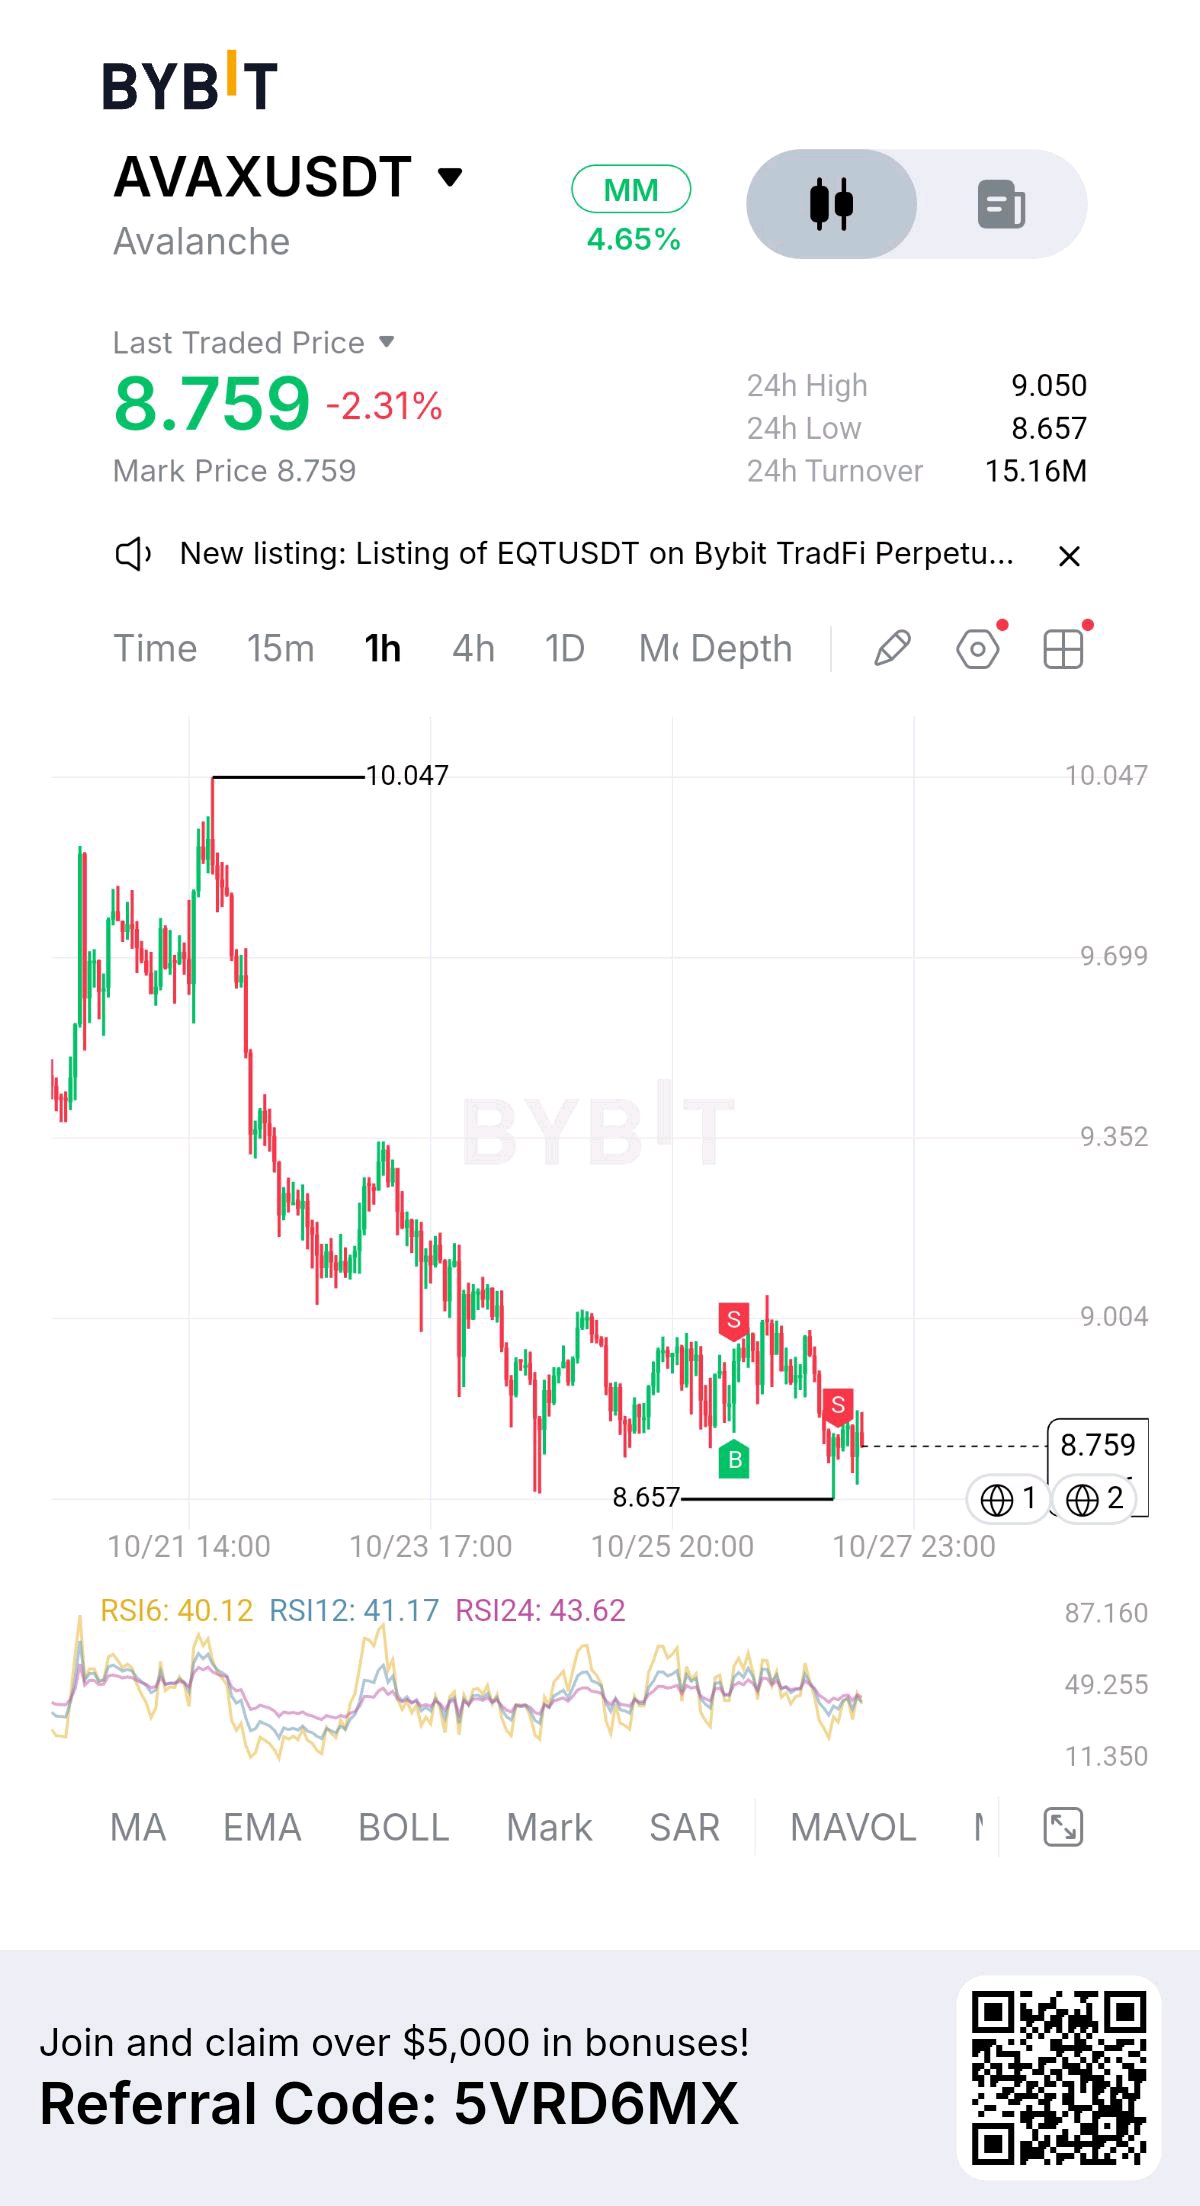
I've been watching $AVAXUSDT, and the 1H chart is showing a setup that's worth pointing out. We're currently at 8.759, down -2.31%, and the bigger picture is still leaning bearish. Price peaked at 10.047, and since then, the structure has been printing lower highs and lower lows. There was a brief recovery attempt, but sellers stepped back in around the 9.00–9.05 zone. That rejection is important because it shows buyers haven't regained control yet. The 24H high is 9.050, while the low is 8.657. Price is now trading closer to that low, and that's the level I'm watching most closely. If 8.657 breaks, we could see another leg lower. But if buyers defend it again, this could turn into a short-term recovery attempt rather than an immediate breakdown. RSI6 is at 40.12, RSI12 at 41.17, and RSI24 at 43.62. Momentum is still weak, with all three readings below 50. We're not seeing a strong bullish momentum shift yet. Turnover is 15.16M, so there's meaningful activity, but I still want confirmation before trusting either direction. My read: · Bias: Bearish to neutral while price stays below 9.00–9.05. · Bearish trigger: A 1-hour close below 8.657 with selling volume → I'll watch for continuation lower, with 8.50 as a psychological level and further downside depending on price action. · Bullish trigger: A reclaim of 9.00–9.05 with volume and a successful retest → could open a recovery attempt toward 9.35. · Invalidation: If price keeps moving between 8.657 and 9.05, I'm waiting instead of forcing a trade. A lesson I've learned: when price keeps approaching support in a downtrend, I don't automatically call it a bounce opportunity. Repeated tests can weaken support, but they don't guarantee a breakdown either. I want to see which side actually takes control. Would you wait for AVAX to break below 8.657, or are you watching for a reclaim of 9.05 first? #ByXIMPACT $AVAXUSDT

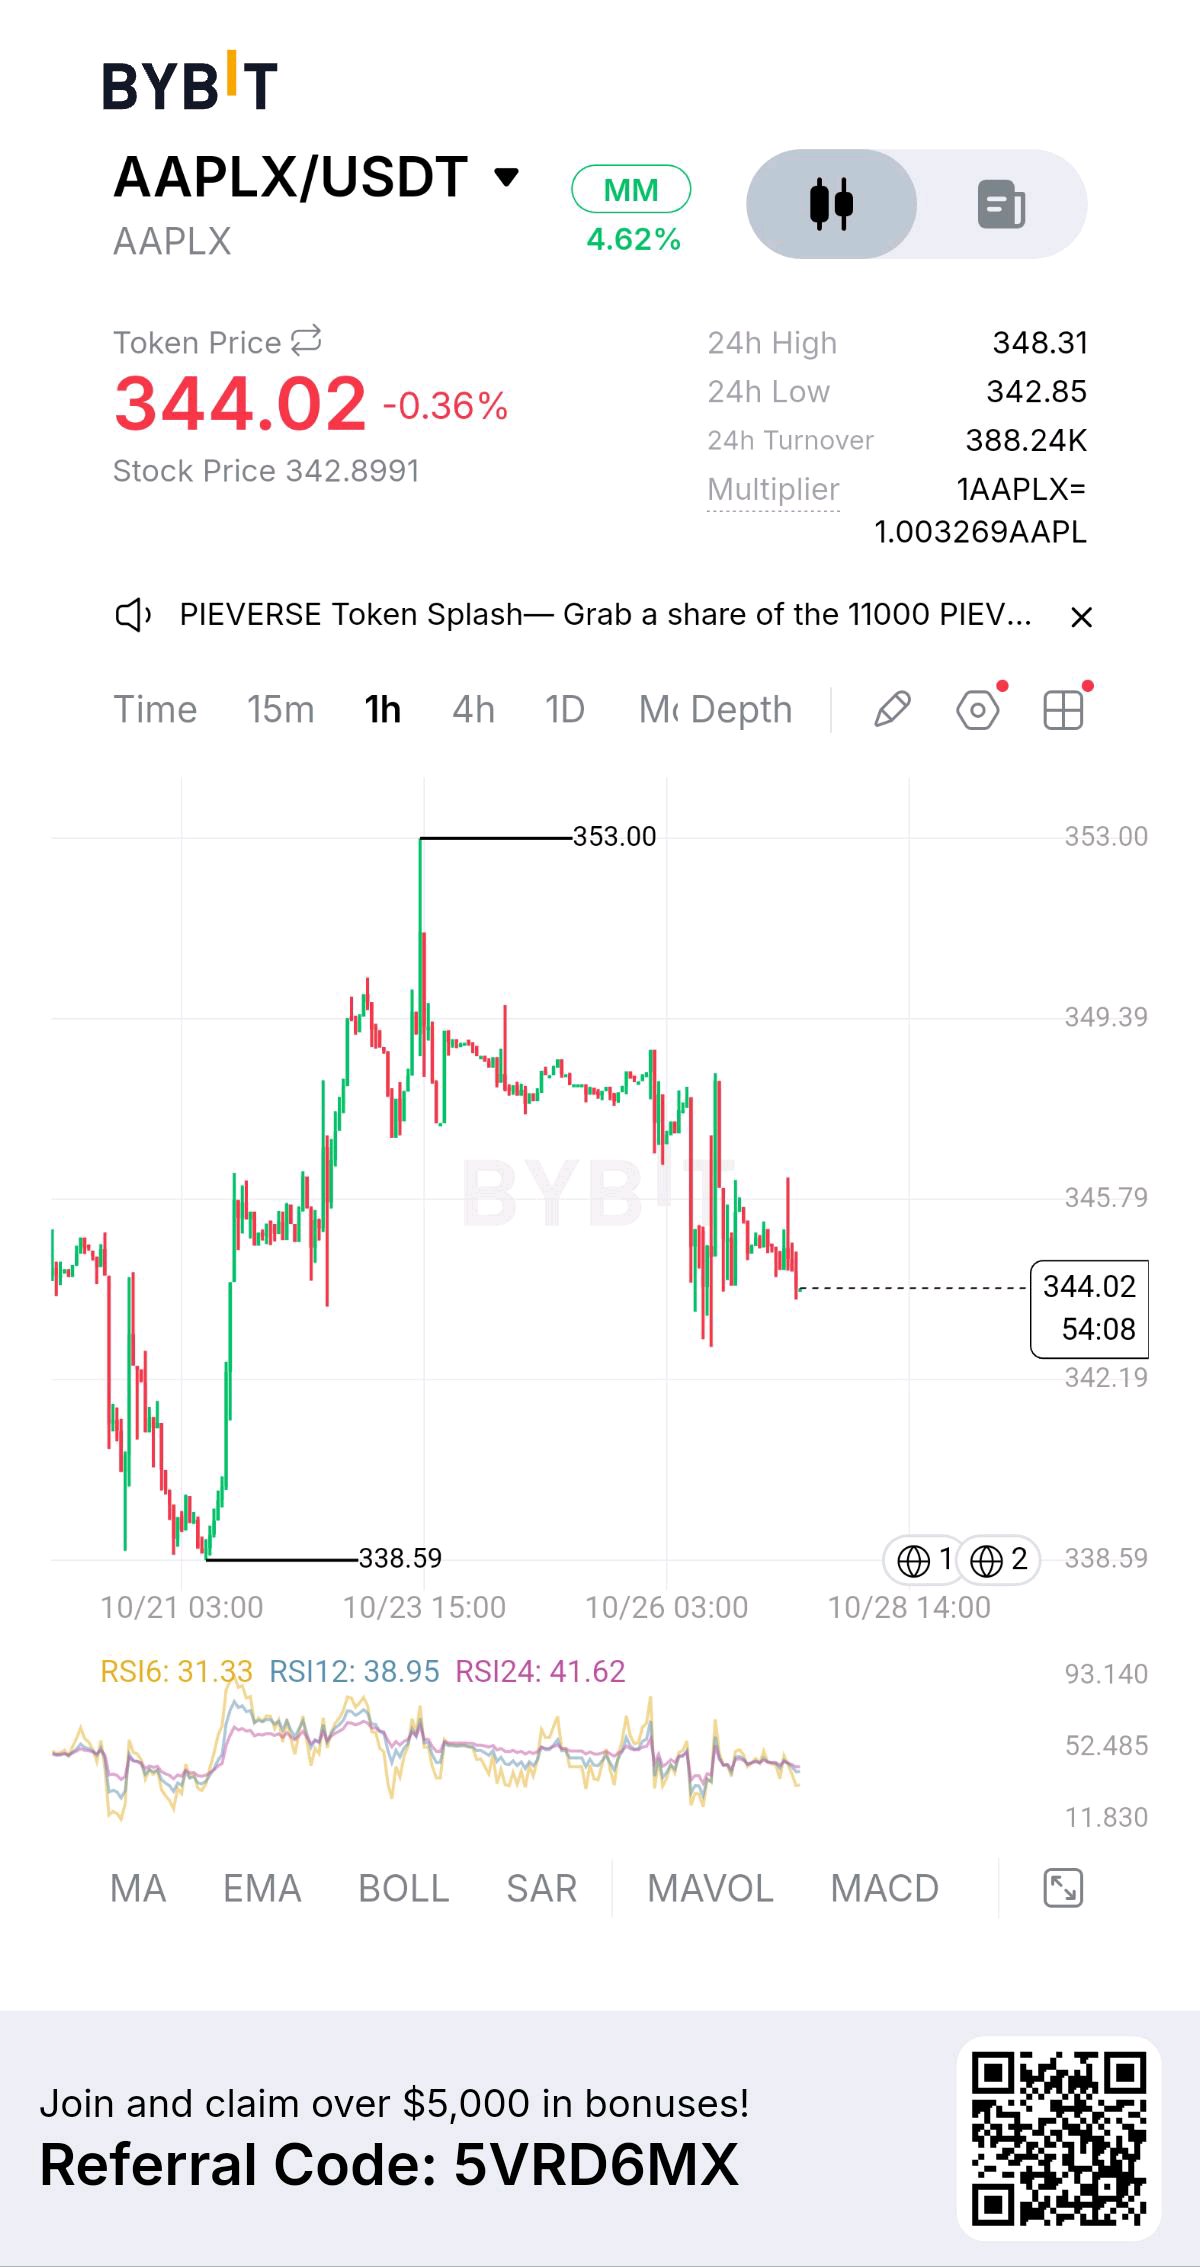
I've been tracking $AAPLXUSDT, and this 1H chart caught my attention. Price recovered from 338.59, pushed toward 353.00, and then lost momentum. Now we're back at 344.02, down -0.36%, and the structure is starting to look weak. The recovery was strong, but buyers couldn't hold the move near 353.00. Price has pulled back, and we're now approaching a critical support zone. Here's what matters. The 24H high is 348.31, while the 24H low is 342.85. The previous chart low sits at 338.59. Those are the levels I'm watching as price decides its next direction. RSI6 is at 31.33, RSI12 at 38.95, and RSI24 at 41.62. Short-term momentum is weak, but that doesn't automatically mean a bounce is coming. Turnover stands at 388.24K. Price action is giving us warning signs, but I still need confirmation before calling a full breakdown. My read: • Bias: Neutral-to-Bearish while below 348.31. • Bullish trigger: A 1-hour close above 348.31 with follow-through → targets 349.39, then 353.00. • Bearish trigger: A 1-hour close below 342.19 → could expose 338.59. • Invalidation: A confirmed reclaim above 353.00 would weaken the current bearish structure. One lesson I keep learning from charts like this: a strong recovery doesn't mean the market has finished correcting. The rejection near 353.00 matters, and now the reaction around 342.85–342.19 could tell us whether buyers are ready to defend or sellers are preparing another move down. Would you buy a confirmed breakout above 348.31, or wait for the pullback toward 342.85? #ByXIMPACT $AAPLXUSDT

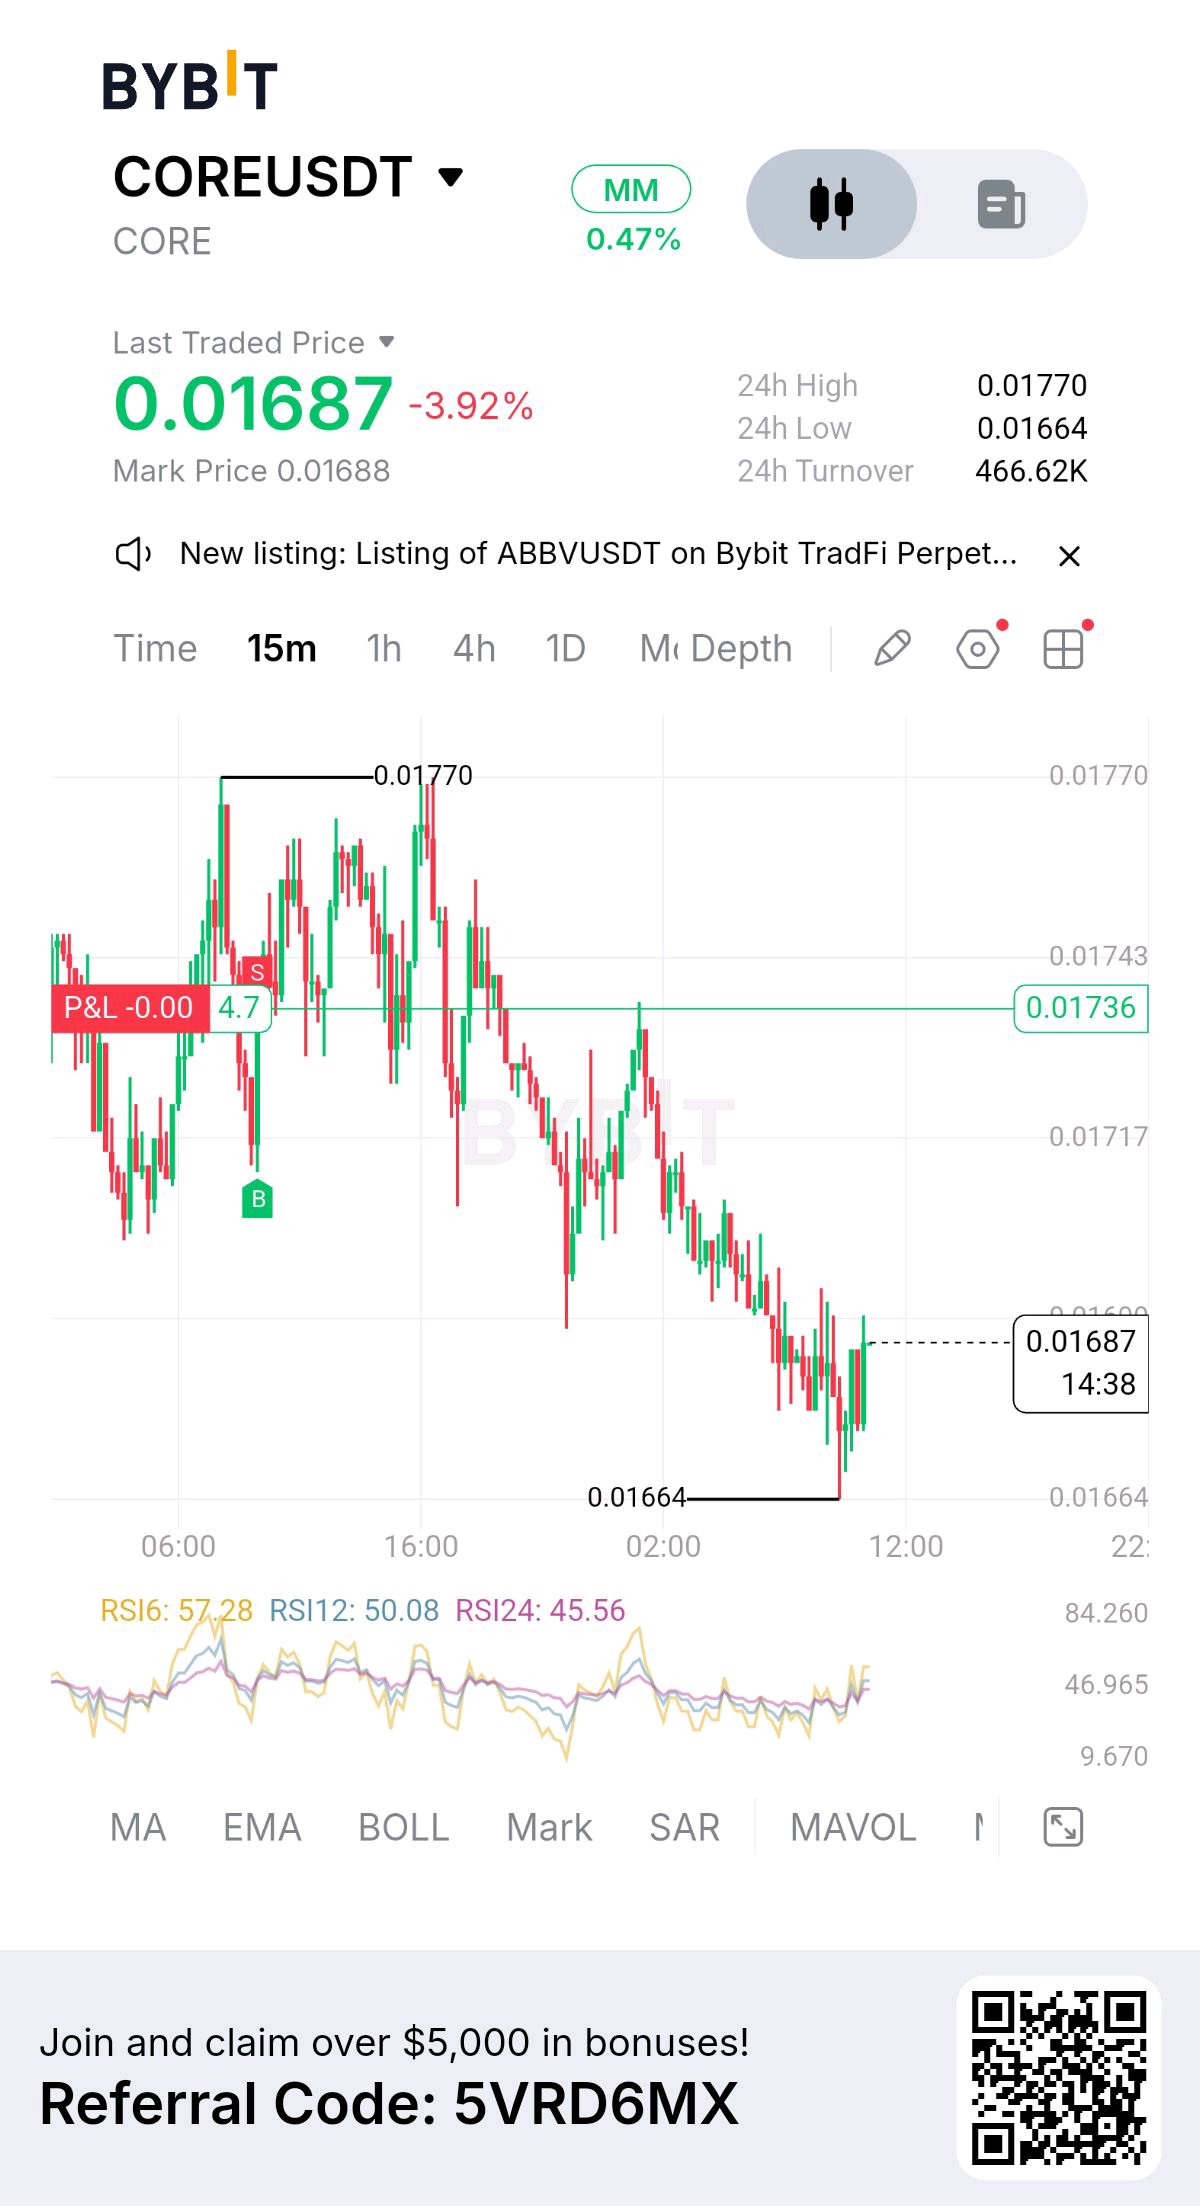
I almost scrolled past this chart, but something caught my attention. $COREUSDT has been under consistent selling pressure on the 15-minute timeframe, and the latest move is telling an interesting story. Price is currently at 0.01687, down 3.92%, after falling from the 0.01770 high to a session low of 0.01664. Sellers have controlled most of the recent structure, with lower highs and lower lows forming as price moved downward. But here's what I'm watching closely: after reaching 0.01664, buyers started pushing back. Price has bounced from that low, and RSI6 is now at 57.28, while RSI12 sits at 50.08. RSI24 remains lower at 45.56. This shows short-term momentum is recovering, but the broader momentum picture has not fully turned bullish yet. The recovery is worth watching, but I don't want to confuse a bounce with a confirmed reversal. Here's what matters. The 0.01664 level is the immediate floor. If buyers continue defending it, CORE could attempt to recover toward 0.01700, followed by the marked 0.01736 level. A stronger move could bring the 0.01770 high back into focus. However, if price loses 0.01664 and selling pressure increases, the recovery attempt could fail and bearish momentum may continue. My read: • Bias: Neutral-to-bearish while price remains below 0.01736. • Bullish trigger: A clean 15-minute close above 0.01700, followed by a successful reclaim of 0.01736, would strengthen the recovery case. • Bearish trigger: A decisive break below 0.01664 would signal that sellers are regaining control. • Confirmation: Watch volume and the candle closes. RSI recovery alone isn't enough to confirm a trend reversal. One lesson I keep learning from charts like this: the first bounce after a sell-off can look convincing, but the real test is whether buyers can reclaim resistance and hold it. Until that happens, I would rather wait for confirmation than chase a green candle. Would you buy CORE after a confirmed reclaim of 0.01736, or wait to see whether 0.01664 holds first? #ByXIMPACT $COREUSDT

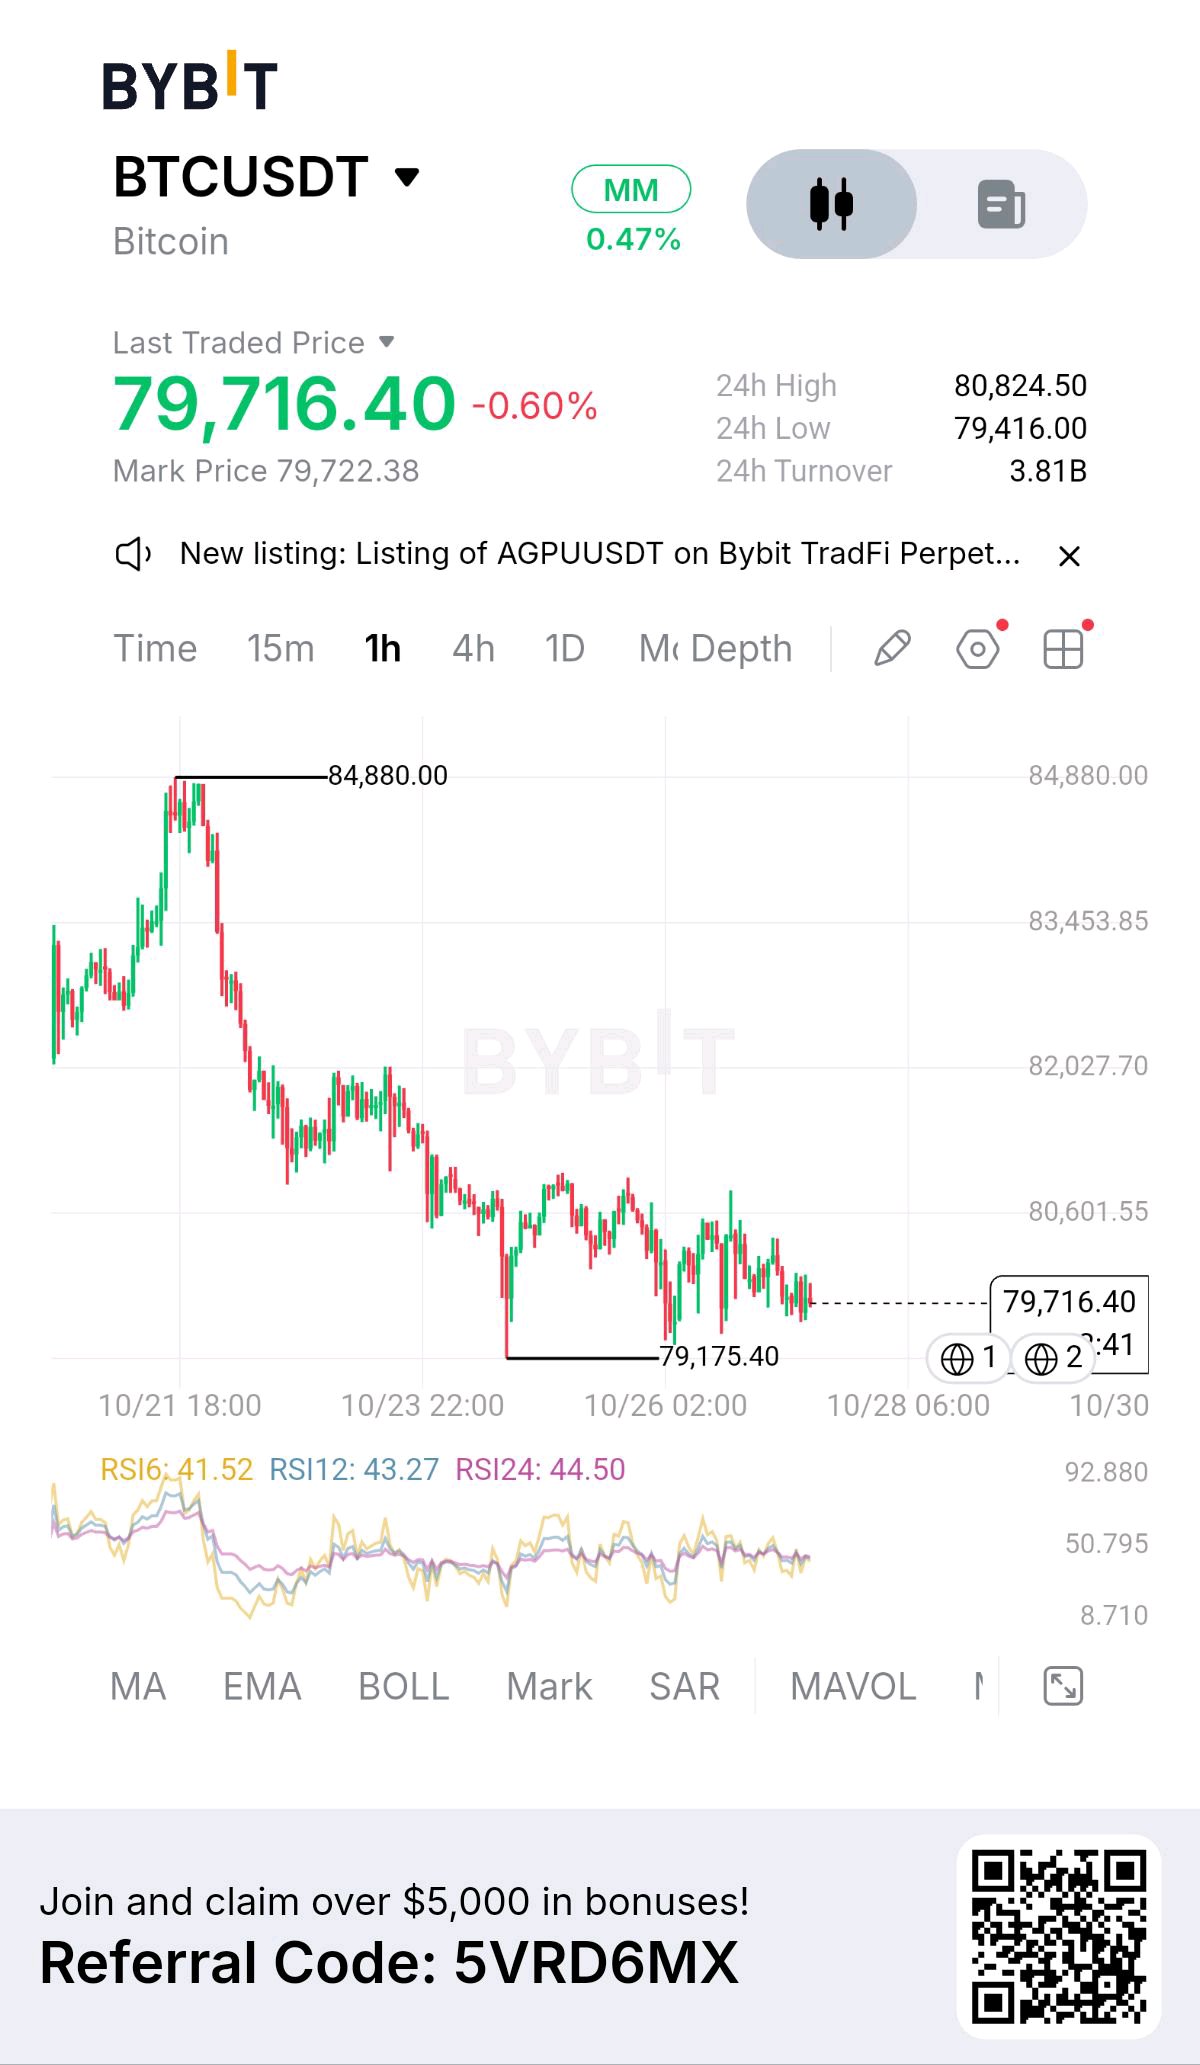
I almost scrolled past this chart, but something caught my attention. Bitcoin is still struggling to recover, and the 1H structure tells a story worth watching. We're currently at $79,716.40, down 0.60%, with a 24H high of $80,824.50 and a low of $79,416.00. Here's what caught my attention. BTC previously reached $84,880, but the rejection triggered a sustained downward move. Since then, price has continued printing lower highs and lower lows, keeping the short-term structure bearish. The important part is that BTC is now trading close to the $79,175.40 support zone, the marked swing low on my chart. This is where I want to pay closer attention. KEY OBSERVATION The RSI readings are: • RSI6: 41.52 • RSI12: 43.27 • RSI24: 44.50 All three are below 50, suggesting that momentum remains weak. However, this alone doesn't confirm another breakdown. Price is hovering near support, but I don't want to mistake a small bounce for a confirmed reversal. MY READ • Bias: Bearish while BTC remains below the recent resistance zones. • Immediate resistance: $80,824.50. • Bullish trigger: A strong 1H close above $80,824.50, followed by a successful retest, could open the door toward $82,027 and then $83,453. • Bearish trigger: A confirmed 1H breakdown below $79,175.40 could expose BTC to further downside. The next targets would depend on the new price structure. • invalidation: A sustained reclaim of resistance and a change in market structure would make me reconsider the bearish bias. One thing I've learned from watching BTC: support levels can look strong right until they fail. That's why I prefer confirmation over prediction. For now, I'm watching $79,175.40 closely. If buyers defend it, we could see a recovery attempt. If sellers break it, I don't want to stand in front of momentum. Would you buy BTC near this support, or wait for confirmation above $80,824? #ByXIMPACT $BTCUSDT

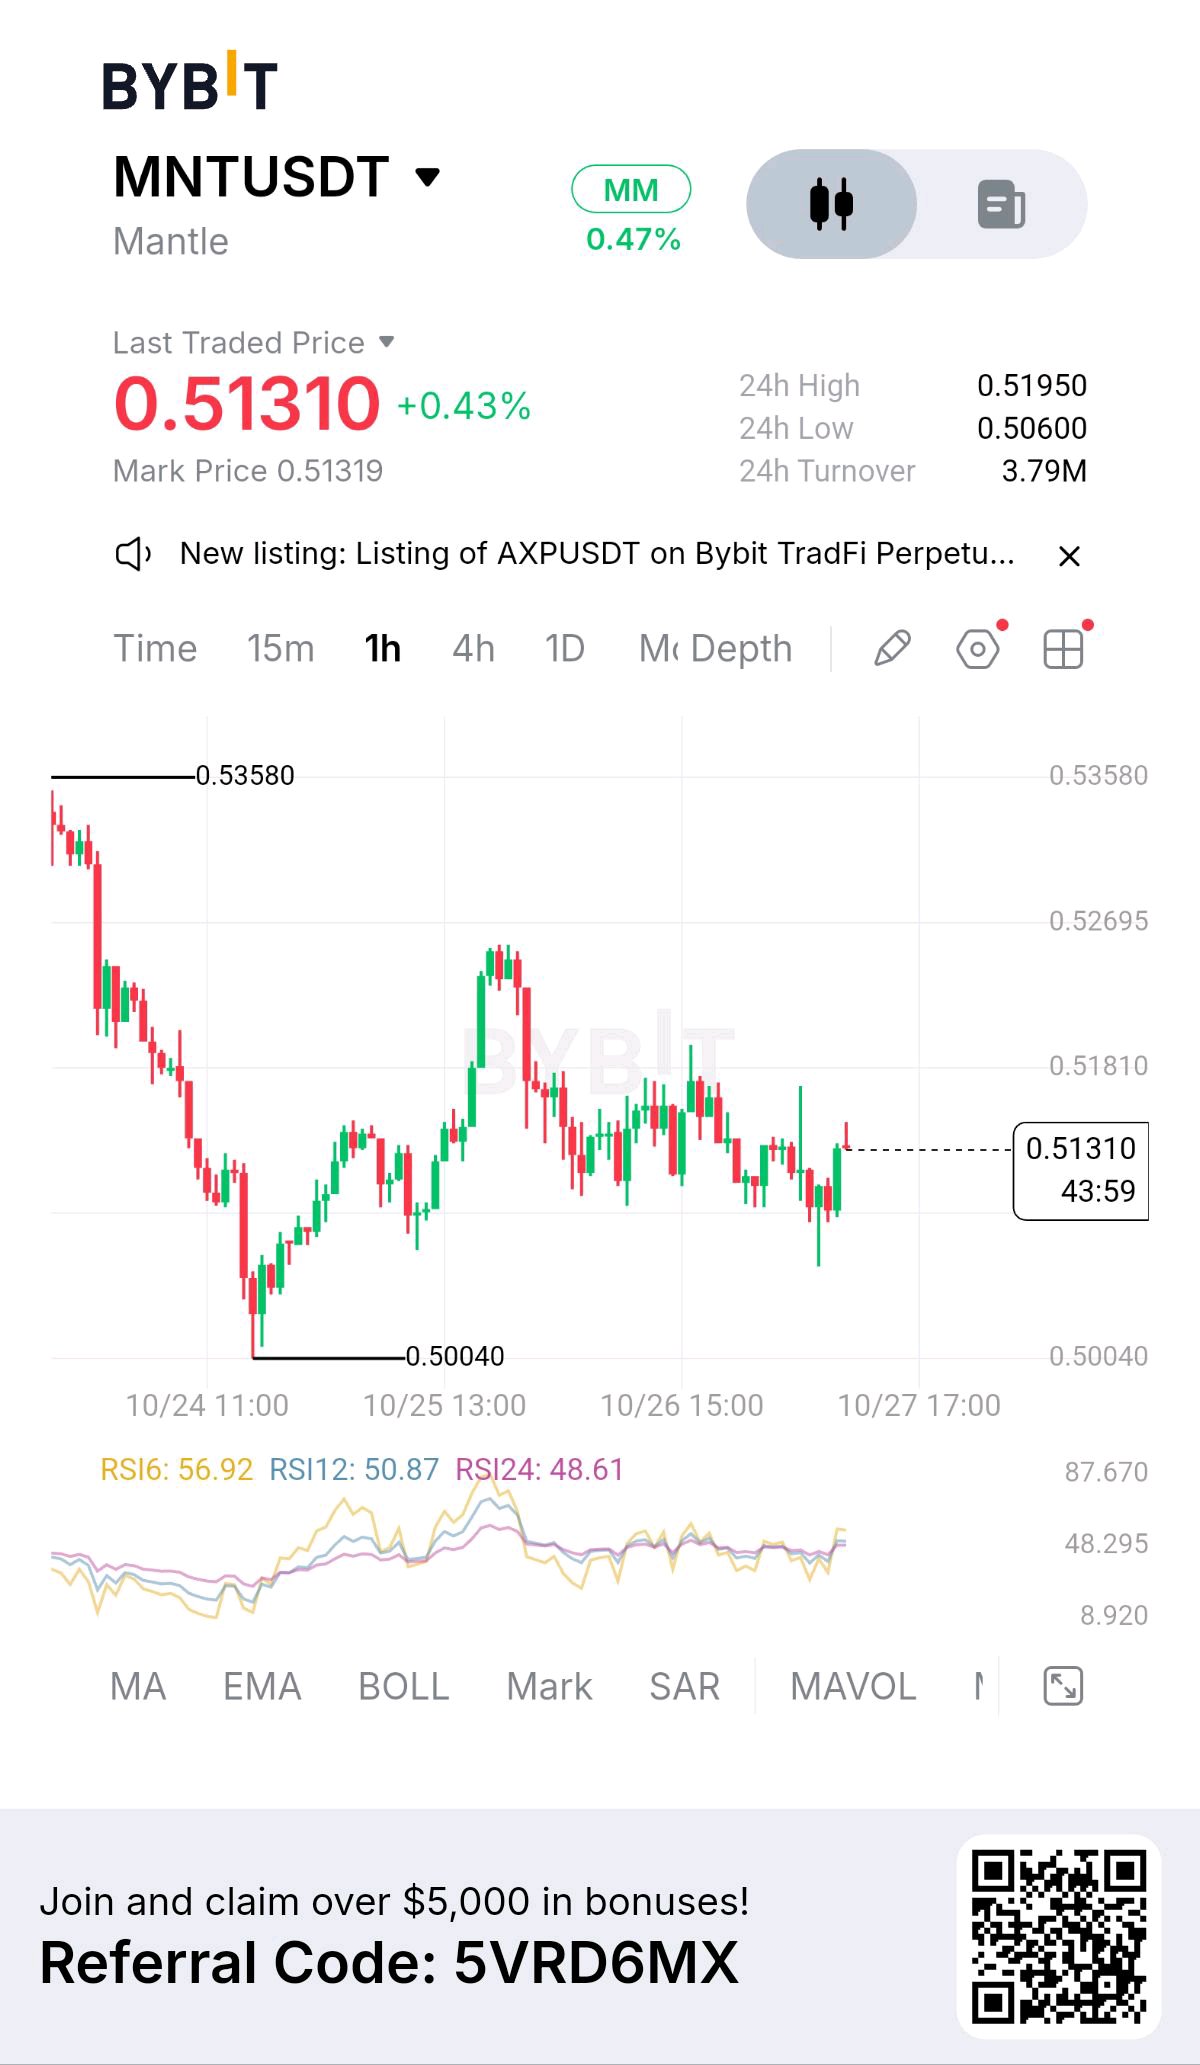
I almost scrolled passed on this chart because the recovery looked too small compared to the previous sell-off. But after looking closer at the 1-hour structure, I noticed something worth watching. MNT is trading around $0.51310, up +0.43%, after recovering from the $0.50040 low. However, the broader structure is not fully bullish yet. Here's what stands out. Price previously dropped from the $0.53580 region, found support near $0.50040, and bounced strongly toward the $0.525 area. Since then, the recovery has slowed, with lower highs and choppy price action suggesting that buyers are still fighting for control. Now we're trading near $0.51310, and the market is approaching an important decision zone. The 24-hour range sits between $0.50600 and $0.51950, with turnover at 3.79M. That's useful context, but turnover alone doesn't confirm strong buying pressure. RSI is showing a slightly improving picture: • RSI6: 56.92 • RSI12: 50.87 • RSI24: 48.61 Short-term momentum is recovering, but the broader momentum picture is still mixed. Here's my read: • Bias: Neutral with a recovery attempt while price holds above $0.50600. • Bullish trigger: A 1-hour close above $0.51950, followed by a successful retest, could open the way toward $0.52600, then $0.53580. • Bearish trigger: A clean break below $0.50600 could expose the $0.50040 swing low again. • Invalidation: A sustained breakdown below $0.50040 would weaken the recovery structure further. I'm not calling this a confirmed breakout yet. One thing I've learned from watching charts like this is that a strong bounce doesn't automatically mean a trend reversal. The real test is whether buyers can reclaim resistance and defend it afterward. For now, I'd rather watch how MNT reacts around $0.51950 than chase the recovery in the middle of the range. Would you buy a confirmed breakout above $0.51950, or wait for a pullback toward $0.50600? #ByXIMPACT $MNTUSDT

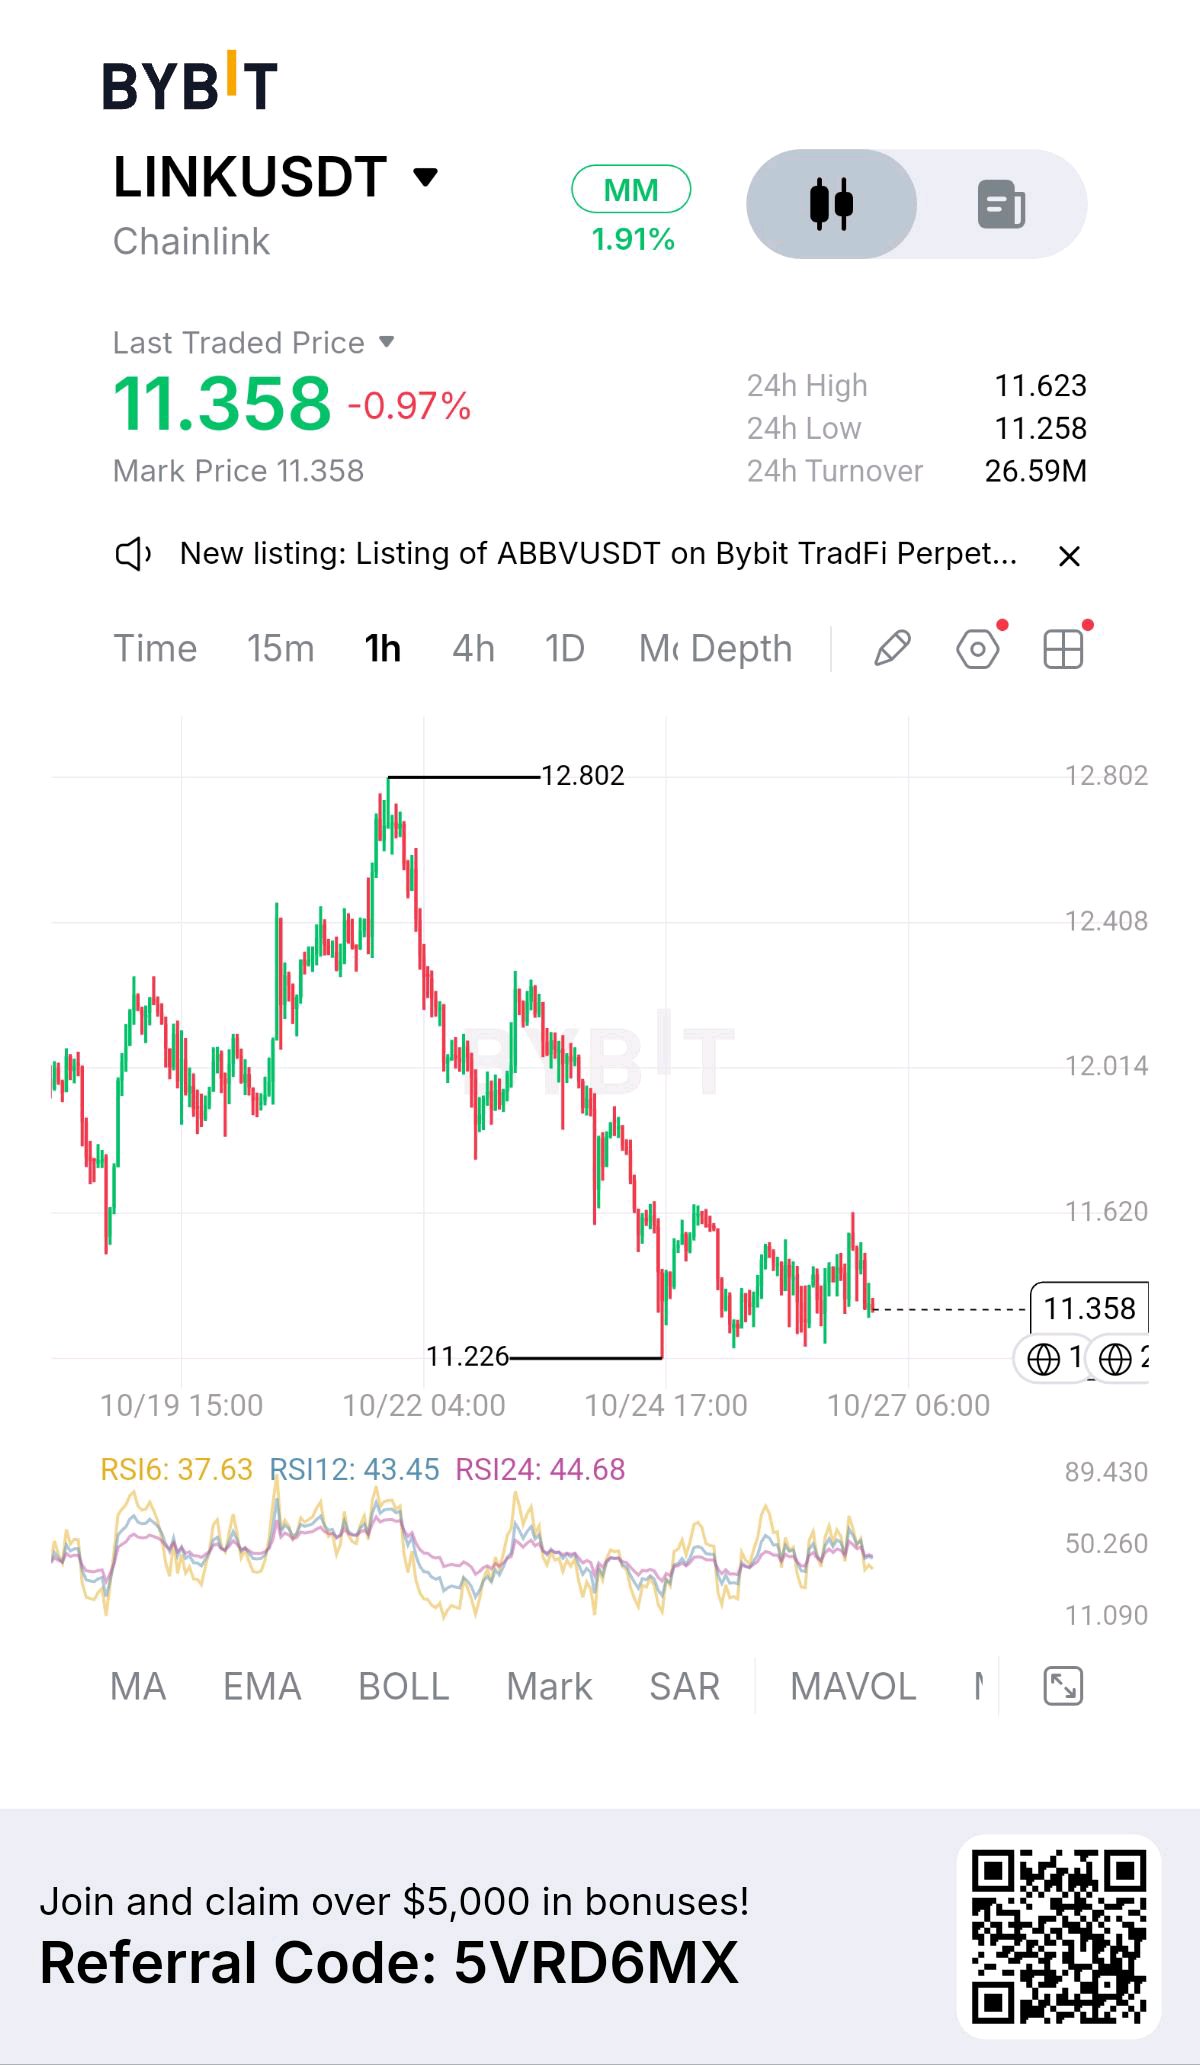
I almost scrolled past this chart because LINKUSDT has already made a significant move to the downside. But after looking closer at the 1-hour structure, I noticed something worth watching. We're at 11.358, down -0.97%, and the structure is still under pressure. Price rejected from the 12.802 high and continued forming lower highs and lower lows, eventually reaching 11.226. Here's what matters. The 11.226 level is the key low I'm watching. Buyers have managed to keep price above that area for now, but the recovery is still weak. Price is moving sideways around 11.35 after the sell-off, and that alone doesn't confirm a bullish reversal. RSI6 is at 37.63, RSI12 at 43.45, and RSI24 at 44.68. Momentum remains relatively weak, especially on the shorter RSI, although selling pressure could begin to ease if buyers step in. 24H turnover stands at 26.59M. There's activity in the market, but turnover alone doesn't confirm whether buyers or sellers are in control. My read: • Bias: Bearish to neutral while price remains below 11.62. • Bullish trigger: A 1-hour close above 11.62, followed by a successful retest → next areas to watch are 12.01, then 12.40. • Bearish trigger: A break below 11.226 with selling pressure → downside continuation becomes a risk. • Invalidation: A sustained recovery above 12.01 would weaken my immediate bearish view and shift my attention toward a broader recovery. One thing I've learned from watching charts like this: a sharp decline can make a bounce look more convincing than it really is. LINK is holding above its recent low, but holding support and reversing a trend are two different things. For now, I'm watching two levels: 11.226 below and 11.62 above. Whichever side price confirms first could tell us more about the next move. Would you buy LINKUSDT after a confirmed breakout above 11.62, or wait for a retest of support first? #ByXIMPACT $LINKUSDT
I almost scrolled past $TRUMPUSDT because the bigger move had already happened. But after looking closer at the 1-hour chart, I noticed something worth paying attention to: buyers are finally pushing back after a heavy correction. We're currently at 1.701, up +2.46%, with a 24-hour high of 1.711 and a low of 1.617. Turnover stands at 18.02M Here's what caught my attention. Price previously surged toward 1.921 before reversing sharply. Since then, the chart has been printing lower highs and renewed selling pressure, eventually dragging price down to 1.617. But now, we're seeing a recovery from that low. The latest candles show buyers stepping in, and price is approaching the 1.711 resistance area. That's the first level I'm watching closely. A clean break could change the short-term picture, but I don't want to confuse a bounce with a confirmed trend reversal. KEY OBSERVATION RSI6 is at 68.19, RSI12 at 64.18, and RSI24 at 57.19. Momentum has improved across all three RSI readings. However, the short-term RSI is approaching overbought territory, meaning a pullback or consolidation wouldn't surprise me. My read: • Bias: Short-term bullish recovery, but the broader 1H structure still needs confirmation. • Bullish trigger: A 1-hour close above 1.711, followed by a successful retest → potential targets at 1.769, then 1.845. • Bearish trigger: Rejection around 1.711 and a loss of 1.680 → potential retest of 1.650, with 1.617 as the key support. • Invalidation: A clean breakdown below 1.617 would weaken the recovery setup significantly. One thing I've learned from watching these charts: the first green candles after a major selloff can look convincing, but the real test comes when price reaches its previous resistance. For me, 1.711 is the immediate battle. If buyers reclaim it and hold, I'll pay more attention to the upside. If price gets rejected again, I'd rather wait than chase. Would you buy $TRUMPUSDT above 1.711, or wait for a pullback and retest first? #ByXIMPACT $TRUMPUSDT
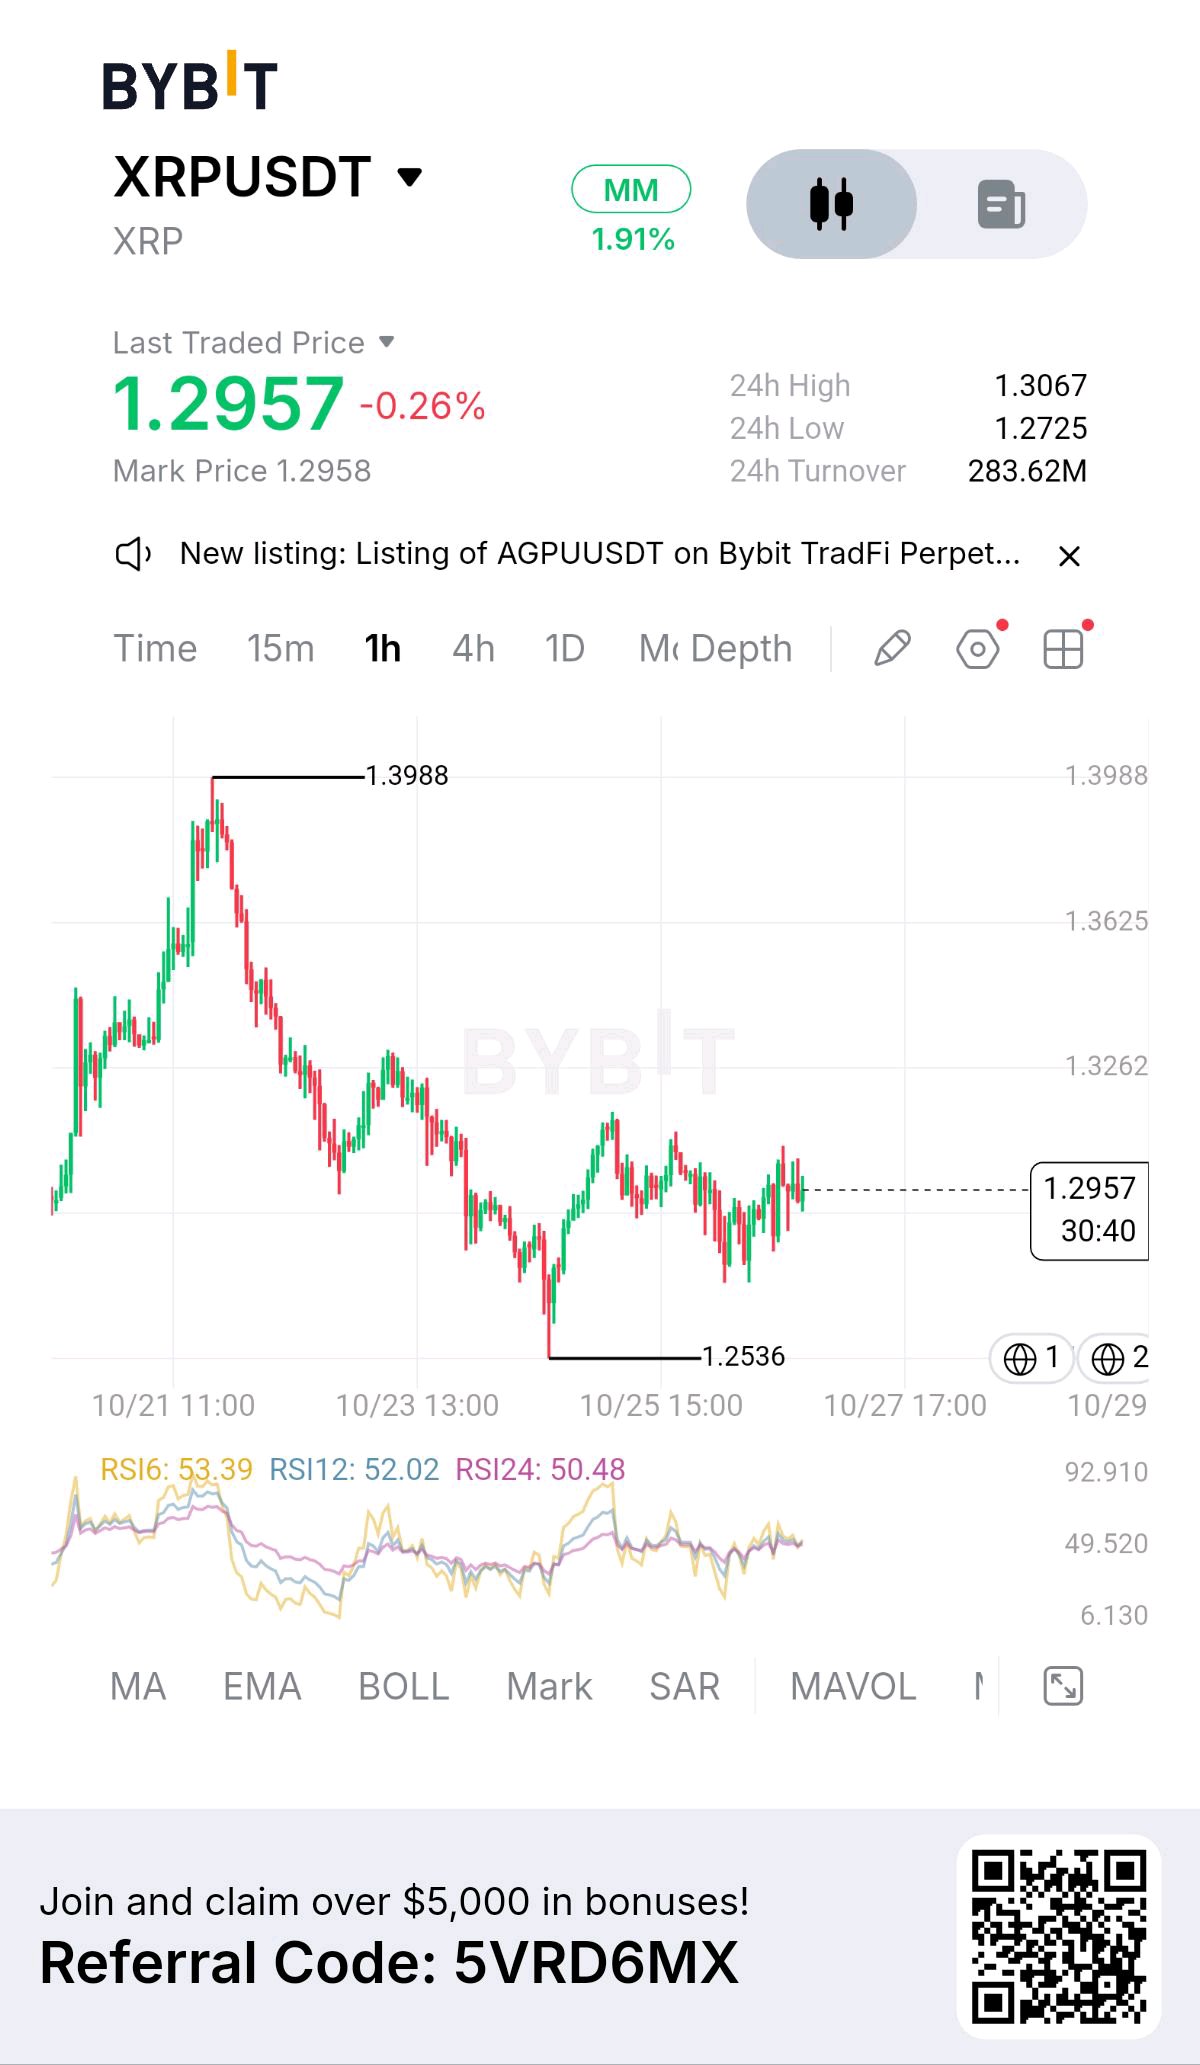
I almost scrolled past this $XRPUSDT chart because the bigger move had already happened. But when I looked closer, I noticed something worth watching: after falling from the $1.3988 high, XRP is trying to stabilize and rebuild momentum. We're at $1.2957, down -0.26%, with a 24H high of $1.3067 and a low of $1.2725. On the 1H chart, the bigger structure still shows a clear decline from the previous high, but the recent recovery from $1.2536 has changed the short-term picture. Here's what caught my attention. Price is holding around $1.29–$1.30 after bouncing from the recent lows. But every recovery attempt still needs confirmation. The $1.3067 area is the immediate resistance I'm watching, while the previous swing structure suggests sellers could still step in if buyers lose momentum. Turnover is 283.62M, showing substantial trading activity over the 24-hour period. RSI readings are also worth noting: RSI6 at 53.39, RSI12 at 52.02, and RSI24 at 50.48. All three are slightly above 50, suggesting improving short-term momentum, but that's not enough on its own to confirm a breakout. My read: • Bias: Neutral to cautiously bullish while price holds above $1.2725, but the broader recovery remains unconfirmed. • Bullish trigger: A convincing 1-hour close above $1.3067, followed by a successful retest, could open the way toward $1.3262 and then $1.3625. • Bearish trigger: A breakdown below $1.2725 could expose the $1.2536 swing low again. • Invalidation: A sustained move below $1.2536 would weaken the recovery setup significantly. One lesson I keep learning from these charts: a recovery candle can attract attention, but structure tells the bigger story. XRP has bounced from $1.2536, yet the market still needs to prove that buyers can reclaim resistance instead of simply creating another lower high. I'm not chasing a green candle here. I'd rather see XRP clear $1.3067 and hold it, or wait for a cleaner pullback with confirmation. Would you buy a confirmed breakout above $1.3067, or wait for a pullback toward support? #ByXIMPACT $XRPUSDT
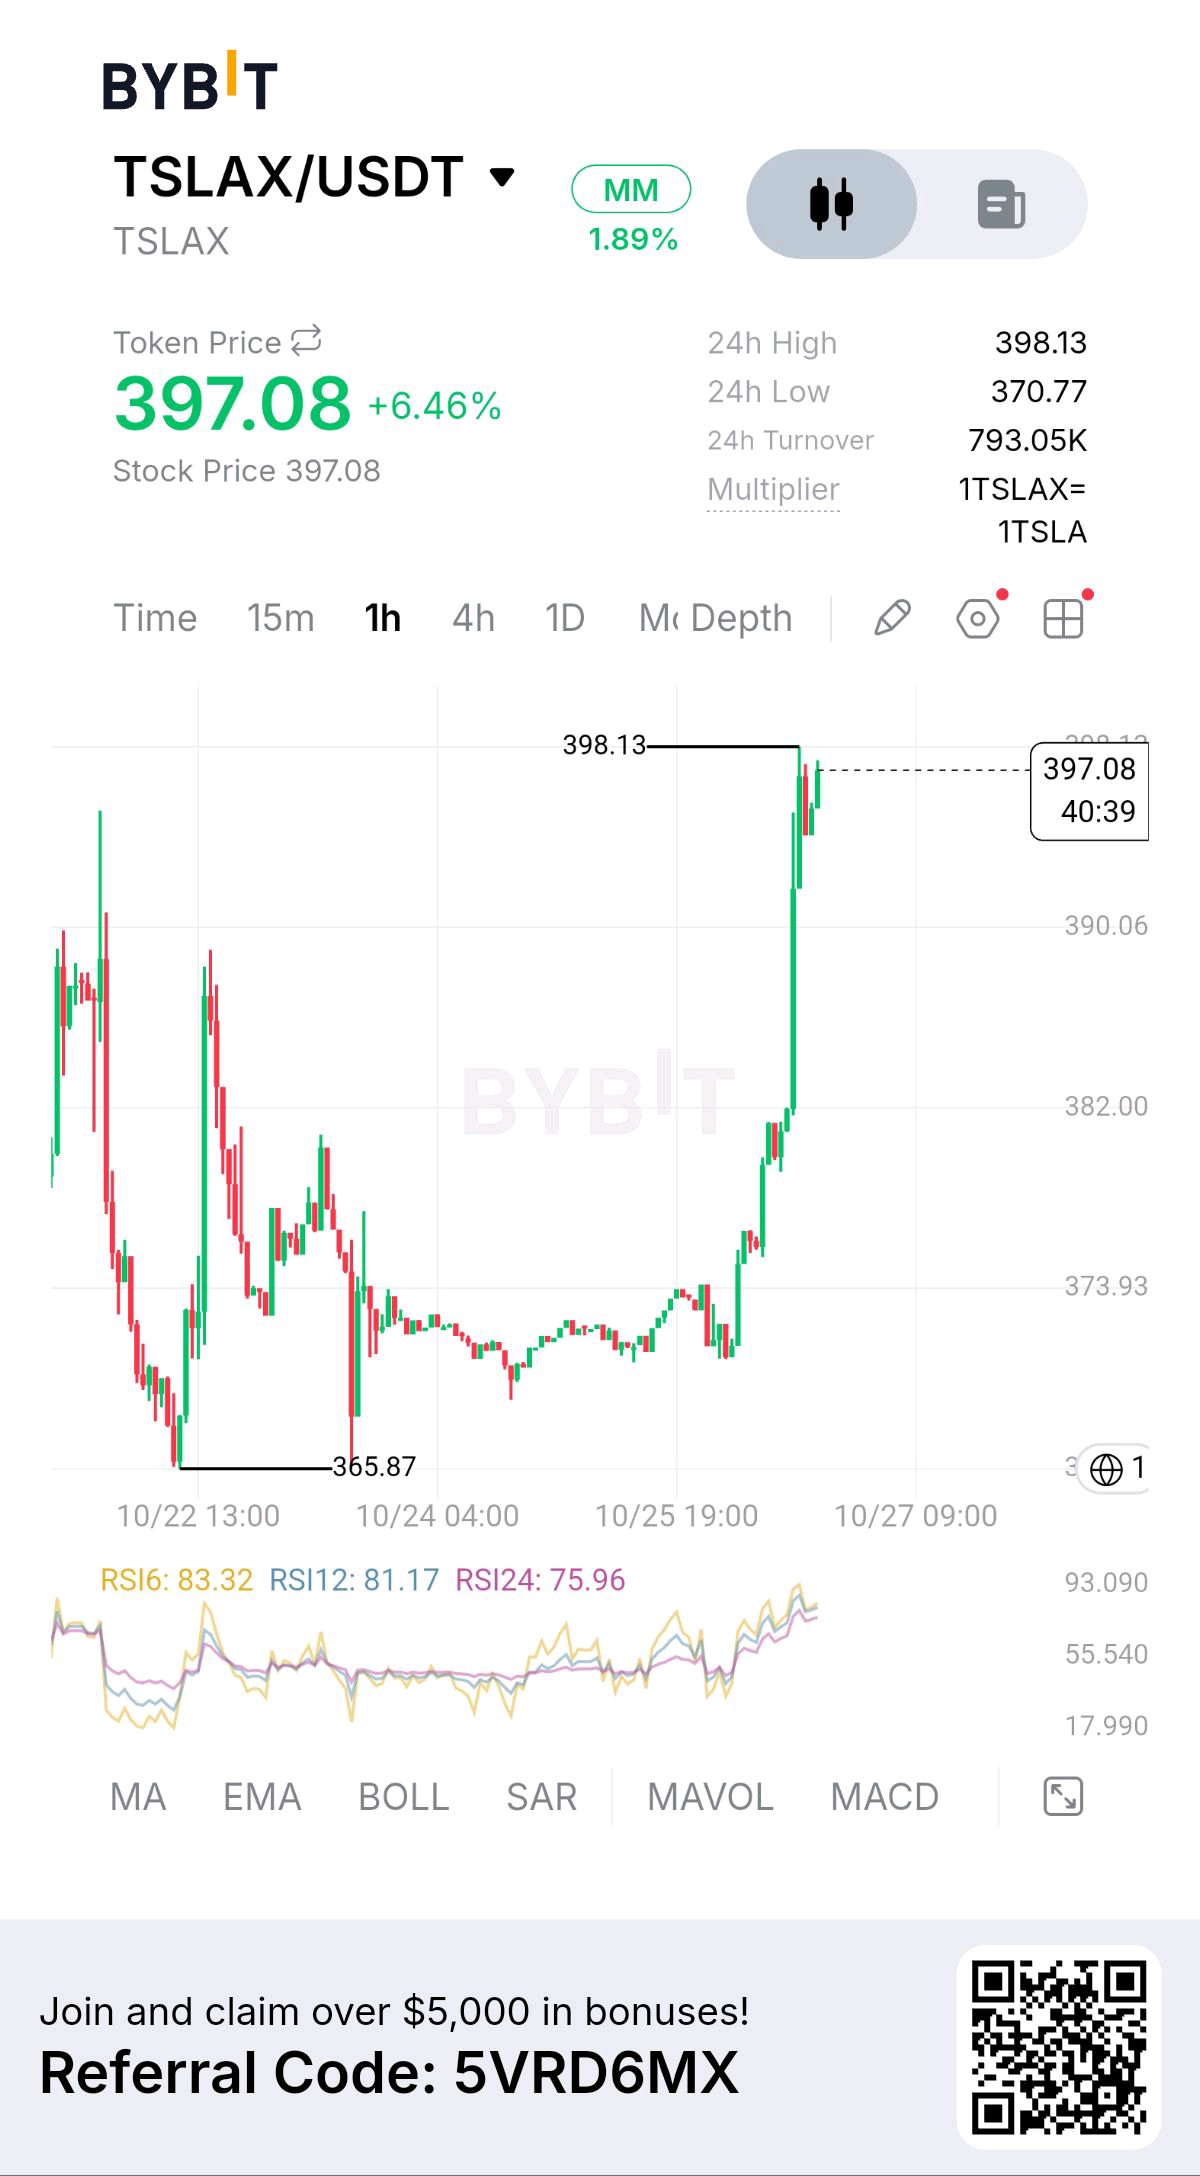
I almost scrolled passed this chart because I thought the move had already happened. But something made me stop and look closer. $TSLAXUSDT had spent time consolidating around the $372–$374 zone before buyers stepped in aggressively and pushed price through multiple resistance levels. We're now at 397.08, up +6.46%, with a 24H range of 370.77–398.13 and turnover of 793.05K. On the 1H chart, the breakout is clear. Price moved above $382, pushed through $390, and accelerated toward the $398.13 high. That's a strong momentum shift, but the question now is whether buyers can defend the breakout or whether this move needs a cooldown. Here's what matters. The previous consolidation around $372–$374 provided the base for this expansion. The $382 level was the first major breakout area, followed by $390. Both levels are now important reference points if price pulls back. But there's another detail I don't want to ignore. RSI6 is at 83.32, RSI12 at 81.17, and RSI24 at 75.96. Momentum is extremely elevated across all three readings. That doesn't automatically mean a reversal is coming, but it does increase the risk of chasing an extended move. My read: • Bias: Bullish while price holds the $390 breakout zone. • Bullish trigger: A 1-hour close above $398.13, followed by a successful retest, could open the door toward $400 and potentially $405 if momentum continues. • Pullback watch: $390 is the first level I'd monitor, followed by $382 if selling pressure increases. • Bearish trigger: A 1-hour close back below $382 would weaken the breakout structure and raise the risk of a deeper retracement toward $374. • Invalidation: A sustained move below the $374 consolidation zone would significantly weaken my bullish recovery thesis. One more thing: this is tokenized Tesla exposure, not the same as directly holding TSLA stock. The chart alone doesn't confirm the token's liquidity quality, redemption terms, or tracking behavior. My takeaway: I almost scrolled past this setup, but the structure caught my attention. The breakout is impressive, yet I'm not buying simply because the candle is green. I want to see whether $390 can turn into support before considering the next move. Would you buy a confirmed breakout above $398.13, or wait for a pullback toward $390? #ByXIMPACT $TSLAXUSDT

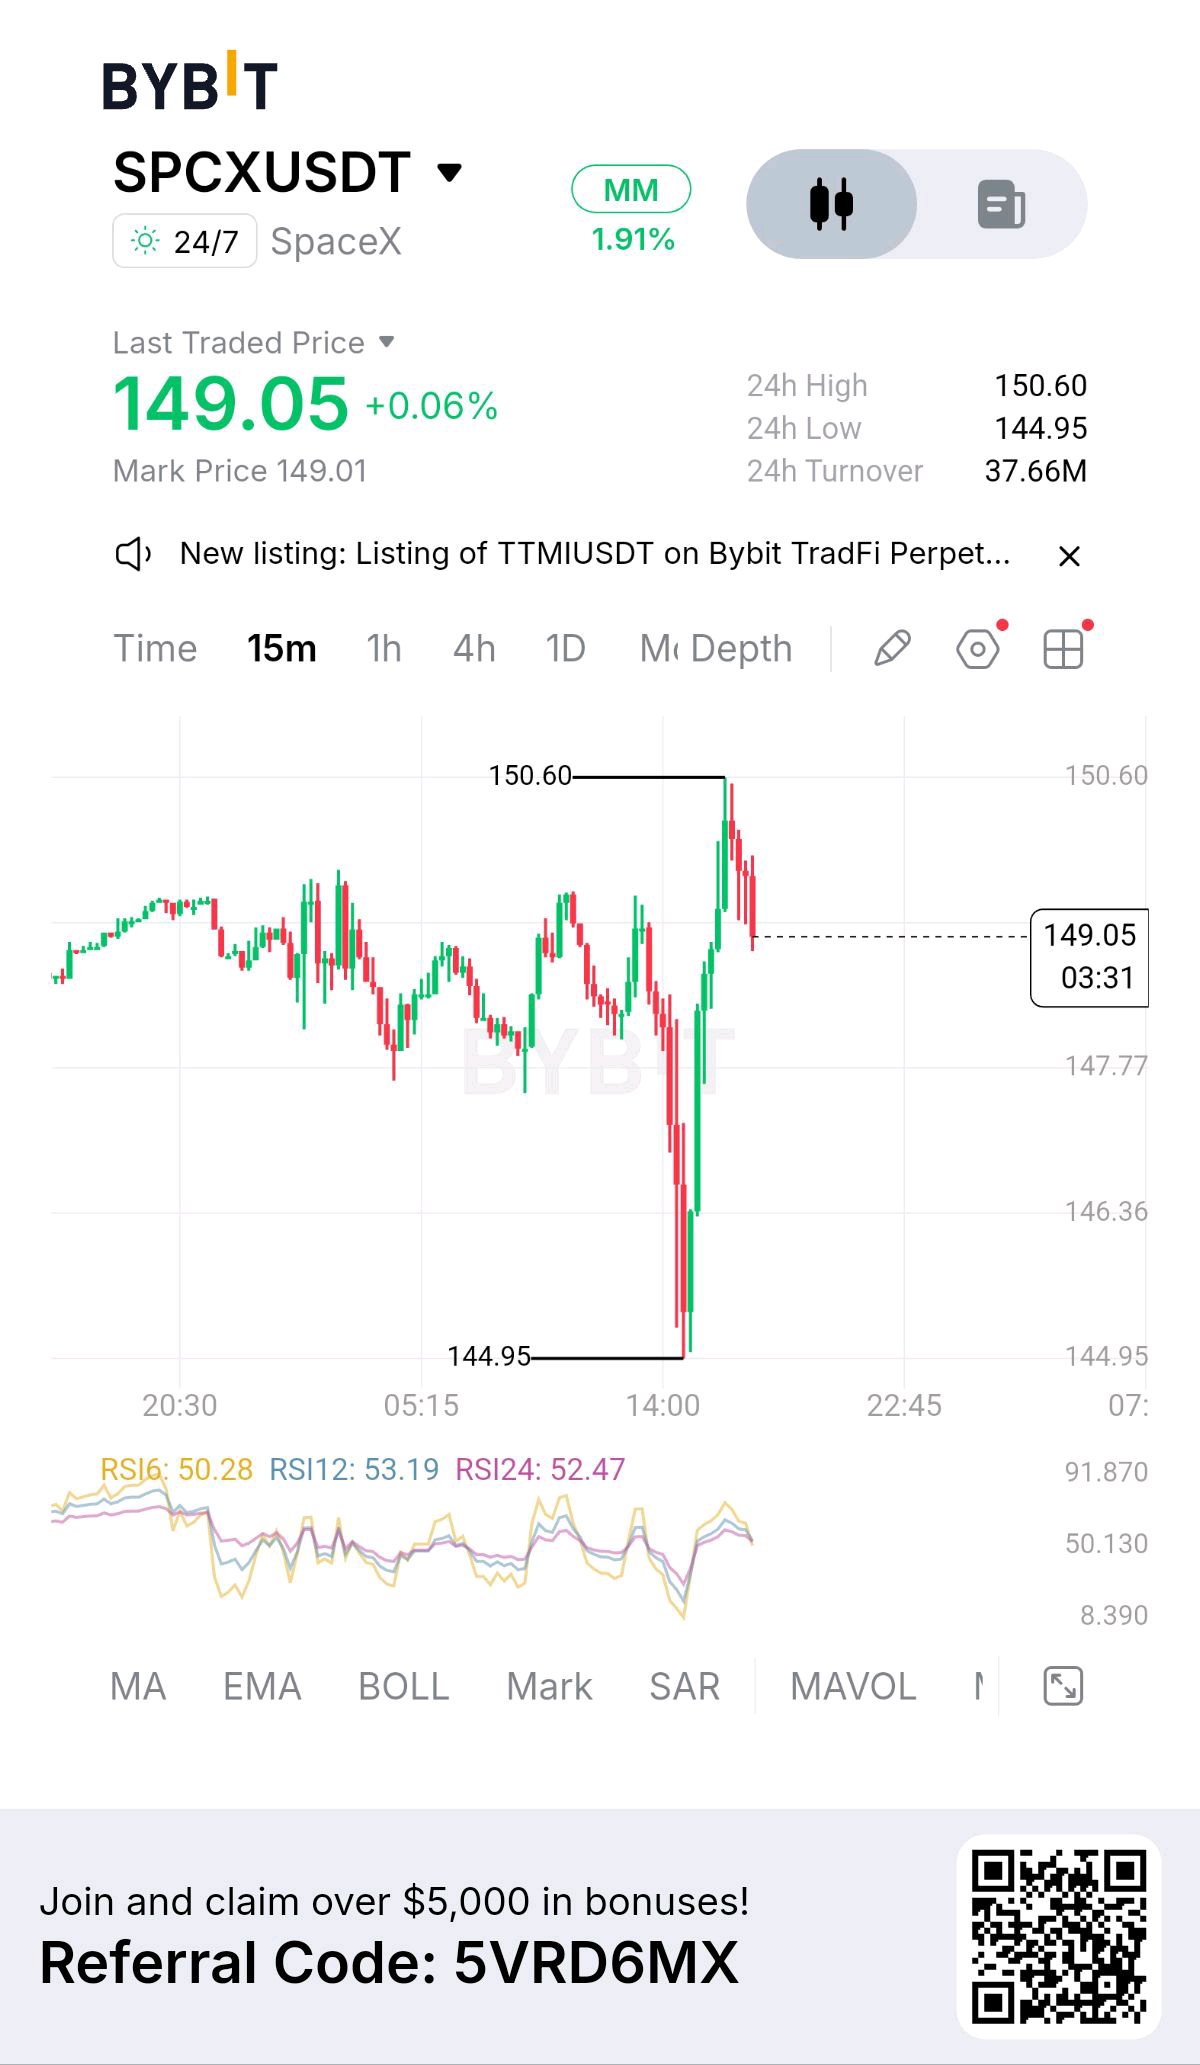
I've been tracking $SPCXXUSDT closely, and this 15-minute chart caught my attention. Price suffered a sharp sell-off, flushed to 144.95, and then reversed aggressively. But after that strong recovery, we're now seeing sellers step in near the 150.60 high. We're currently at 149.05, up +0.06%, with a 24-hour range of 144.95–150.60 and turnover at 37.66M. Here's what stands out. Price recovered sharply from 144.95, climbed toward 150.60, and then pulled back. That tells me buyers responded strongly to the sell-off, but the rejection near the session high shows that sellers are still defending the upper zone. The RSI readings are another important detail: RSI6 is 50.28, RSI12 is 53.19, and RSI24 is 52.47. Momentum has recovered toward neutral territory, with a slight positive lean, but this alone isn't enough to confirm another breakout. Turnover is 37.66M. Participation is worth monitoring, especially if price attempts another move toward resistance. The warning triangle is still present, and I can't confirm what it means from the chart alone. My read: • Bias: Neutral to cautiously bullish while price holds the recovery structure above 147.77. • Bullish trigger: A clean 15-minute breakout and hold above 150.60, supported by stronger volume → 151.50, then 153.00 as potential watch levels, not guaranteed targets. • Bearish trigger: A rejection near 150.60 followed by a break below 147.77 → 146.36, with 144.95 as the key downside level. • Invalidation: A decisive move below 144.95 would invalidate the immediate recovery structure and shift my attention back toward bearish continuation. The lesson from this chart: a sharp rebound doesn't automatically mean a confirmed trend reversal. The recovery from 144.95 is impressive, but 150.60 remains the ceiling to watch. I would rather wait for confirmation than chase the move after the first bounce. Would you buy a confirmed breakout above 150.60, or wait for a pullback toward 147.77? #ByXIMPACT $SPCXXUSDT

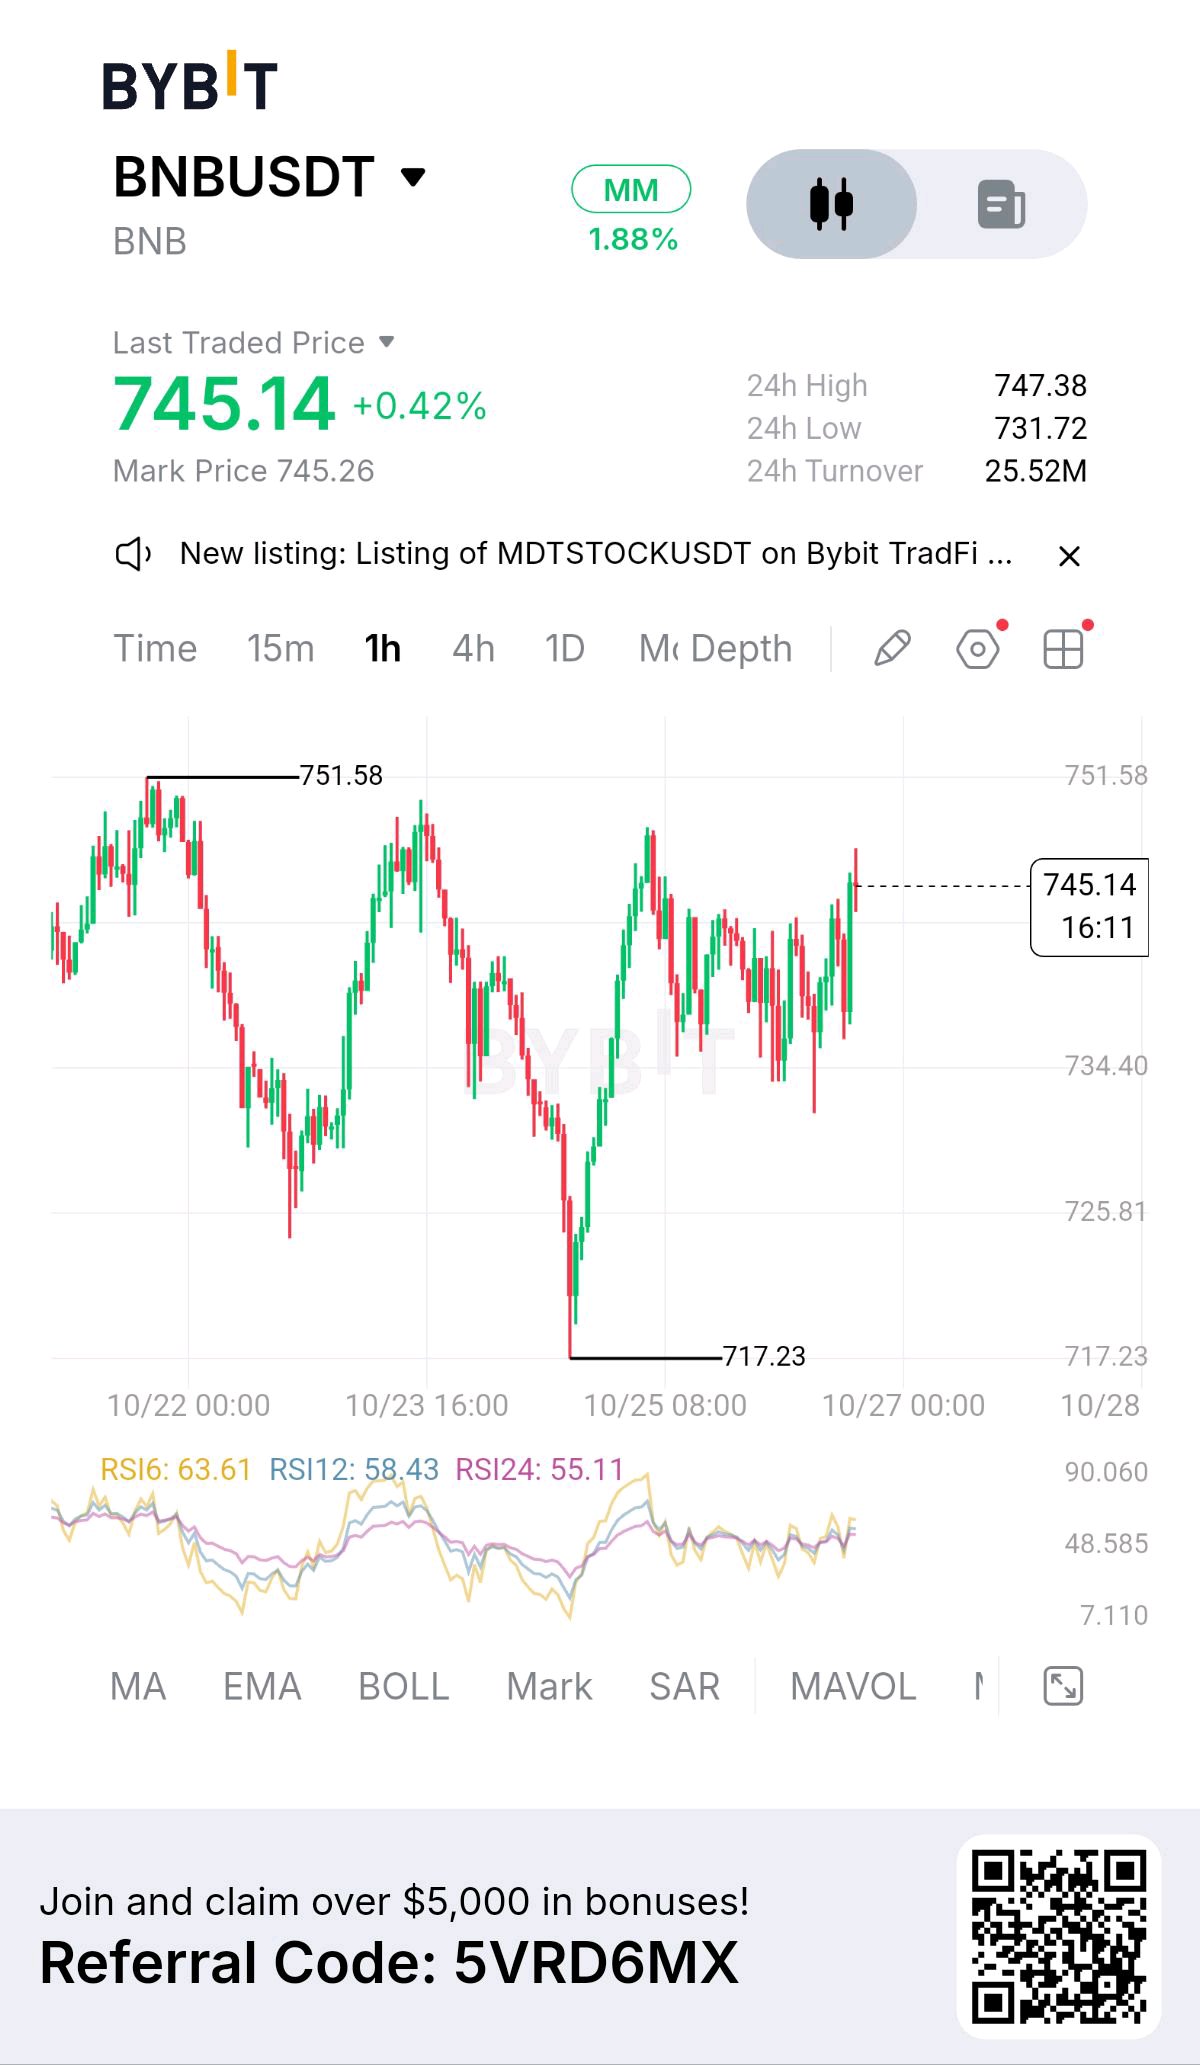
I've been watching $BNBUSDT on the 1H chart, and one thing stands out: buyers are trying to regain control, but price is approaching a level that could decide the next move. We're currently trading around 745.14, up +0.42%, with a 24H high of 747.38 and a low of 731.72. But the bigger picture is more interesting. After dropping from the 751.58 region and eventually flushing to 717.23, BNB recovered strongly. Buyers stepped in aggressively, pushing price back toward the upper part of the recent range. Here's what caught my attention. The 751.58 resistance is the level I'm watching closely. Price has approached this area before but failed to sustain the move. Now we're seeing another recovery attempt, and the question is whether buyers have enough momentum to challenge that ceiling. The RSI readings also support the recovery: - RSI6: 63.61 - RSI12: 58.43 - RSI24: 55.11 All three are above 50, suggesting positive short-term momentum. However, that alone doesn't confirm a breakout. 24H turnover stands at 25.52M. That's useful market context, but I'd still want to see the actual breakout volume increase before trusting a move above resistance. My read: • Bias: Short-term bullish recovery while buyers defend the 731.72 area, but the broader structure still needs confirmation. • Bullish trigger: A convincing 1H close above 747.38, followed by a successful retest, could open the way toward 751.58. • Breakout confirmation: A sustained move above 751.58 with stronger volume could create room for further upside. I'd reassess the next resistance levels rather than assume a fixed target. • Bearish warning: Rejection around 747.38–751.58 followed by a loss of 731.72 would weaken the recovery and put the 717.23 swing low back in focus. One lesson this chart reminds me of: a strong recovery doesn't automatically mean a confirmed breakout. BNB has recovered from 717.23, but the real test is whether buyers can turn resistance into support. I'm not chasing the green candles here. I'd rather wait for confirmation than enter directly into a resistance zone. Would you buy a confirmed breakout above 751.58, or wait for a pullback and retest first? #ByXIMPACT $BNBUSDT
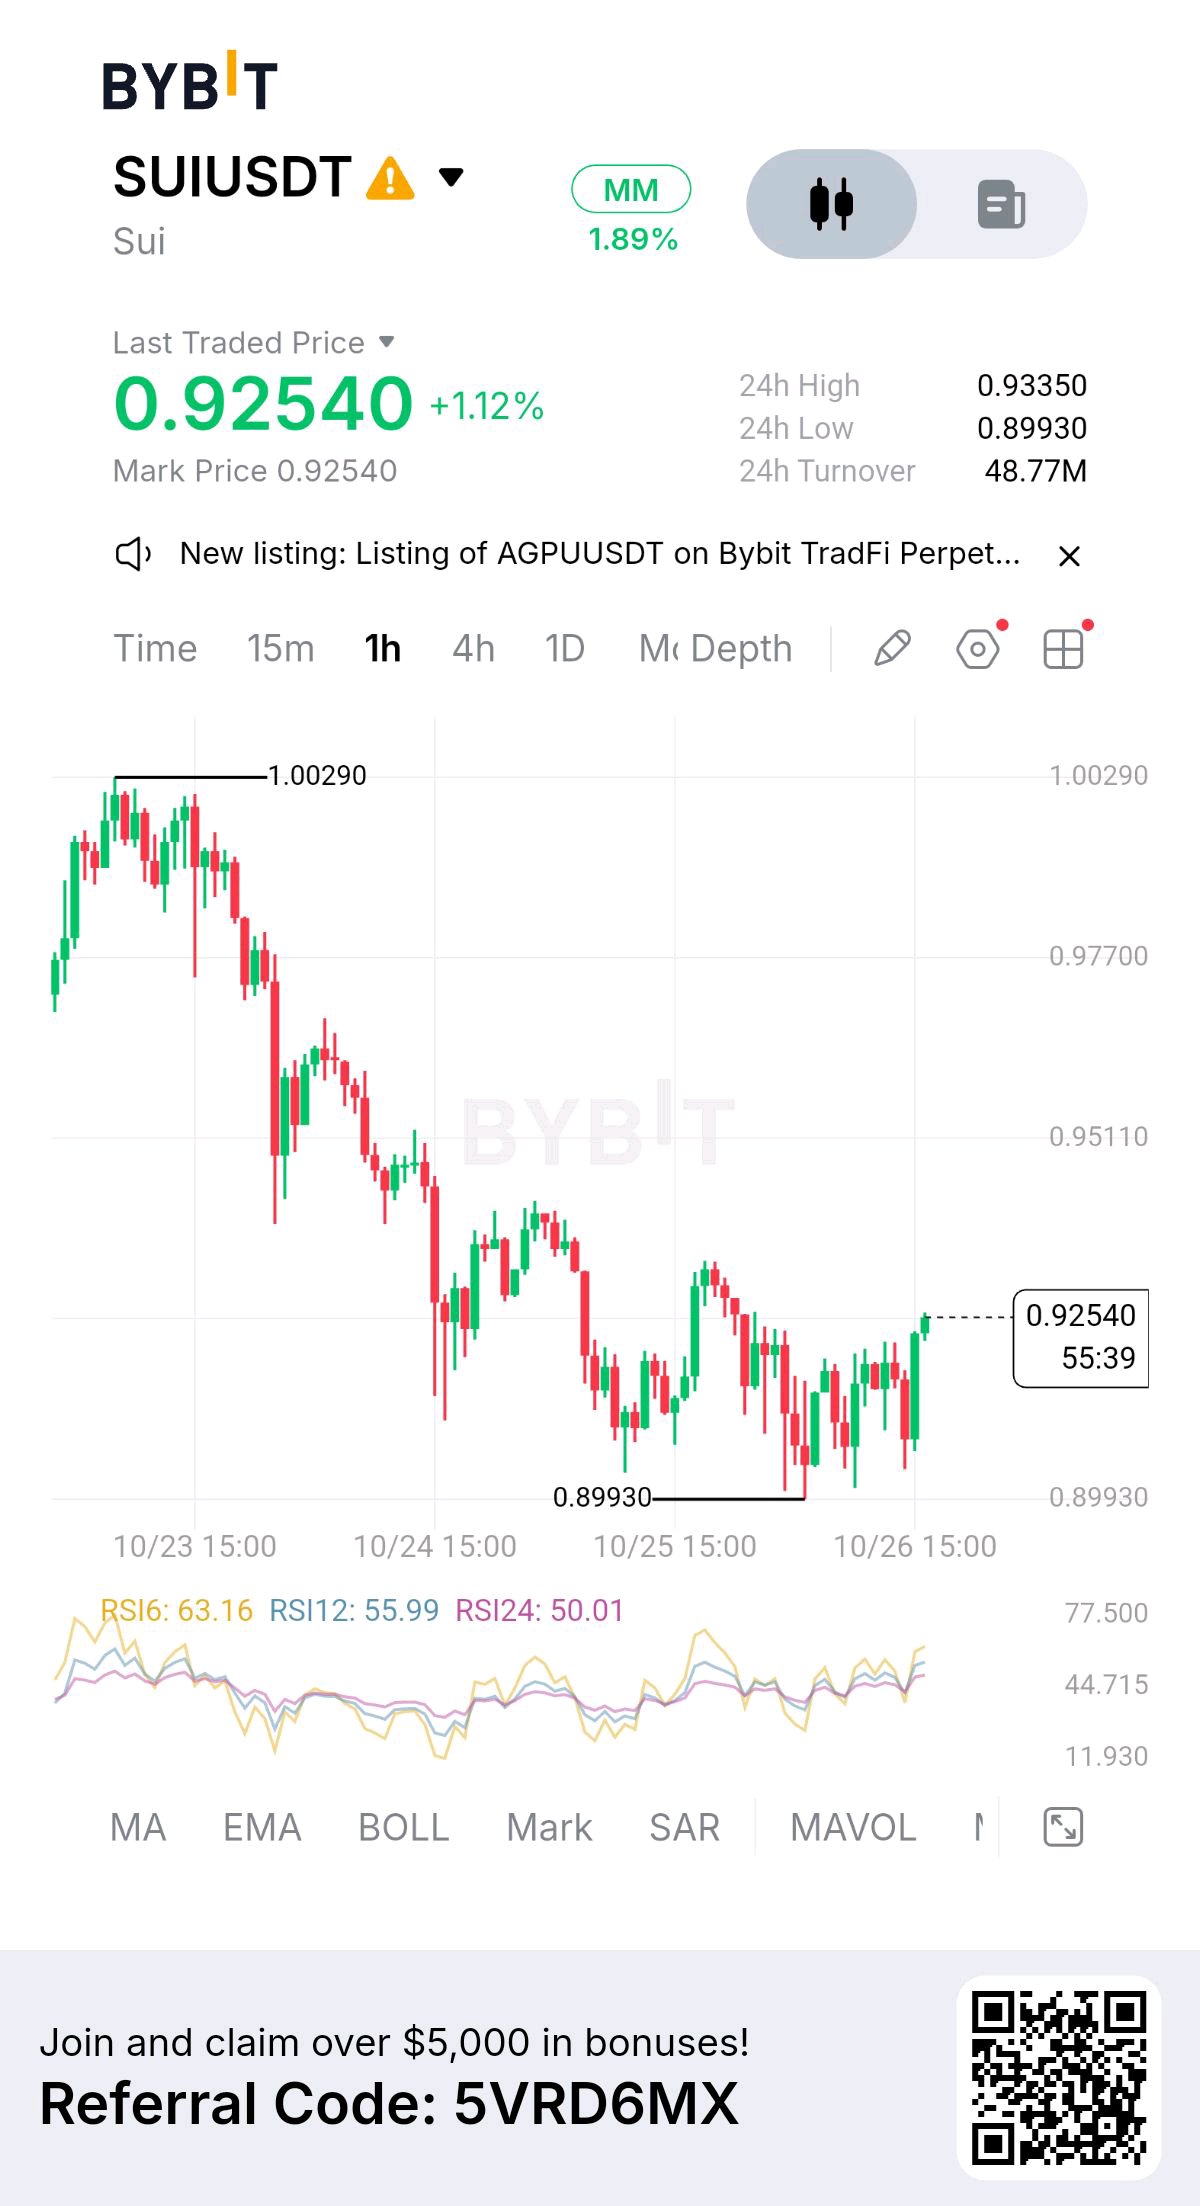
I opened $SUIUSDT, and the first thing that caught my attention wasn't the green candle—it was the structure behind it. Price has started recovering, but the broader 1H trend still tells a different story. We're currently at $0.92540, up +1.12%, with a 24H high of $0.93350 and a low of $0.89930. Turnover stands at 48.77M, showing meaningful market activity, although turnover alone doesn't confirm buying pressure. Here's what I'm watching. SUI previously traded near $1.00290 before entering a sustained decline. The chart shows a sequence of lower highs and lower lows, with sellers pushing price toward $0.89930. Buyers have since stepped in, and the latest recovery has brought price back toward $0.92540. That's encouraging for the short-term momentum, but a recovery isn't automatically a trend reversal. The RSI readings are also improving: • RSI6: 63.16 • RSI12: 55.99 • RSI24: 50.01 Short-term momentum currently favors buyers, but I still want to see whether they can maintain that strength near resistance. My read: • Bias: Bearish-to-neutral on the broader 1H structure, with a short-term bullish recovery. • Immediate resistance: $0.93350. A clean break and 1H close above this level could open the way toward $0.95110. • Bullish confirmation: A sustained breakout above $0.95110 would strengthen the recovery and bring $0.97700 into focus. • Support: $0.91500–$0.92000 is an area to watch during a pullback, not a confirmed support zone. • Major support: $0.89930. A breakdown below this low could expose SUI to further downside. What I find interesting is that SUI has recovered from $0.89930 without yet reclaiming the important resistance levels overhead. The buyers have shown up, but the market still needs to prove that this move has enough strength to change the structure. I'm not chasing the green candle. I'd rather wait for confirmation above resistance or a controlled pullback that holds support. Would you buy SUI's breakout above $0.93350, or wait for a pullback before considering an entry? #ByXIMPACT $SUIUSDT
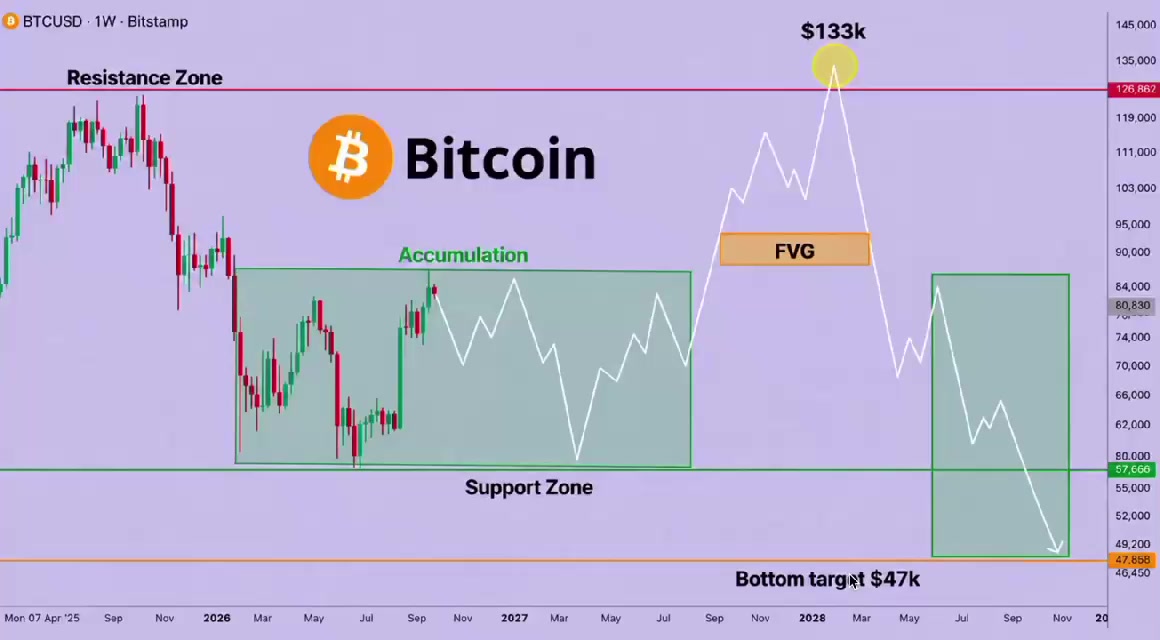
🚨 BITCOIN COULD MAKE ONE FINAL RUN BEFORE THE REAL CRASH Everyone will think the bull market is back. That’s exactly where I think the trap begins. My roadmap: $80K → $100K+ → $133K → $47K I expect $BTCUSDT to push into new highs first, pulling everyone back into the market at maximum confidence. Then comes the move almost nobody will be prepared for. The rally is the bait. The crash is the opportunity. SAVE THIS CHART. Follow + turn notifications on. I’ll post my next major call here BEFORE the move. #ByXIMPACT $BTCUSDC
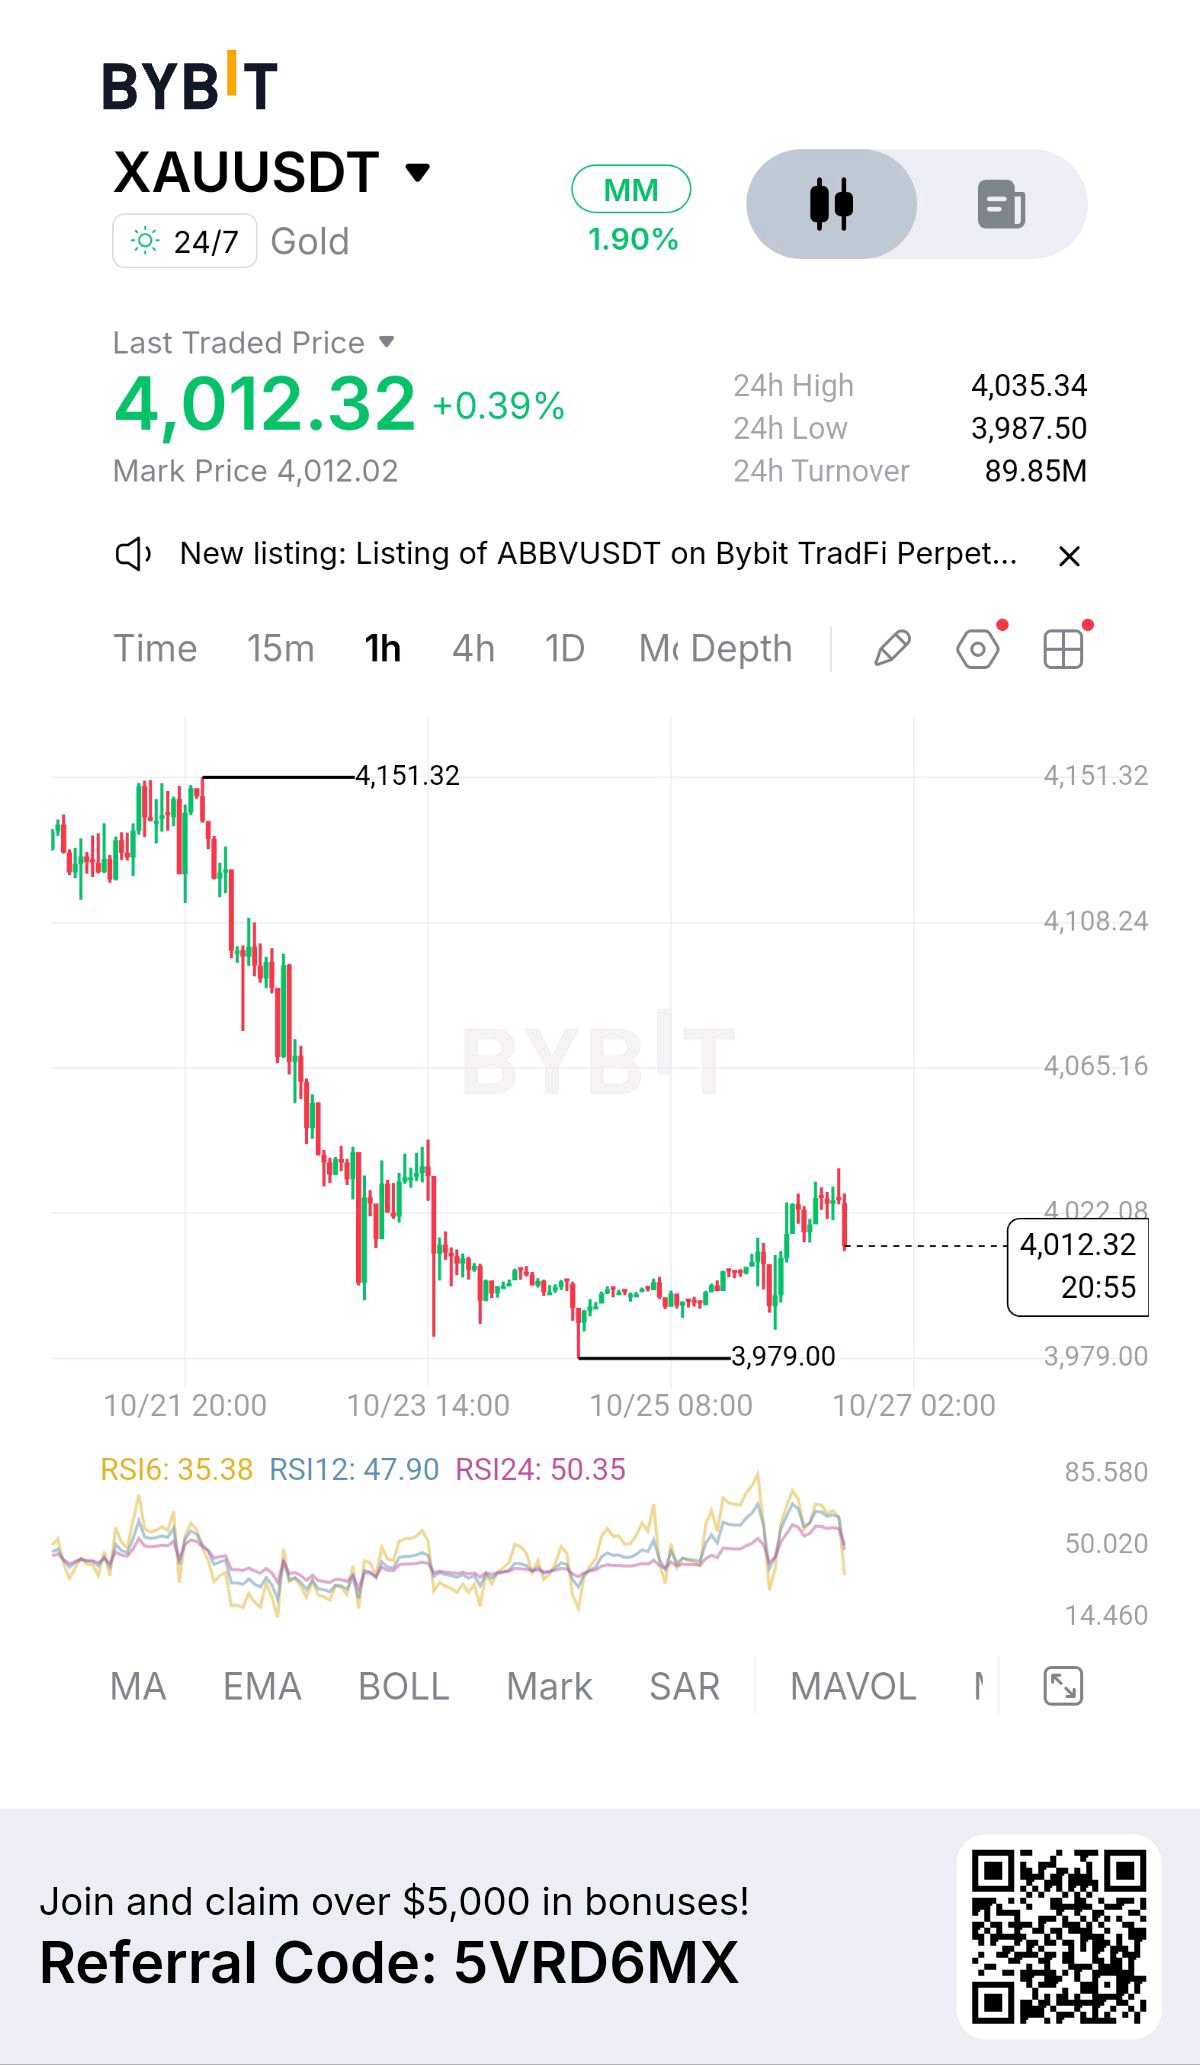
I almost ignored this $XAUUSDT chart because the major sell-off had already happened. But after reviewing the 1H structure, I noticed something interesting: price is trying to recover from the $3,979 support zone, even though the broader trend still looks weak. According to the Bybit chart, XAUUSDT is trading around $4,012.32, up +0.39%, with a 24H range of $3,987.50–$4,035.34. The bigger picture matters here. Price previously climbed toward $4,151.32 before facing a strong rejection and selling off aggressively. Since then, the market has been consolidating near the lows, with buyers recently pushing price back toward the $4,020–$4,035 resistance area. For me, this is not a confirmed bullish reversal yet. It's an early recovery attempt inside a broader bearish structure. KEY OBSERVATION The RSI readings are telling an interesting story: • RSI6: 35.38 • RSI12: 47.90 • RSI24: 50.35 Short-term momentum has weakened after the recent bounce, while the longer RSI readings remain closer to neutral. This suggests that buyers have not fully established control. TRADE PLAN • Resistance 1: $4,022 • Resistance 2: $4,035 • Major resistance: $4,065 • Support 1: $3,987.50 • Key support: $3,979 Bullish scenario: If buyers reclaim $4,022 and secure a strong 1H close above $4,035, followed by a successful retest, the recovery could extend toward $4,065. Bearish scenario: If price gets rejected around $4,022–$4,035 and breaks below $3,987.50, I’ll watch for a possible retest of $3,979. A confirmed breakdown below that level could expose further downside. My approach is simple: I'm not buying just because price has bounced, and I'm not selling blindly into support. I want confirmation, volume, and a clean reaction at the key levels before considering an entry. Sometimes the best trade is the one you patiently wait for. Would you trust this recovery, or wait for a confirmed breakout above $4,035? #ByXIMPACT $XAUTUSDT

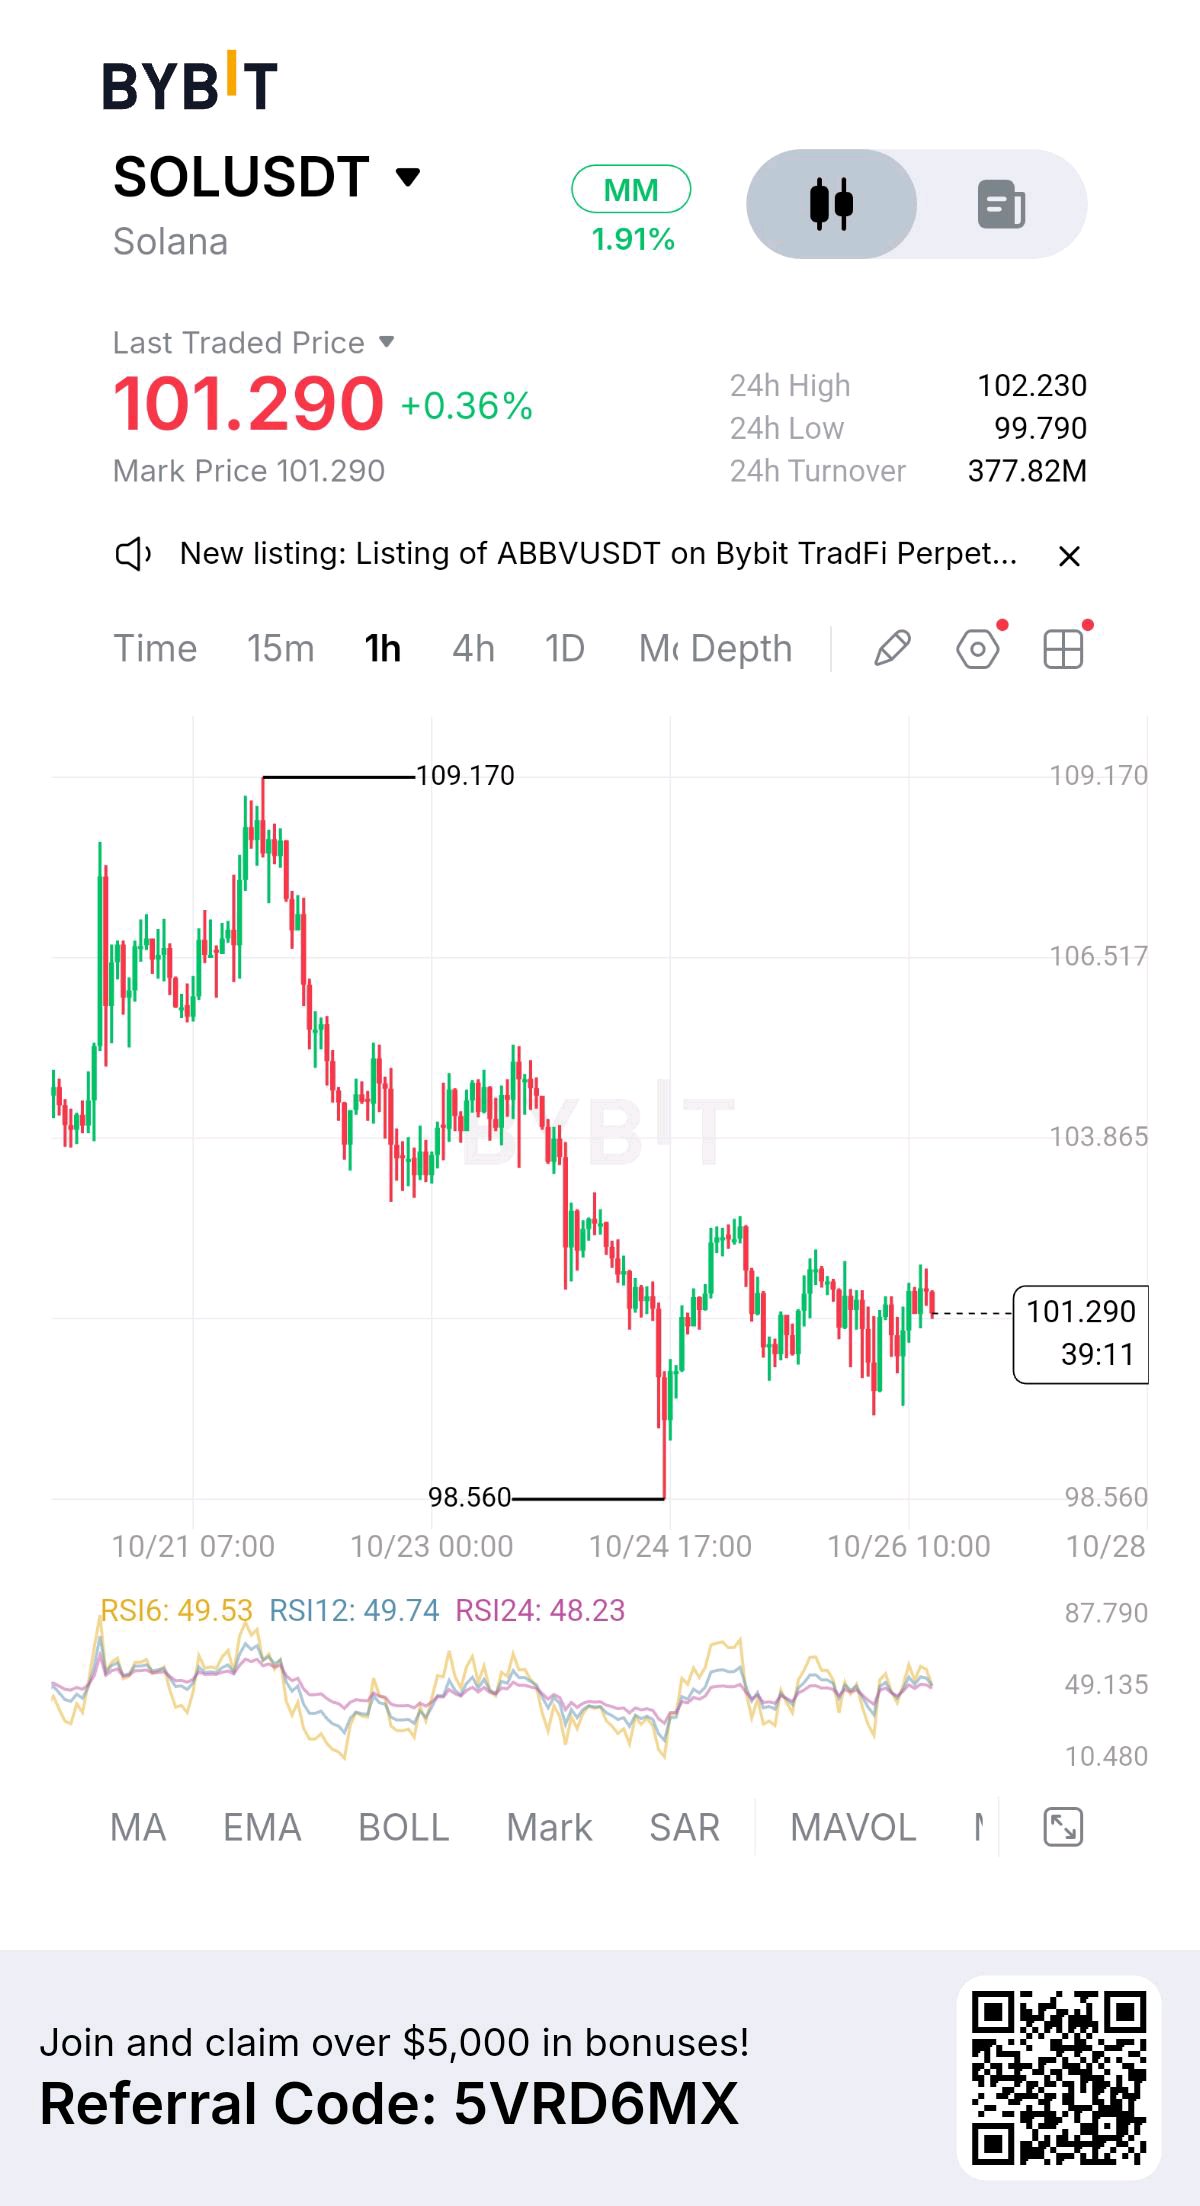
I opened $SOLUSDT on the 1H chart, and what caught my attention wasn't the small green candle. It was the structure behind it. Price is around $101.290, up +0.36%, with a 24H high of $102.230 and a low of $99.790. But looking at the bigger picture, SOL has fallen from the $109.170 swing high and is now trying to stabilize after a sharp decline. Here's what matters. SOL recently flushed toward the $98.560 chart low before recovering. Since then, price has been moving sideways, struggling to establish a clear bullish continuation. The current candles show compression around the $100–$102 area, and neither buyers nor sellers have secured a decisive advantage. RSI6 is 49.53, RSI12 is 49.74, and RSI24 is 48.23. All three are hovering around neutral territory. That tells me momentum is balanced for now, not showing a strong directional advantage. Turnover is 377.82M, which shows meaningful trading activity, but turnover alone doesn't confirm whether buyers or sellers are in control. My read: • Bias:** Neutral to slightly bearish while price remains below $102.230–$103.000 resistance. • Bullish trigger:** A strong 1H close above $102.230, followed by a successful retest → $103.865, then $106.517. • Bearish trigger: A 1H close below $99.790 → watch $98.560 as the next key support. • **Invalidation:** A confirmed breakout and hold above $103.000 would weaken my short-term bearish view. One lesson from this chart: a recovery candle doesn't automatically mean a trend reversal. SOL has bounced from its lows, but the broader structure still shows lower highs after the rejection at $109.170. I'm not chasing this move. I want to see whether buyers can reclaim resistance with convincing volume or whether this compression breaks down first. Would you buy SOL above $102.230, or wait for a pullback toward $100? #ByXIMPACT $SOLUSDT
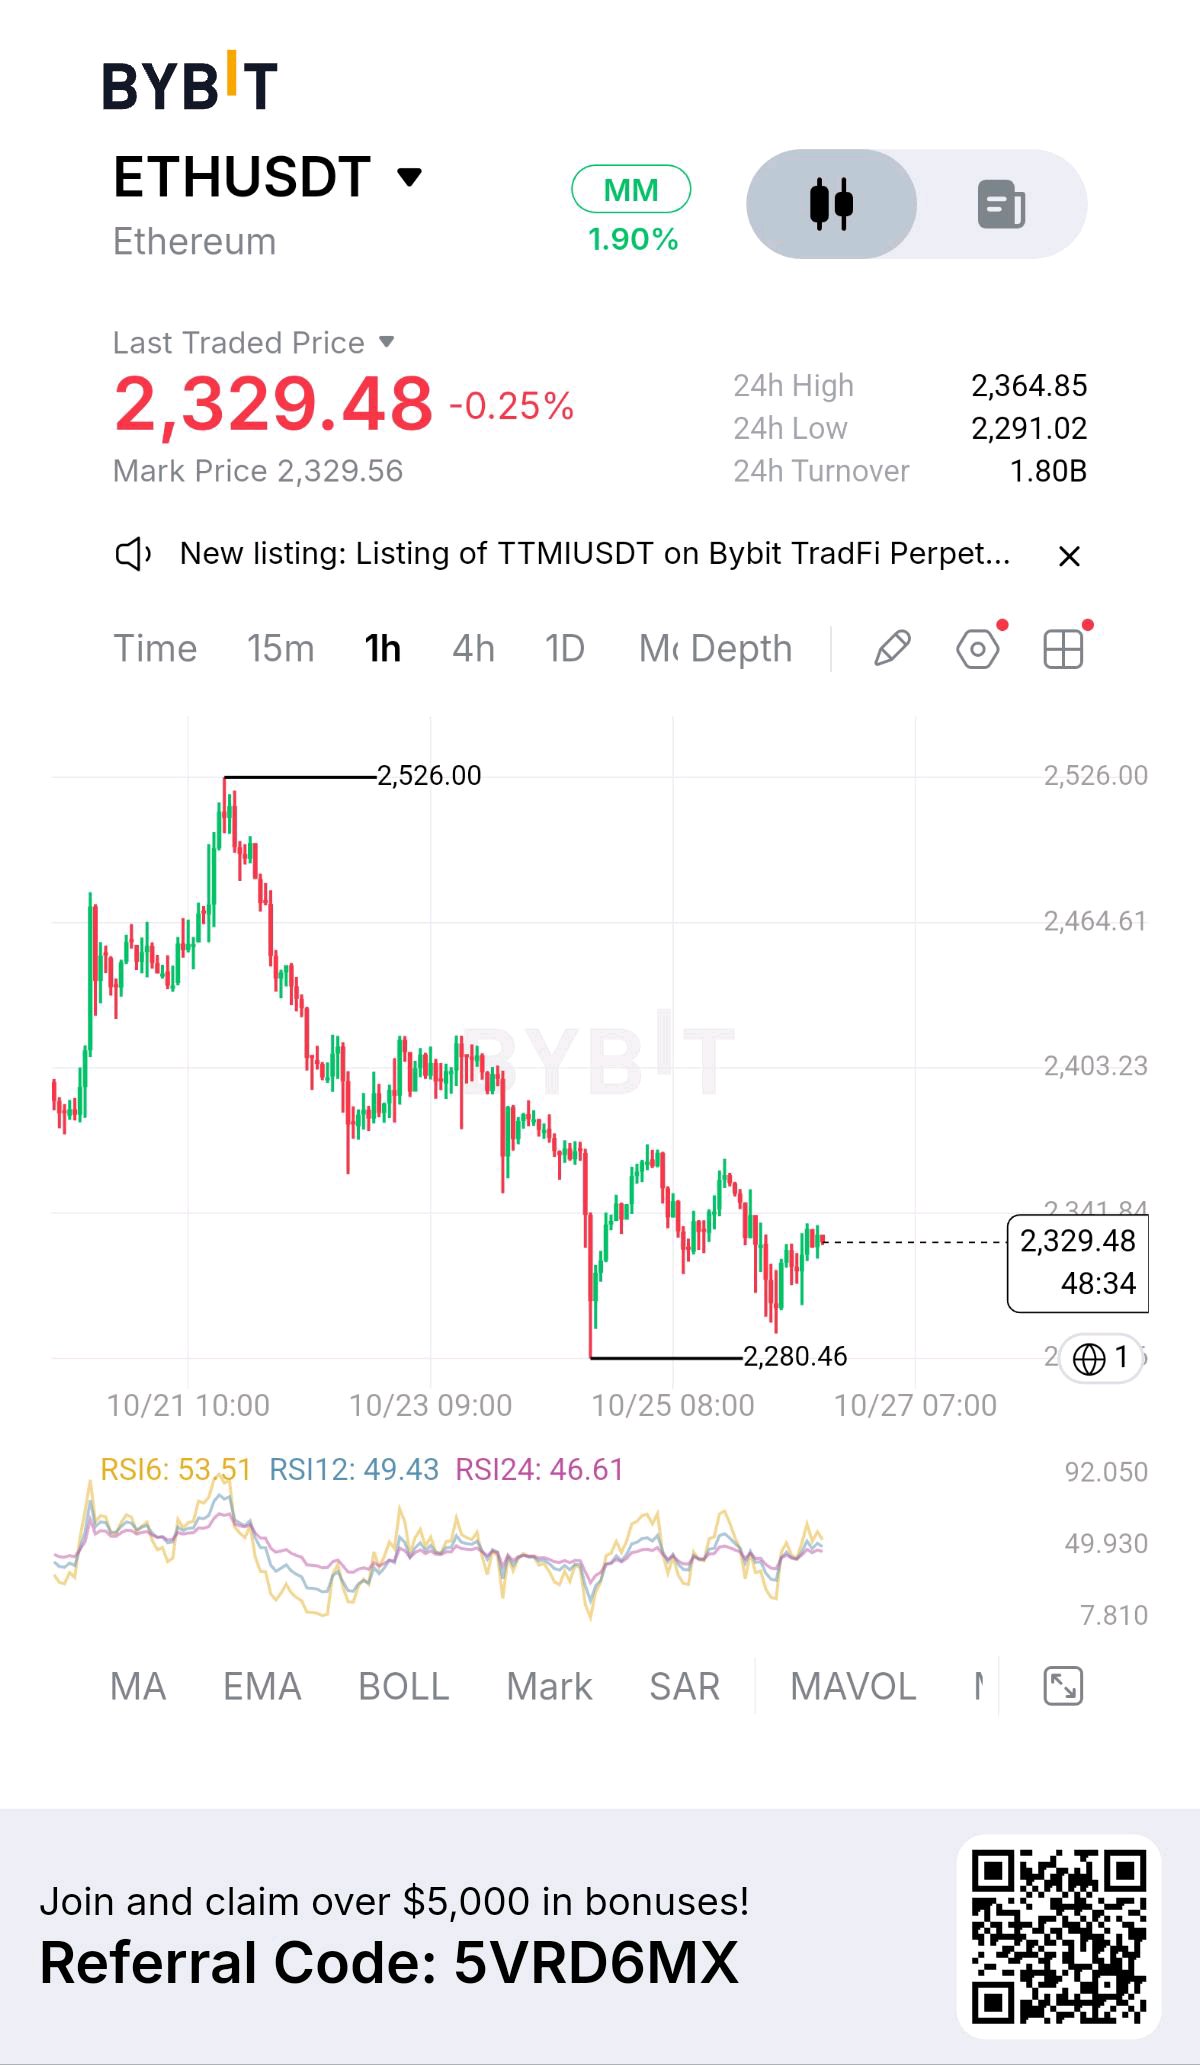
I’m not rushing into $ETHUSDT here. I opened the 1H chart, and what caught my attention is that price is trying to recover after a prolonged decline, but the bigger structure still needs confirmation. ETH is trading around $2,329.48, down 0.25%, with a 24H range of $2,291.02–$2,364.85. The chart shows a sharp rejection from the $2,526.00 high, followed by a sequence of lower highs and lower lows. That tells me sellers have controlled the broader short-term structure. However, the recent reaction from $2,280.46 is worth watching. Buyers stepped in, and price is now attempting to stabilize around $2,329.48. RSI6 is at 53.51, RSI12 at 49.43, and RSI24 at 46.61. This suggests short-term momentum is improving, but it doesn't confirm a full trend reversal. My bullish confirmation is straightforward: I want to see ETH reclaim the $2,341.84 area and break above $2,364.85 with stronger volume. If buyers sustain that move, I’ll be watching $2,403.23 as the next resistance area, followed by $2,464.61. On the other hand, if ETH gets rejected again and loses $2,291.02, selling pressure could return. A break below $2,280.46 would weaken the recovery further and could open the door to another downside move. For now, I’m not forcing a trade in the middle of this recovery. The bounce is encouraging, but a bounce alone doesn't change the market structure. I want to see buyers prove their strength before considering a bullish continuation. My approach: respect the bearish structure, watch the recovery, and let confirmation guide the next move. Would you take the bullish breakout above $2,364.85, or wait for ETH to retest support first? #ByXIMPACT $ETHUSDT

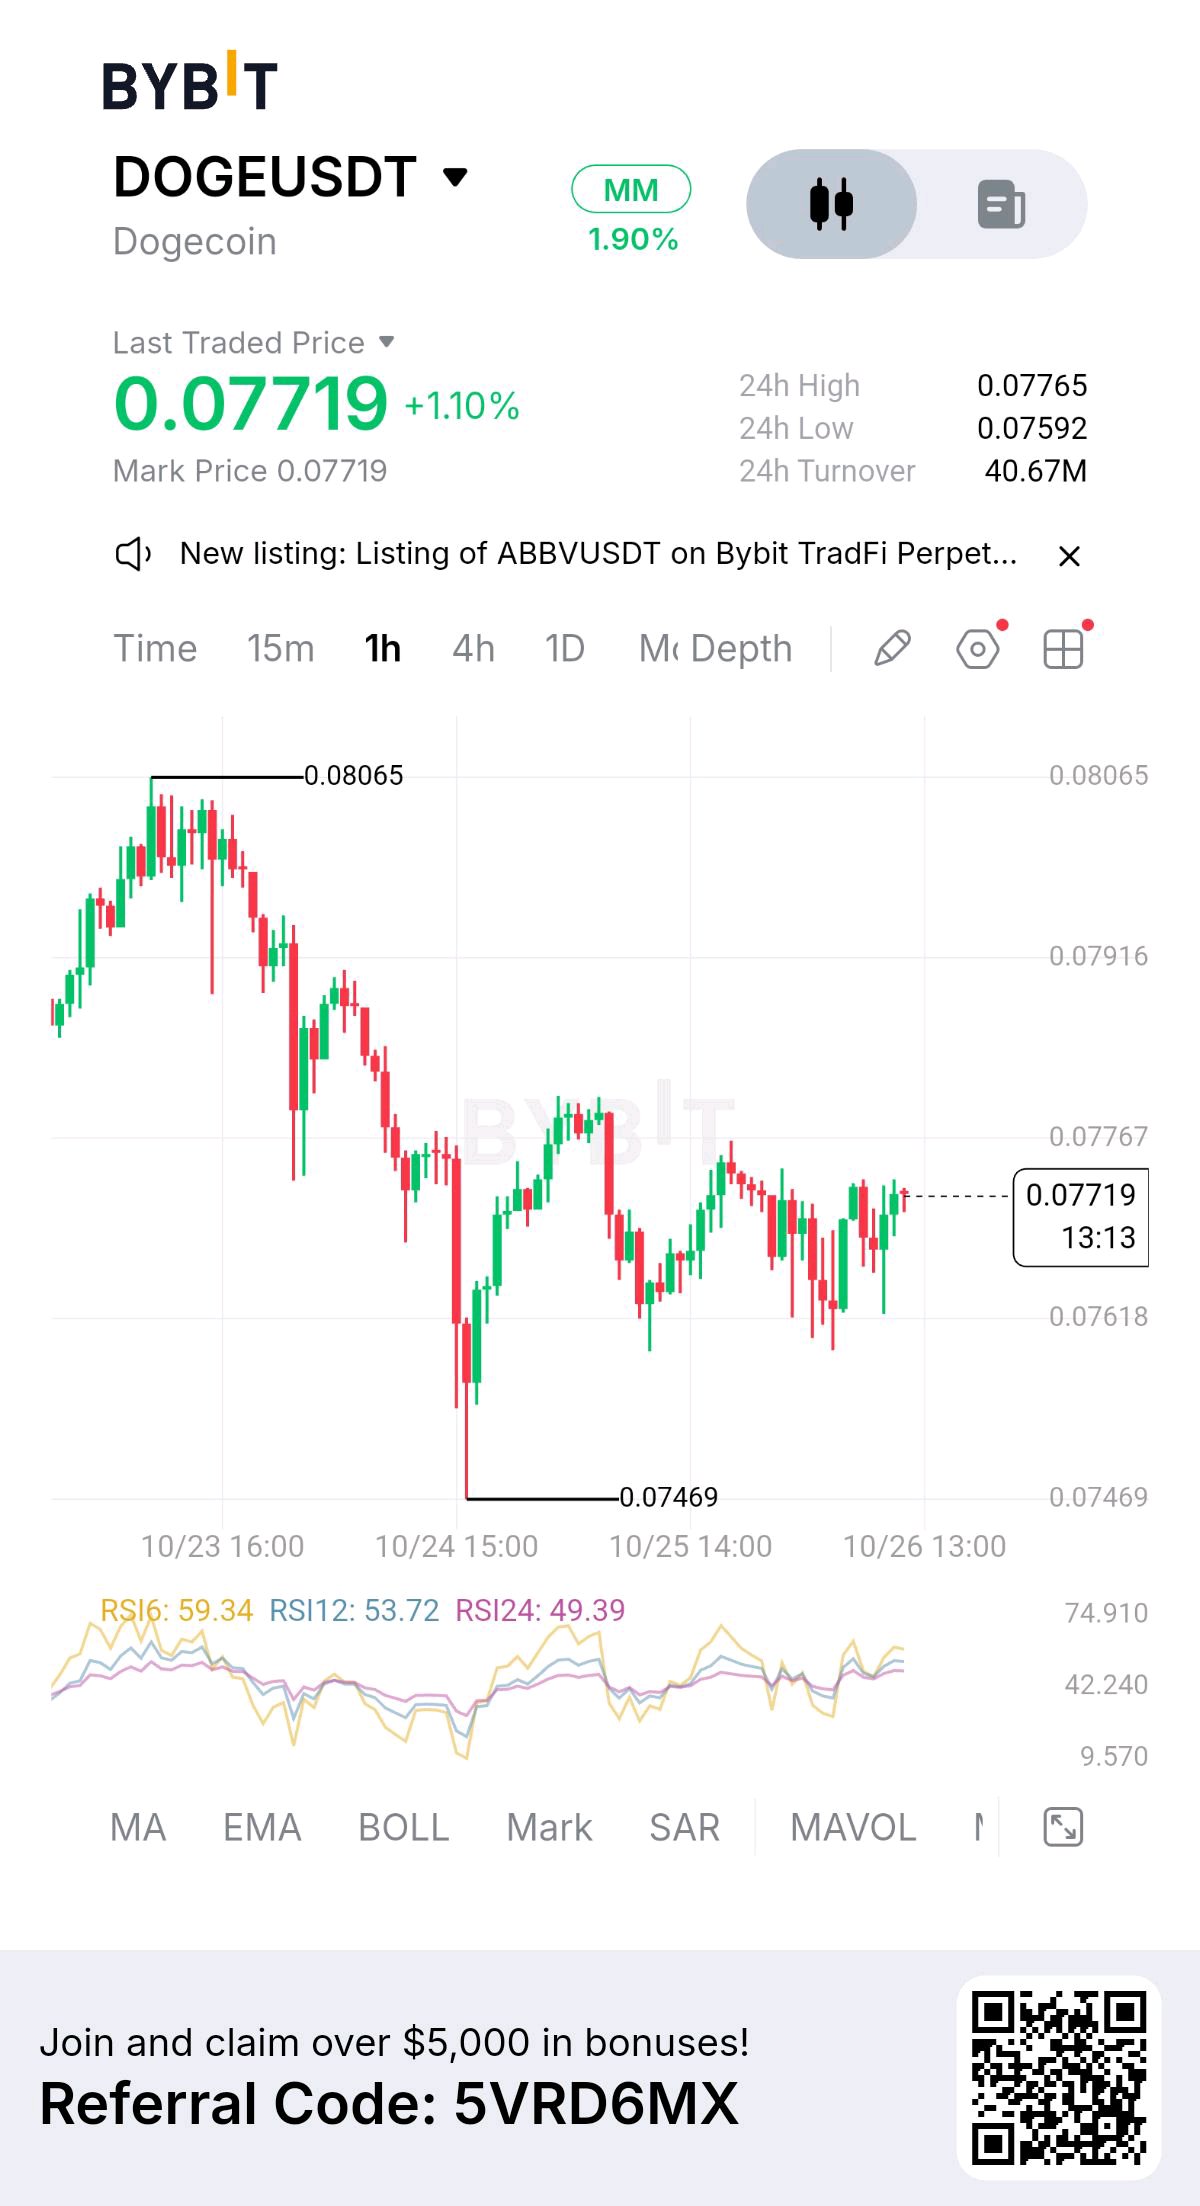
I opened $DOGEUSDT and the first thing that caught my attention was the recovery after the sharp sell-off. But what makes this chart interesting isn't just the bounce—it's how price is behaving now. We're at 0.07719, up 1.10%, with a 24H range of 0.07592–0.07765 and turnover at 40.67M. Looking at the 1H chart, DOGE previously peaked at 0.08065 before entering a clear decline. Price eventually flushed to 0.07469, then recovered toward 0.07767. Since that recovery, the market has been moving sideways, struggling to establish a decisive direction. The important part is the current structure. Price is consolidating around 0.07719, with the recent candles showing repeated attempts to push higher and pullbacks toward the 0.07618 area. This looks more like short-term compression than a confirmed bullish reversal. RSI16 is at 59.34, RSI12 at 53.72, and RSI24 at 49.39. Short-term momentum is improving, but the mixed RSI readings don't yet confirm a strong trend across all periods. My read: · Bias: Neutral to slightly bullish in the short term while price holds above 0.07618, but the broader recovery still needs confirmation. · Bullish trigger: A clean 1-hour close above 0.07767–0.07780 with stronger volume could open the way toward 0.07916, then 0.08065. · Bearish trigger: A 1-hour close below 0.07618 could expose 0.07592, followed by 0.07469. · Invalidation: As long as DOGE remains trapped between 0.07618 and 0.07767, I prefer to wait for a confirmed breakout or breakdown rather than chase candles. One thing I keep reminding myself: a recovery after a sharp decline is not automatically a trend reversal. DOGE has bounced, but buyers still need to prove they can break resistance and hold it. Would you wait for DOGE to reclaim 0.07767, or do you think this compression is setting up for another rejection? #ByXIMPACT $DOGEUSDT

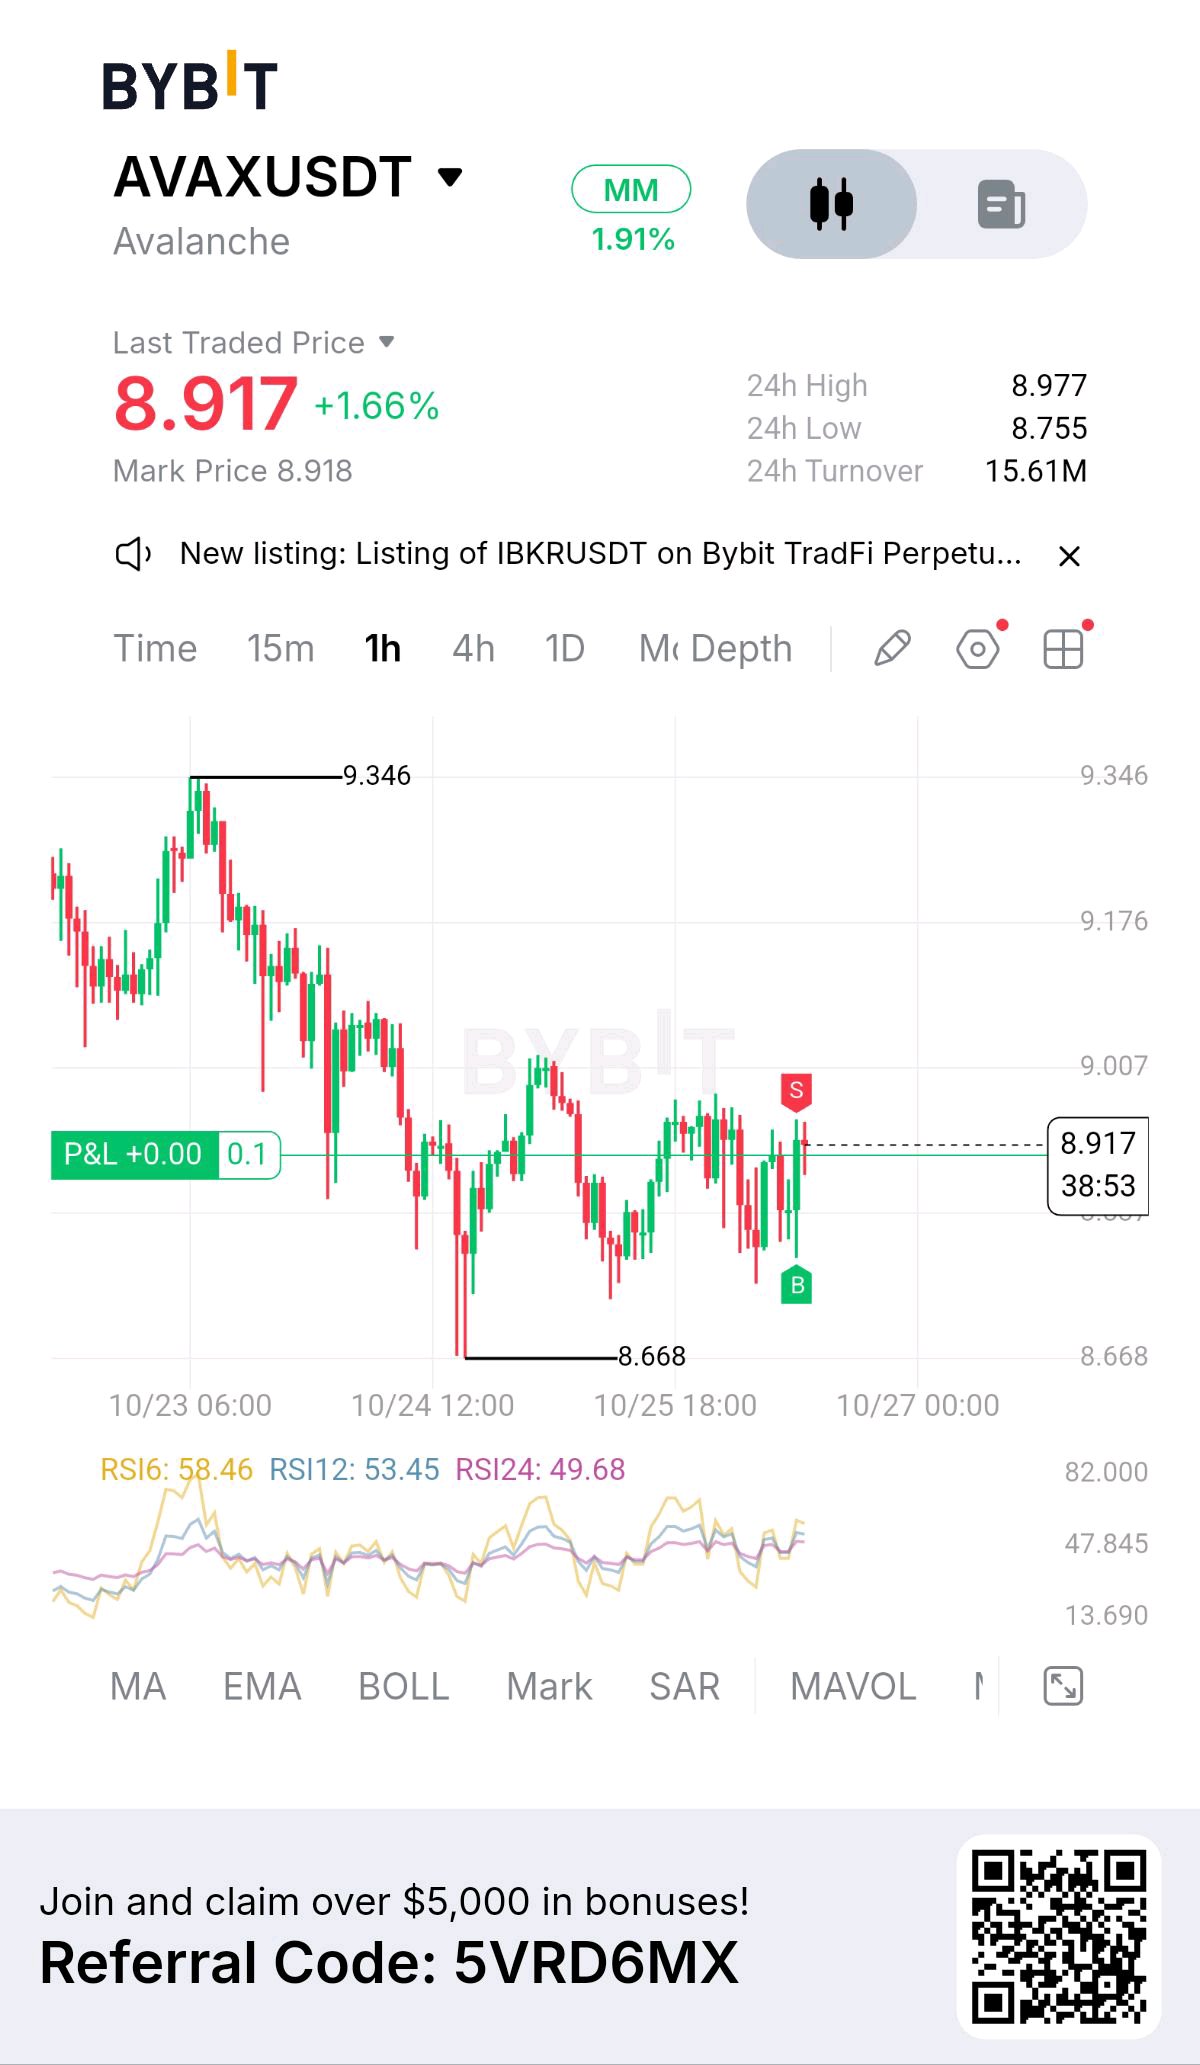
I opened $AVAXUSDT, and the first thing that caught my attention was the recovery from 8.668. Price is now trying to rebuild momentum, but the bigger structure tells a more complicated story. We're at 8.917, up 1.66%, with a 24H range of 8.755–8.977 and turnover at 15.61M. That's a decent recovery, but we're approaching a resistance area where buyers need to prove they can take control. Here's what stands out. AVAX previously peaked at 9.346 before entering a downward structure with lower highs. Now, price is bouncing around 8.80–9.00, trying to establish a stronger base. RSI6 is at 58.46, RSI12 at 53.45, and RSI24 at 49.68. Short-term momentum is improving, but the broader momentum picture isn't fully bullish yet. The immediate resistance is around 9.007. A clean 1H close above that level, followed by a successful retest, could open the door toward 9.176 and potentially 9.346. On the downside, 8.755 is the immediate support, while 8.668 remains the important swing low. Losing that area would weaken the recovery and bring the bearish continuation scenario back into focus. My read: • Bias: Neutral-to-Bullish recovery, but the broader structure remains cautious below 9.007–9.176. • Entry: I wouldn't chase the current candle. I'd wait for a confirmed breakout and retest above 9.007, or a clear rejection at resistance. • Stop Loss: Below the confirmed retest low for a breakout setup, not an arbitrary level. • Targets: 9.176 first, then 9.346 if bullish momentum continues. • Invalidation: A breakdown below 8.668 would seriously weaken the recovery thesis. One thing I've learned from charts like this: a recovery candle can look convincing without actually changing the trend. The difference is confirmation. Buyers need to reclaim resistance, not just push price higher for a few candles. Would you take the breakout above 9.007, or wait for a pullback before considering AVAX? #ByXIMPACT $AVAXUSDT