Parker
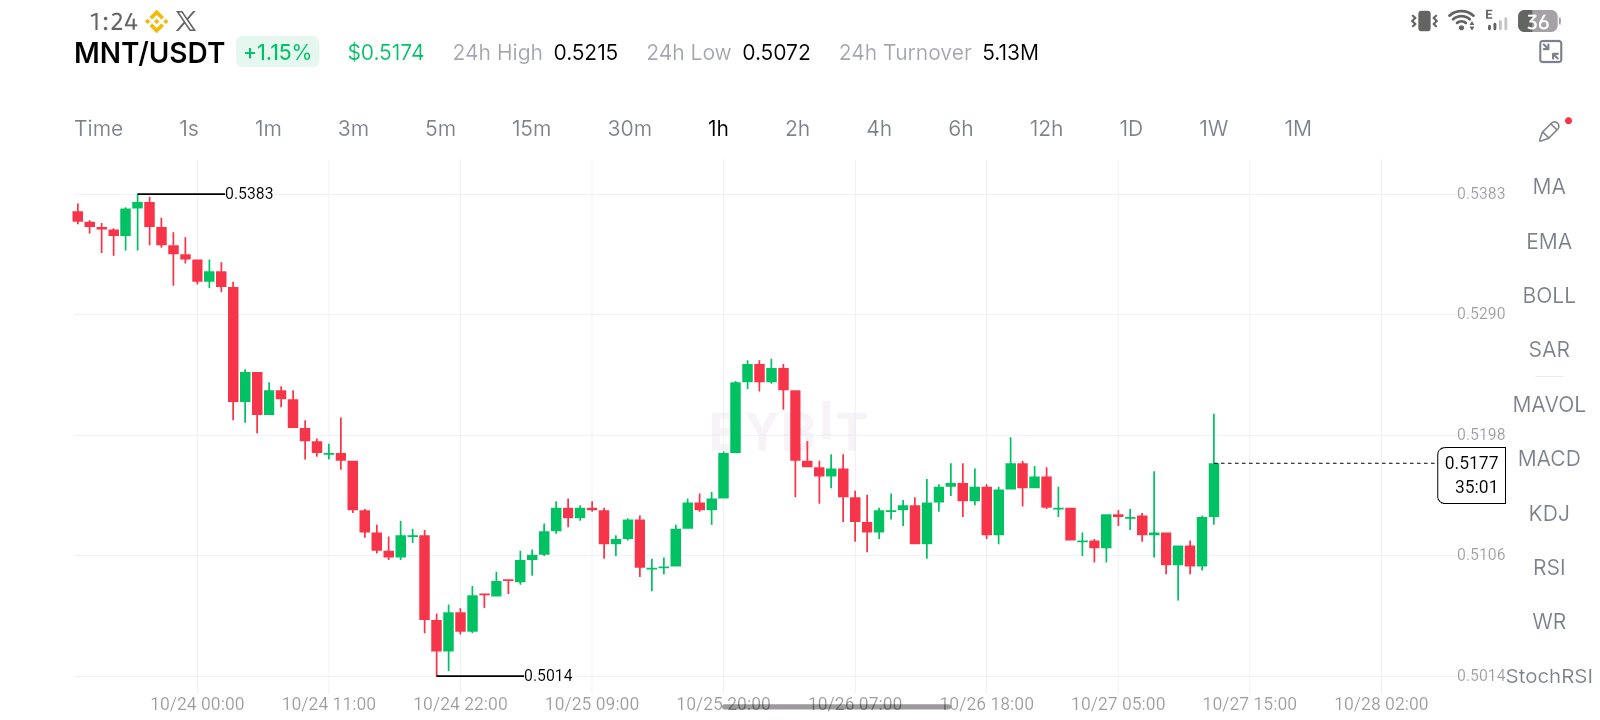
🚨 MNT/USDT — THE QUIET MOVE MAY BE OVER 👀🔥 MNT is sitting around $0.5174 (+1.15%), and the chart is starting to look VERY interesting. After falling from the $0.5383 area down to around $0.5014, MNT has spent days building a base instead of continuing the breakdown. Now look at what just happened… 👇 ⚡ PRICE: $0.5174 📈 24H HIGH: $0.5215 📉 24H LOW: $0.5072 💰 24H TURNOVER: 5.13M The latest 1H candle shows a powerful push upward from the $0.510–$0.512 zone. That makes the next few candles VERY important. 🎯 KEY RESISTANCE • $0.5198 — immediate breakout zone • $0.5215 — 24H high / first major test • $0.5290 — next psychological resistance • $0.5383 — major previous high 🛡️ KEY SUPPORT • $0.5120–$0.5106 — first support zone • $0.5072 — recent 24H low • $0.5014 — major chart support 🔥 THE INTERESTING PART If MNT can reclaim and hold above $0.5198–$0.5215 with strong volume, the market could suddenly start paying attention. A clean breakout could open the path toward: ➡️ $0.5290 ➡️ $0.5383 But here's the trap… ❌ A rejection around $0.5198–$0.5215 followed by a loss of $0.5106 could send price back toward $0.5072, with $0.5014 becoming the bigger downside level. So this isn't the moment to blindly chase a green candle. 👀 WATCH THE BREAKOUT. WATCH THE VOLUME. WATCH THE RETEST. MNT is approaching a decision point. The next move could turn this boring range into a very interesting chart. ⚡ Bullish above the resistance zone. Cautious below support. No confirmation = no chase. #ByXIMPACT $MNTUSDT

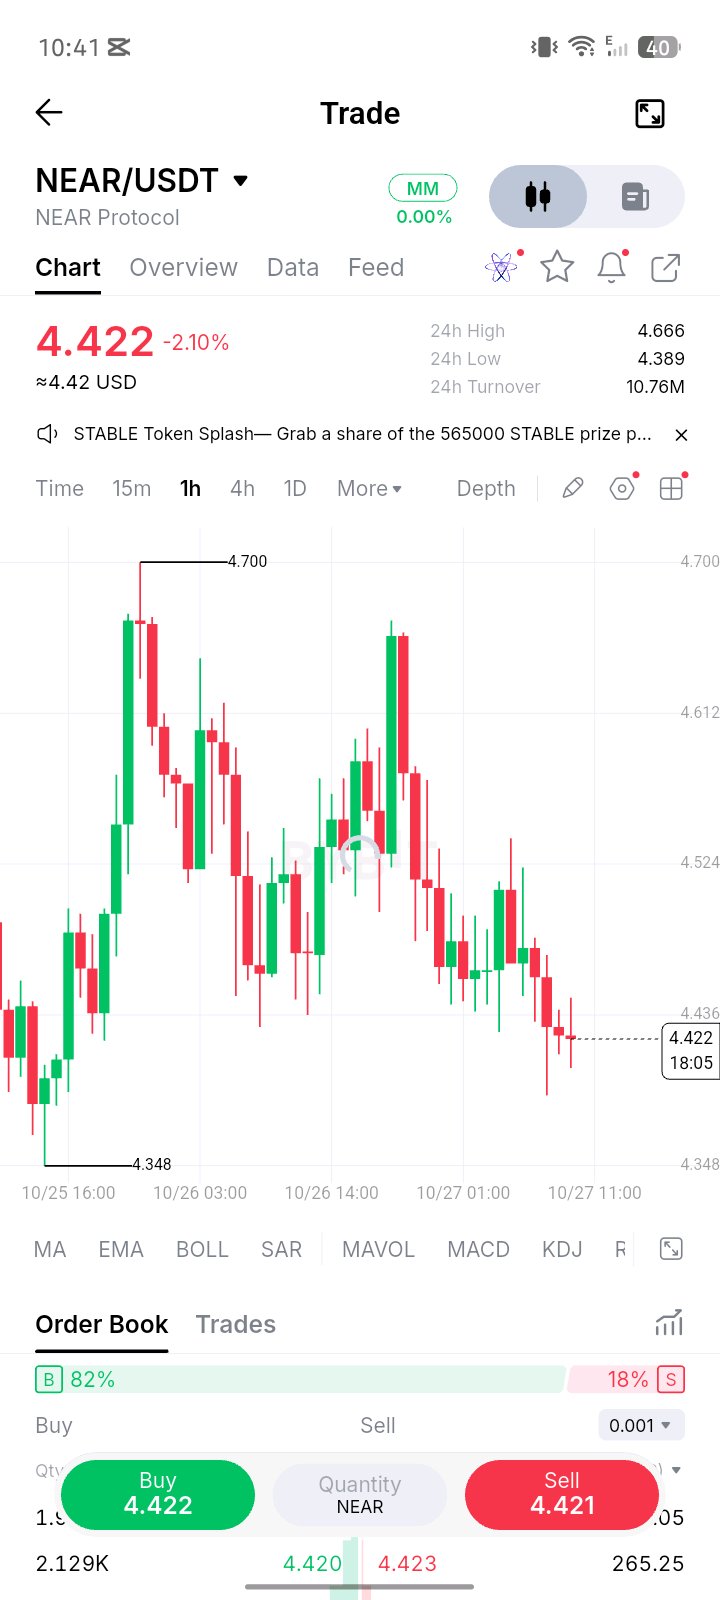
🚨 NEAR/USDT IS AT A DANGEROUS DECISION ZONE! 🚨 NEAR is currently trading around $4.422, down -2.10% on the 1H chart. But the interesting part isn’t the red candle… 👀 It’s WHERE the price is sitting. 📊 1H MARKET SNAPSHOT: 💰 Current: $4.422 🔻 24H Change: -2.10% 📈 24H High: $4.666 📉 24H Low: $4.389 💵 24H Turnover: $10.76M After getting rejected from the $4.60+ area, NEAR has been printing a series of lower highs and drifting toward the $4.39 support zone. And now comes the interesting part… ⚠️ 🔥 KEY SUPPORTS • $4.389 — immediate 24H low / critical zone • $4.348 — major visible chart support 🚀 KEY RESISTANCES • $4.436 — first hurdle • $4.524 — important recovery zone • $4.612 — major resistance • $4.700 — psychological breakout level If buyers defend $4.39–$4.35, a sharp relief move toward $4.52 → $4.61 could become interesting. BUT… 😳 If $4.35 breaks decisively, the current structure could deteriorate further. 👀 The order-book snapshot is also showing a heavily buy-weighted display — around 82% Buy vs 18% Sell — but remember, order-book ratios can change extremely fast and should NOT be treated as guaranteed support. 🎯 THE REAL BATTLE IS HERE: $4.35–$4.39 = DEFENSE ZONE 🛡️ $4.52 = FIRST RECOVERY TARGET ⚡ $4.61–$4.70 = BIG RESISTANCE WALL 🧱 NEAR is sitting at the kind of level where one strong volume candle can completely change the short-term story. Breakdown? 🩸 Reversal? 🚀 The next few 1H candles may decide it. 👀🔥 Not financial advice. Trade with your own risk management. DYOR. $NEARUSDT #ByXIMPACT

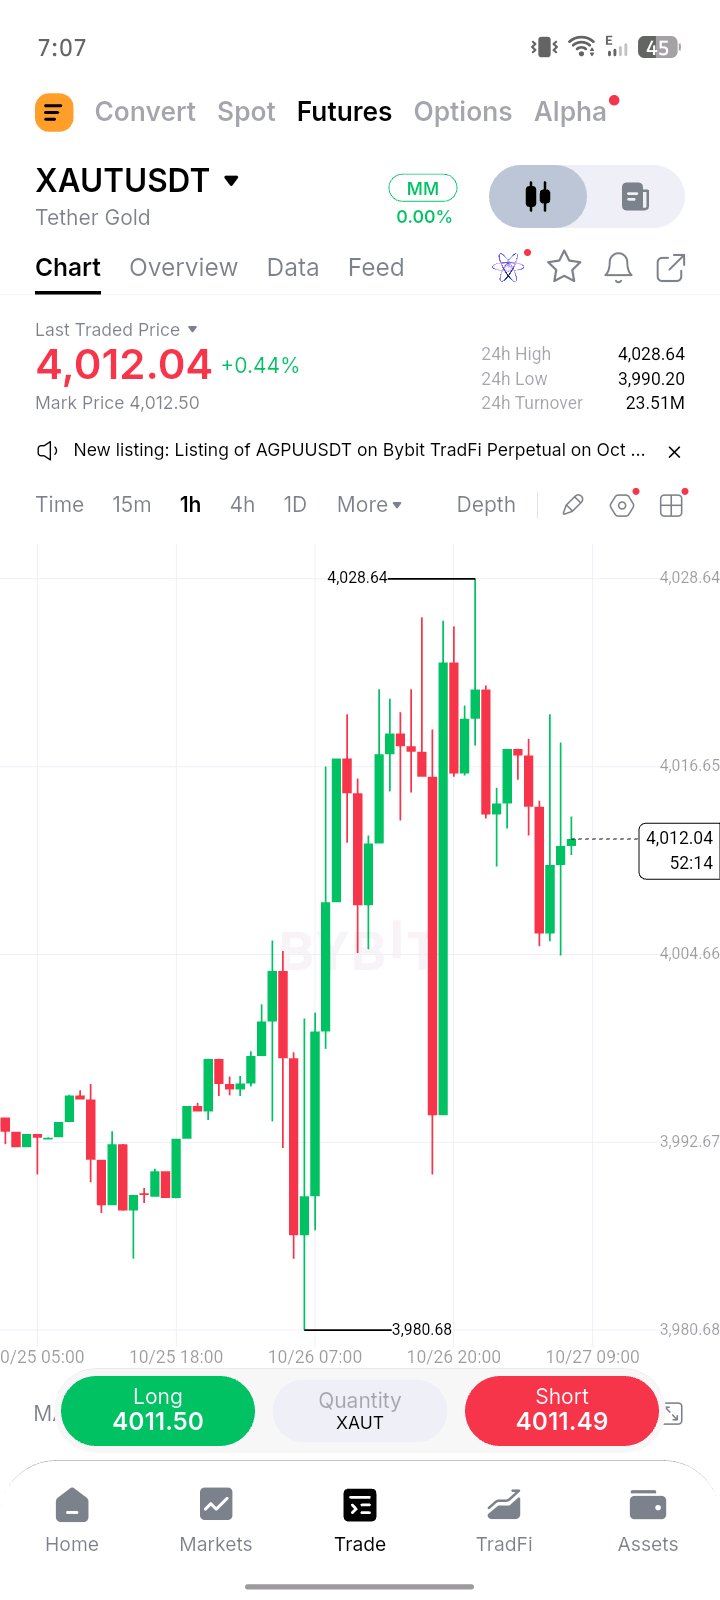
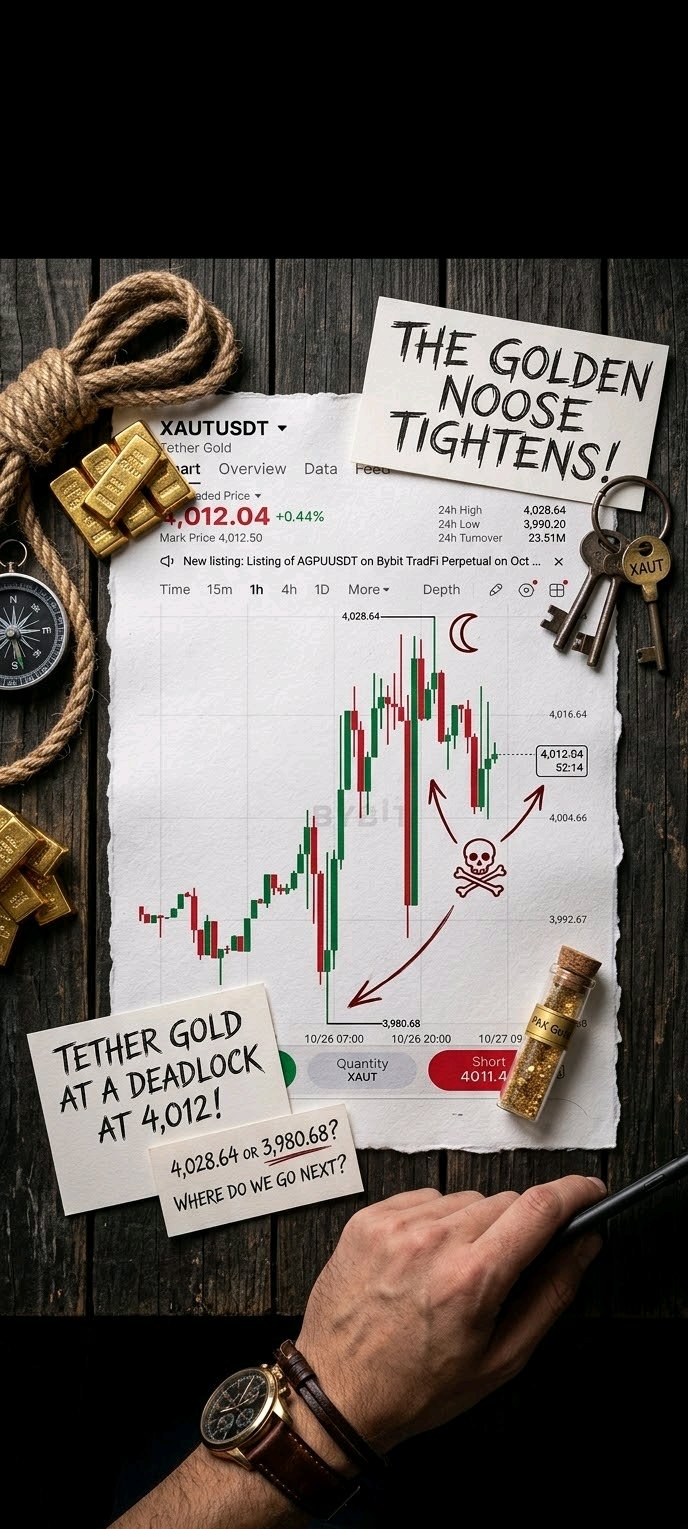
🚨 SHOCKING BREAKOUT: Gold Just Smashed Through New Territory! 💥 The markets are absolute chaos right now, and if you aren't paying attention, you are missing history in the making! Look at the numbers on the screen. This isn’t a drill—XAUTUSDT (Tether Gold Futures) is putting on a masterclass in volatility and raw market power. 📊 The Breakdown of the Madness: * Last Traded Price: 4,012.04—sitting up +0.44% and holding strong! * 24h High: Reached a blistering 4,028.64 before facing intense pressure. * 24h Low: Plunged down to a deep 3,990.20 earlier in the session, catching weak hands off guard. * 24h Turnover: A massive 23.51M flowing through the order books, showing insane liquidity and trader hunger. 🔥 What’s Happening on the Chart? Look at those 1-hour candles! The battle between bulls and bears is reaching a boiling point. After tapping that absolute ceiling at 4,028.64, a fierce rejection sent shockwaves down to the 3,980.68 floor, only for the buyers to step in with absolute aggression and claw their way back above 4,012. * Are the bulls about to reload for another legendary charge past 4,030? * Or are the bears setting a trap for a deeper retest? The tape is moving fast, emotions are running high, and every second counts in this arena. > ⚡️ The Takeaway: Fortune favors the bold, but volatility rewards the prepared. Keep your eyes glued to the charts—the next major move could happen in a heartbeat! > Are you riding the long wave or bracing for a short drop? Let’s talk about your strategy below! $XAUTUSDT #ByXIMPACT

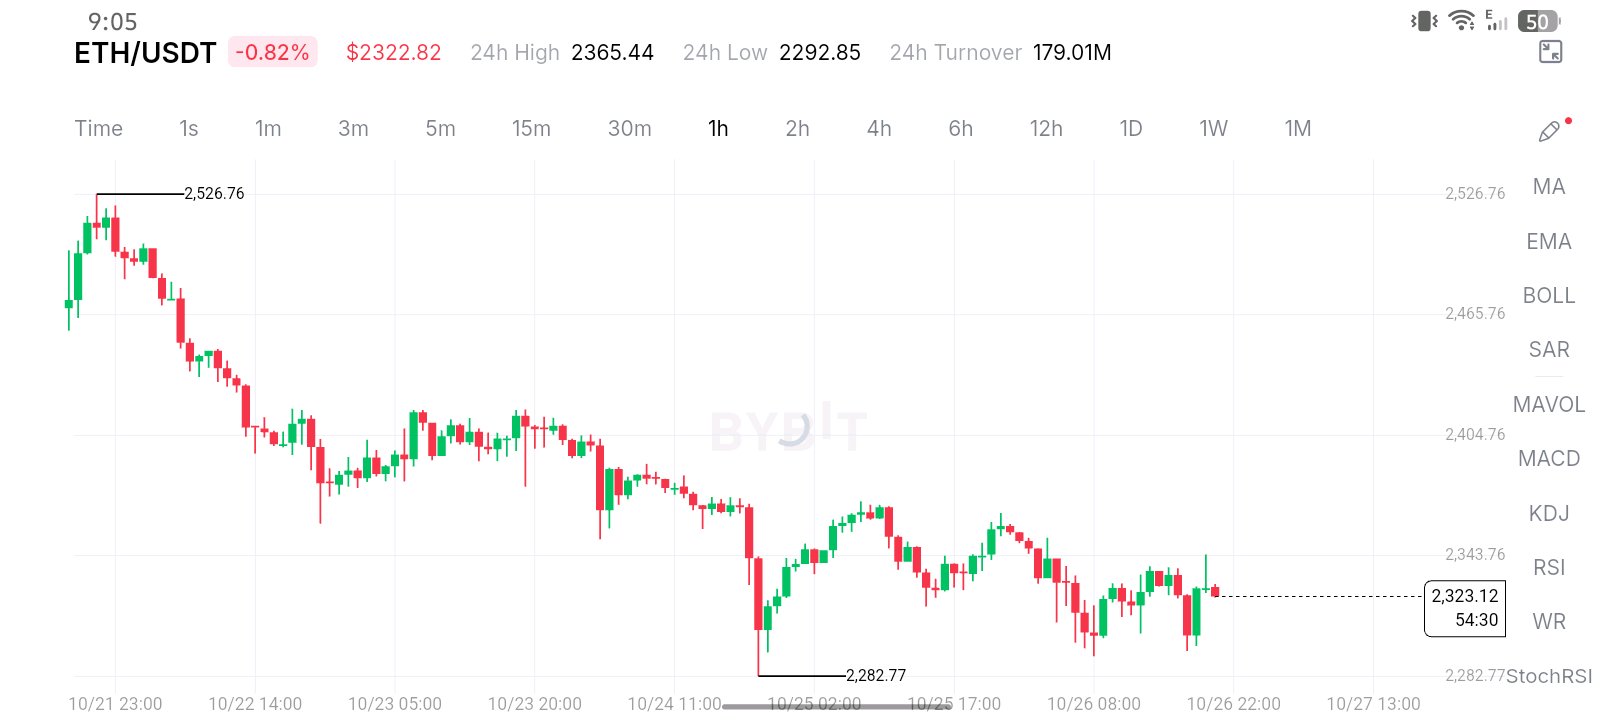
🚨⚡ ETHEREUM AT A CRITICAL CROSSROADS! THE NEXT MOVE COULD SHOCK THE MARKET! ⚡🚨 🔥 ETH/USDT — BEARS IN CONTROL, BUT BULLS ARE FIGHTING BACK! 🔥 Ethereum is trading around $2,322.82, and the 1-hour chart is revealing a battle that traders cannot afford to ignore! 📉🐂 The market has been bleeding from the highs, but repeated reactions near the lower support zone suggest that the next decisive move could bring a dramatic change in momentum. 👀💥 📊 🔥 ETHEREUM MARKET BREAKDOWN 🔥 💰 Current Price: $2,322.82 🔻 24H Change: -0.82% 🚀 24H High: $2,365.44 🩸 24H Low: $2,292.85 💎 24H Turnover: 179.01M USDT ⏰ Chart Timeframe: 1H 📉 Visible Chart High: $2,526.76 🛡️ Visible Chart Low: $2,282.77 🐻 BEARS' ADVANTAGE — THE DOWNTREND IS STILL ALIVE! Ethereum has fallen significantly from the visible chart high near $2,526.76. The chart continues to show lower highs and lower lows, suggesting that sellers still have the upper hand. ⚠️ If ETH loses the $2,292–$2,283 support zone, bearish pressure could intensify, potentially opening the door to another downside move. 🐂 BULLS' SECRET WEAPON — CAN SUPPORT SAVE ETH? Buyers have stepped in during previous dips, including a sharp rebound from the visible low near $2,282.77. 🔥 If bulls defend support and reclaim the nearby resistance levels, a recovery toward $2,344 and $2,365 could become possible. But remember: a bounce is not the same as a confirmed trend reversal! 🎯 KEY PRICE LEVELS TO WATCH 🟢 Support Zone 1: $2,300–$2,293 🟢 Major Support: $2,283 🔴 Resistance 1: $2,344 🔴 Resistance 2: $2,365 🚀 Next Upside Area: $2,400–$2,405 ⚠️ Major Trend Challenge: $2,450+ 📈 BULLISH SCENARIO: If ETH holds support, builds buying pressure, and breaks above $2,344, traders may watch for a move toward $2,365 and potentially $2,400–$2,405. 📉 BEARISH SCENARIO: If ETH fails to reclaim resistance and breaks below $2,292–$2,283, the downtrend could extend. A confirmed breakdown would be more significant than a temporary wick below support. 🧠 THE SMART TRADER'S GAME PLAN ✅ Watch for a confirmed 1H candle close above or below key levels. ✅ Look for volume confirmation before trusting a breakout. ✅ Avoid chasing sudden green or red candles. ✅ Use a stop-loss and manage position size carefully. ✅ Remember that fake breakouts can trap both bulls and bears. 💣 THE BIG QUESTION: WILL ETHEREUM REBOUND OR BREAK DOWN? The chart currently favors caution because the broader visible structure remains bearish. However, the support zone is where the next important battle may unfold. 🔥 No blind predictions. No guaranteed profits. Just levels, patience, and disciplined trading! 👇 YOUR TURN, CRYPTO COMMUNITY! #ByXIMPACT $ETHUSDC $ETHUSDT

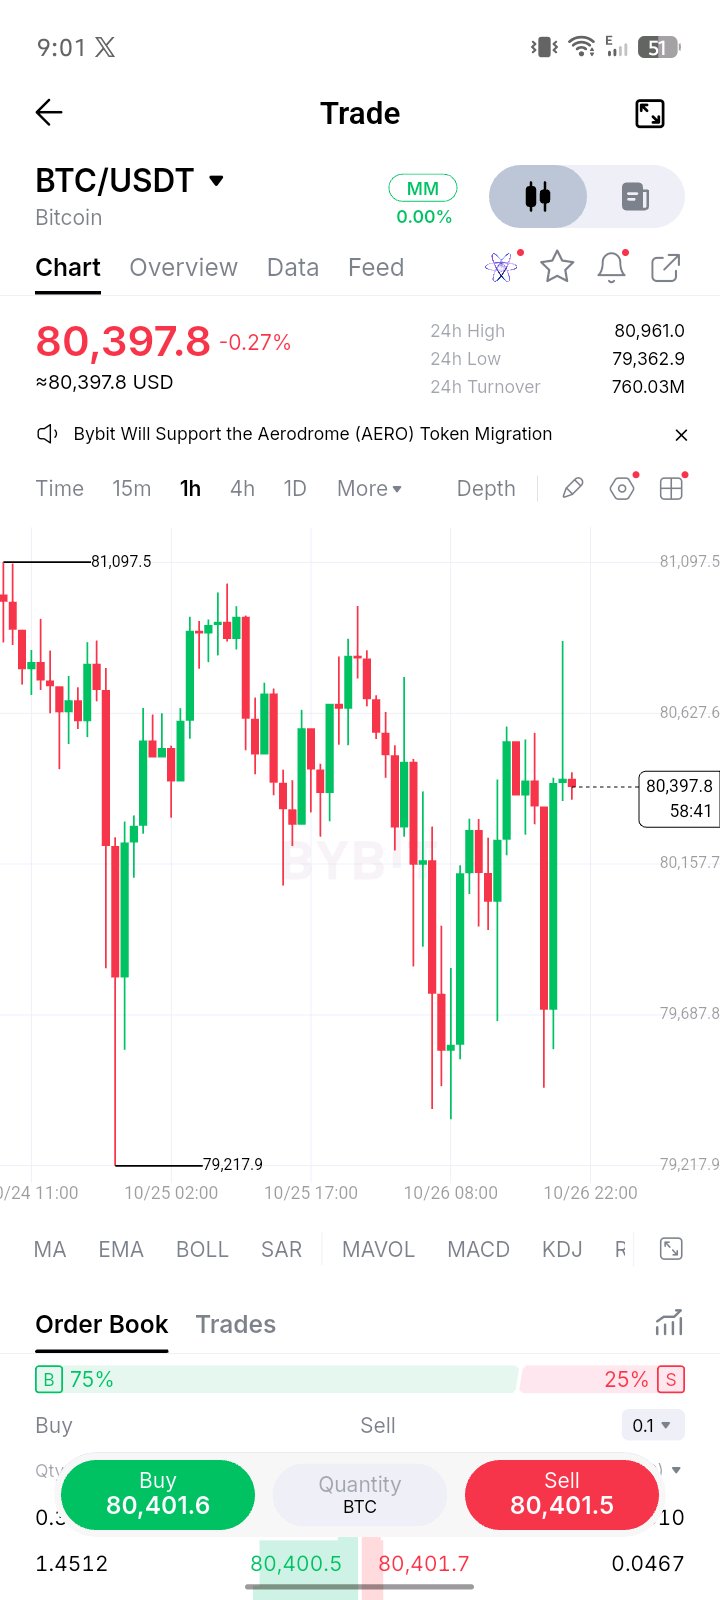
🚨⚡ BITCOIN AT A DANGEROUS CROSSROAD! $BTC IS PLAYING WITH FIRE 🔥📉📈 💥 BTC/USDT — THE NEXT BIG MOVE COULD SHOCK THE MARKET! Bitcoin is trading around $80,397.8 on the 1H chart, and the price action is getting WILD! 👀🐂🐻 One aggressive move up… one brutal rejection… and now BTC is fighting to find its next direction. Will the bulls take control, or will the bears drag Bitcoin back into the danger zone? ⚔️ 📊 LIVE CHART BREAKDOWN 🟢 Current Price: $80,397.8 🔴 24H Change: -0.27% 🚀 24H High: $80,961.0 🩸 24H Low: $79,362.9 💰 24H Turnover: $760.03M ⏳ Timeframe: 1 Hour (1H) 🎯 KEY LEVELS EVERY TRADER SHOULD WATCH 🟢 RESISTANCE ZONE • $80,600–$80,630 • $80,900–$80,960 A strong breakout and hold above resistance could open the door for another bullish push. 🚀 🔴 SUPPORT ZONE • $80,150–$80,200 • $79,680–$79,700 • $79,360–$79,220 If sellers regain control, these lower zones could come back into focus. A breakdown may trigger another wave of volatility. 🩸 🐂 BULLISH SCENARIO If BTC reclaims $80,630 and holds above it, buyers could challenge $80,900–$80,960 next. A convincing breakout is the confirmation bulls need. 🐻 BEARISH SCENARIO If BTC loses the $80,150 area and fails to recover, watch $79,700 and then the broader $79,360–$79,220 zone for potential downside tests. ⚠️ THE BIG WARNING: The chart shows sharp wicks in both directions. That means sudden reversals and stop-loss hunts are possible. Don't mistake one green candle for a confirmed trend reversal! 🧠 SMART TRADER GAME PLAN ✅ Wait for a candle close and confirmation. ✅ Watch volume around key levels. ✅ Set a stop-loss before entering. ✅ Keep leverage under control. ❌ Don't FOMO into a breakout. ❌ Never risk your entire account on one trade. 🔥 THE REAL QUESTION IS… Will Bitcoin explode above $80,960 and surprise the bears, or will another rejection send BTC tumbling toward $79,700? 👀 Keep your eyes on the levels. The next move matters—but confirmation matters MORE! #ByXIMPACT $BTCUSDT

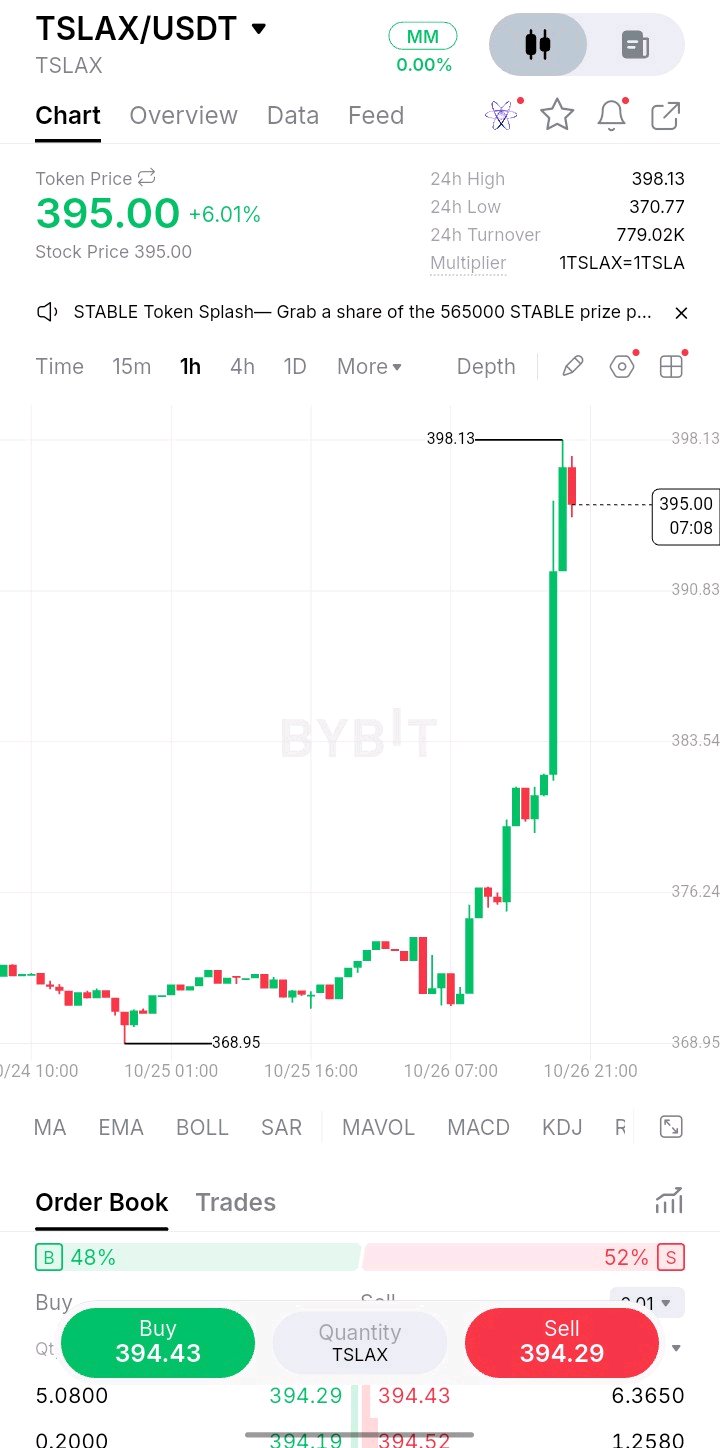
🚨🔥 TSLAX JUST EXPLODED +6.01% — IS THIS THE START OF ANOTHER MASSIVE MOVE OR A TRAP BEFORE THE DROP? 👀📈 💥 THE CHART IS SCREAMING MOMENTUM! $TSLAX/USDT has just delivered a powerful bullish breakout, sending shockwaves through the chart! 🚀 Buyers pushed the price from the 369–376 zone all the way toward 398.13 — a move that has traders watching every candle. 📊 LIVE MARKET SNAPSHOT (from the screenshot) 🪙 Pair: TSLAX/USDT 💵 Current Price: 395.00 USDT 🟢 24H Change: +6.01% 🚀 24H High: 398.13 🔻 24H Low: 370.77 💰 24H Turnover: 779.02K ⏰ Chart Timeframe: 1 Hour 📈 Recent Move: A sharp bullish surge followed by a small pullback near the highs. 🔥 THE LEVELS THAT MATTER NOW! 🎯 Resistance Zone: 398.13 — 400.00 A break and hold above this area could signal another attempt to push higher. 🟢 First Support: 390.80 🟢 Next Support: 383.50 🟢 Major Watch Zone: 376.20 ⚡ BULLISH SCENARIO: If buyers defend the support zones and price breaks above 398.13 with strong volume, momentum could continue. ⚠️ BEARISH SCENARIO: If price fails to break resistance and selling pressure increases, a deeper pullback could follow. After such a rapid rally, chasing the top can be dangerous! 🧠 SMART TRADER'S TAKE: The trend looks strongly bullish on this 1H chart, but the latest red candle near the high shows why confirmation matters. Watch the breakout, volume, and support reaction before making a move. 🚨 DON'T CONFUSE A BIG GREEN CANDLE WITH A GUARANTEED PROFIT! Wait for confirmation. Protect your capital. Trade your plan. #ByXIMPACT $TSLAXUSDT

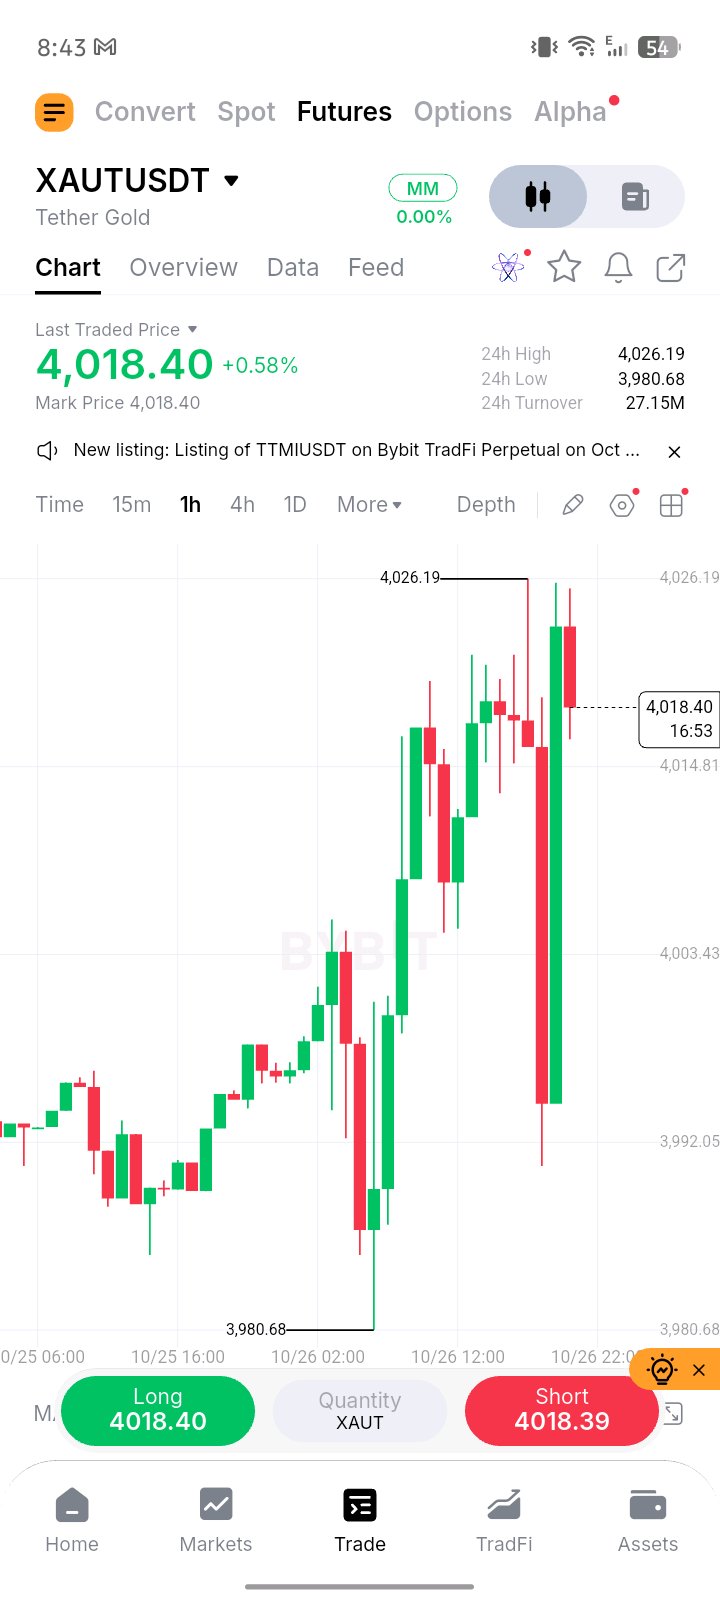
🚨🔥 GOLD JUST PULLED A MOVE THAT CAUGHT TRADERS OFF GUARD! 😱⚡ 🥇 XAUTUSDT — TETHER GOLD | FUTURES MARKET 💥 One brutal drop. One explosive recovery. And now… GOLD IS FIGHTING AT THE TOP! 📈👀 The 1H chart is showing a wild battle between buyers and sellers. Price plunged toward the lows, bounced back aggressively, and climbed toward a key resistance zone. But the next move? That's where things get interesting! 🎯 📊 LIVE CHART BREAKDOWN 🟢 Trading Pair: XAUTUSDT ⏰ Timeframe: 1 Hour (1H) 💰 Last Traded Price: $4,018.40 📈 24H Change: +0.58% 🚀 24H High: $4,026.19 🔻 24H Low: $3,980.68 💎 24H Turnover: 27.15M 📍 Mark Price: $4,018.40 🔥 THE LEVELS EVERY TRADER SHOULD WATCH 🟥 Resistance Zone: $4,026.19 Can buyers break above the recent high and sustain the momentum? A convincing breakout could open the door to another upward push. 🟩 Immediate Price Battle: Around $4,018–$4,020 Gold is hovering near this area, where the next candles may reveal whether buyers can regain control. 🟨 Potential Support Area: $4,014–$4,015 Watch for price reactions here. A breakdown could weaken the short-term bullish structure. 🟦 Major Intraday Support: $3,992 A deeper pullback could bring this zone back into focus. 🛡️ Key Swing Low: $3,980.68 A critical low on the displayed chart. A return toward this level would signal a much deeper retracement. ⚔️ BULLS vs BEARS — WHO WINS NEXT? 🐂 BULLISH SCENARIO: If XAUTUSDT breaks above $4,026.19 and holds the breakout, buyers may attempt to push price toward higher levels. Confirmation is essential! 🐻 BEARISH SCENARIO: If price gets rejected near resistance and loses the $4,014 area, sellers could push it toward $4,003, followed by the $3,992 region. ⚡ THE SHOCKING TWIST: That massive red candle followed by a powerful green recovery shows just how violently price can move in both directions. But don't mistake a dramatic rebound for guaranteed continuation! 🧠 SMART TRADER CHECKLIST ✅ Wait for a confirmed breakout or rejection. ✅ Watch candle closes, not just wicks. ✅ Use a predefined stop-loss and sensible position size. ✅ Avoid chasing sudden pumps. ✅ Remember: futures leverage can liquidate your position quickly. 🚨 MY TAKE: GOLD IS AT A DECISION POINT! The $4,026.19 high is the level to watch for a potential bullish breakout, while a loss of nearby support could bring sellers back into the game. No blind entries. No emotional trading. Let PRICE CONFIRM THE MOVE! 🎯🔥 #ByXIMPACT $XAUTUSDT