MahaDev
Let's Share some Love and money
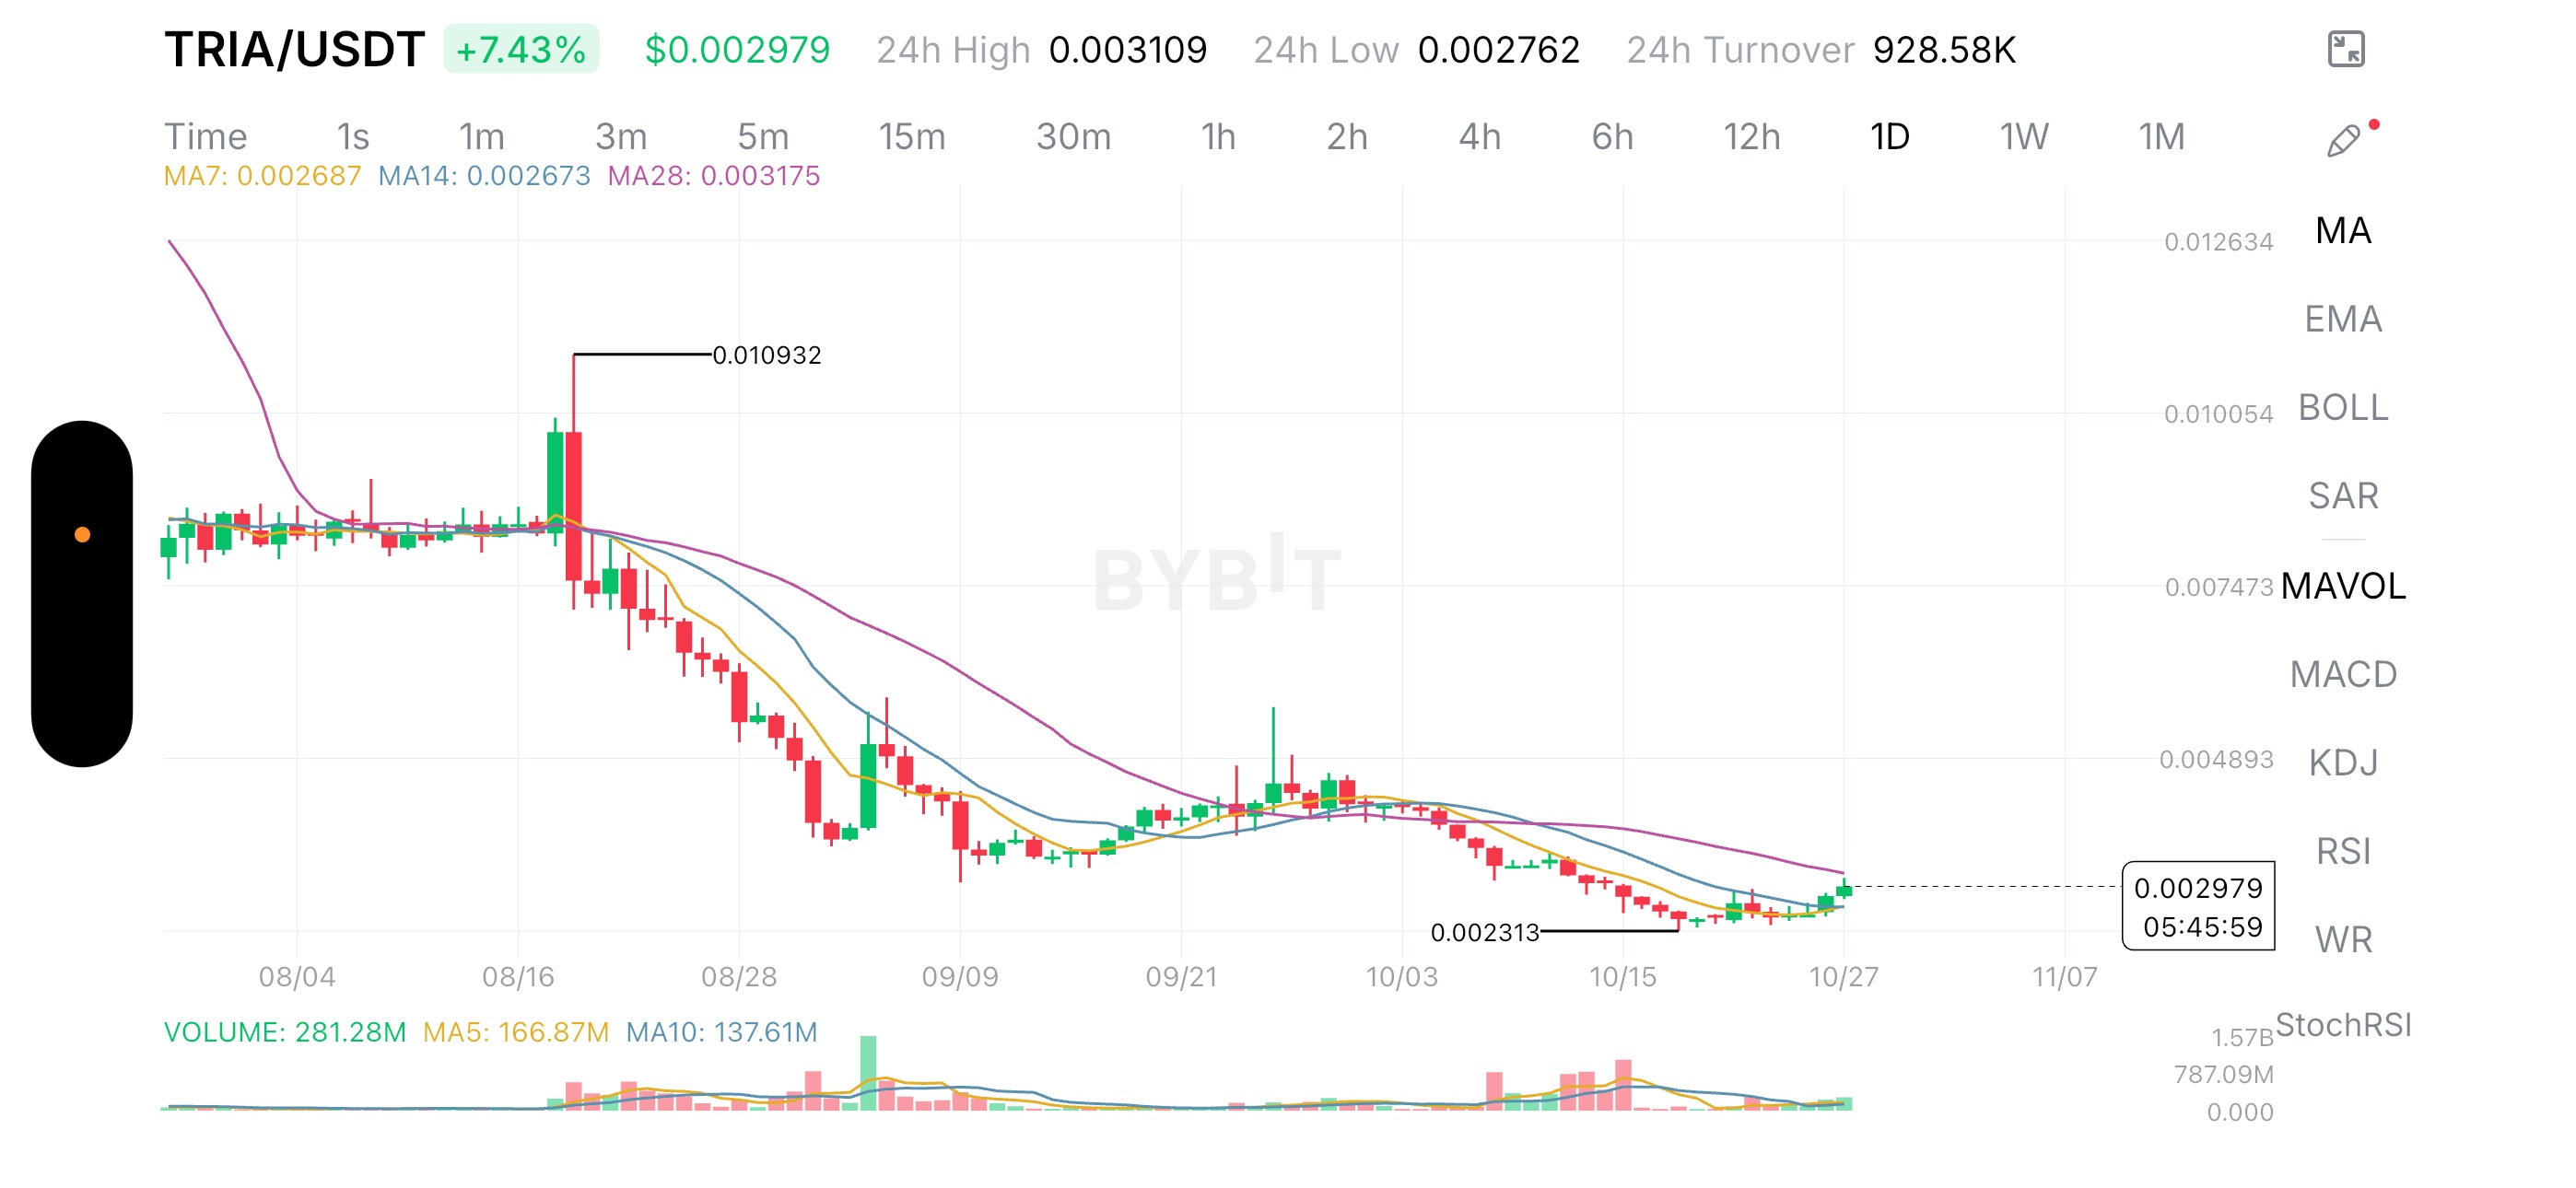
TRIA is trading near $0.002979, up 7.43% on the day. That looks encouraging until I zoom out to the daily chart. The token previously traded near $0.010932 before entering a prolonged decline, eventually reaching a marked low around $0.002313. The current move is meaningful, but it is happening inside a much larger downtrend. The market question I find most important is whether TRIA is beginning to build a durable base or simply experiencing a relief rally after an extended sell-off. The distinction matters because a token can produce a strong daily percentage gain without reversing its broader market structure. The first encouraging sign is the change in short-term momentum. TRIA is trading above its MA(7) at $0.002687 and MA(14) at $0.002673. It is also approaching the MA(28) at $0.003175, which remains above the current price. The shorter averages have started to respond to the recovery, but the longer average still represents an important hurdle. For me, $0.00315–$0.00320 is the first zone that deserves serious attention. It is close to the 28-period moving average, making it a useful test of whether the rebound can overcome the prevailing downward pressure. A daily close above that area, followed by a successful retest, would provide stronger evidence than the current green candles alone. The longer-term structure explains why I remain cautious. Following the spike toward $0.010932 in August, TRIA suffered a sharp reversal and continued to print lower prices. The subsequent recovery toward the $0.0045–$0.0049 region failed to establish a sustained uptrend. Selling pressure returned, and the token eventually approached $0.002313 in October. That history creates an important problem for bullish traders: there may be holders from higher price levels who view any recovery as an opportunity to exit. The chart cannot confirm how many such holders remain, but previous trading areas can become resistance when buyers attempt to revisit them. Volume is the second piece of evidence. The screenshot displays volume of 281.28M, compared with the MA(5) at 166.87M and MA(10) at 137.61M. That is a substantial increase relative to the displayed averages. It suggests that the latest price move is accompanied by stronger trading activity rather than occurring on unusually quiet volume. However, volume alone cannot tell us whether the activity represents sustained accumulation, speculative momentum, or short-term traders taking advantage of volatility. The next sessions will help distinguish a continuing demand shift from a temporary burst of interest. There is also a counterargument worth considering. TRIA has already fallen considerably from its earlier high, and the area around $0.002313 appears to have attracted enough buying interest to interrupt the decline, at least temporarily. If the token can establish higher lows and reclaim $0.00320, the current rebound could develop into a more meaningful recovery. A previous downtrend does not guarantee another decline. Still, I would not label TRIA fundamentally undervalued based on this chart. The screenshot does not establish current project adoption, circulating supply changes, upcoming unlocks, token utility, or revenue generation. Without those facts, I cannot determine whether the market price is disconnected from the project’s underlying economics. What I would watch next Bullish scenario: A daily close above $0.00320, supported by continued volume, would improve the setup. The next chart reference is around $0.0038–$0.0040, followed by the earlier consolidation region near $0.0045–$0.0049. These are potential resistance areas, not guaranteed targets. Bearish scenario: If TRIA fails near $0.00315–$0.00320 and falls back below $0.00267, the recovery would lose some of its credibility. A break below the marked $0.002313 low would signal renewed weakness and invalidate the immediate base-building thesis. My decision is to wait for confirmation rather than chase the 7.43% move. The risk is that traders mistake a sharp bounce for a confirmed trend reversal. I would prefer to see resistance reclaimed and held before considering a long setup. A precise entry, stop-loss, and risk-to-reward calculation would require a more detailed view of the recent price structure. The key insight is that TRIA’s percentage gain is only the first part of the story. The more important development would be a change in the sequence of lower highs and lower lows that has defined its decline. Until the chart demonstrates that change, I see a potentially interesting recovery attempt—not yet a confirmed reversal. $TRIAUSDT #ByXIMPACT
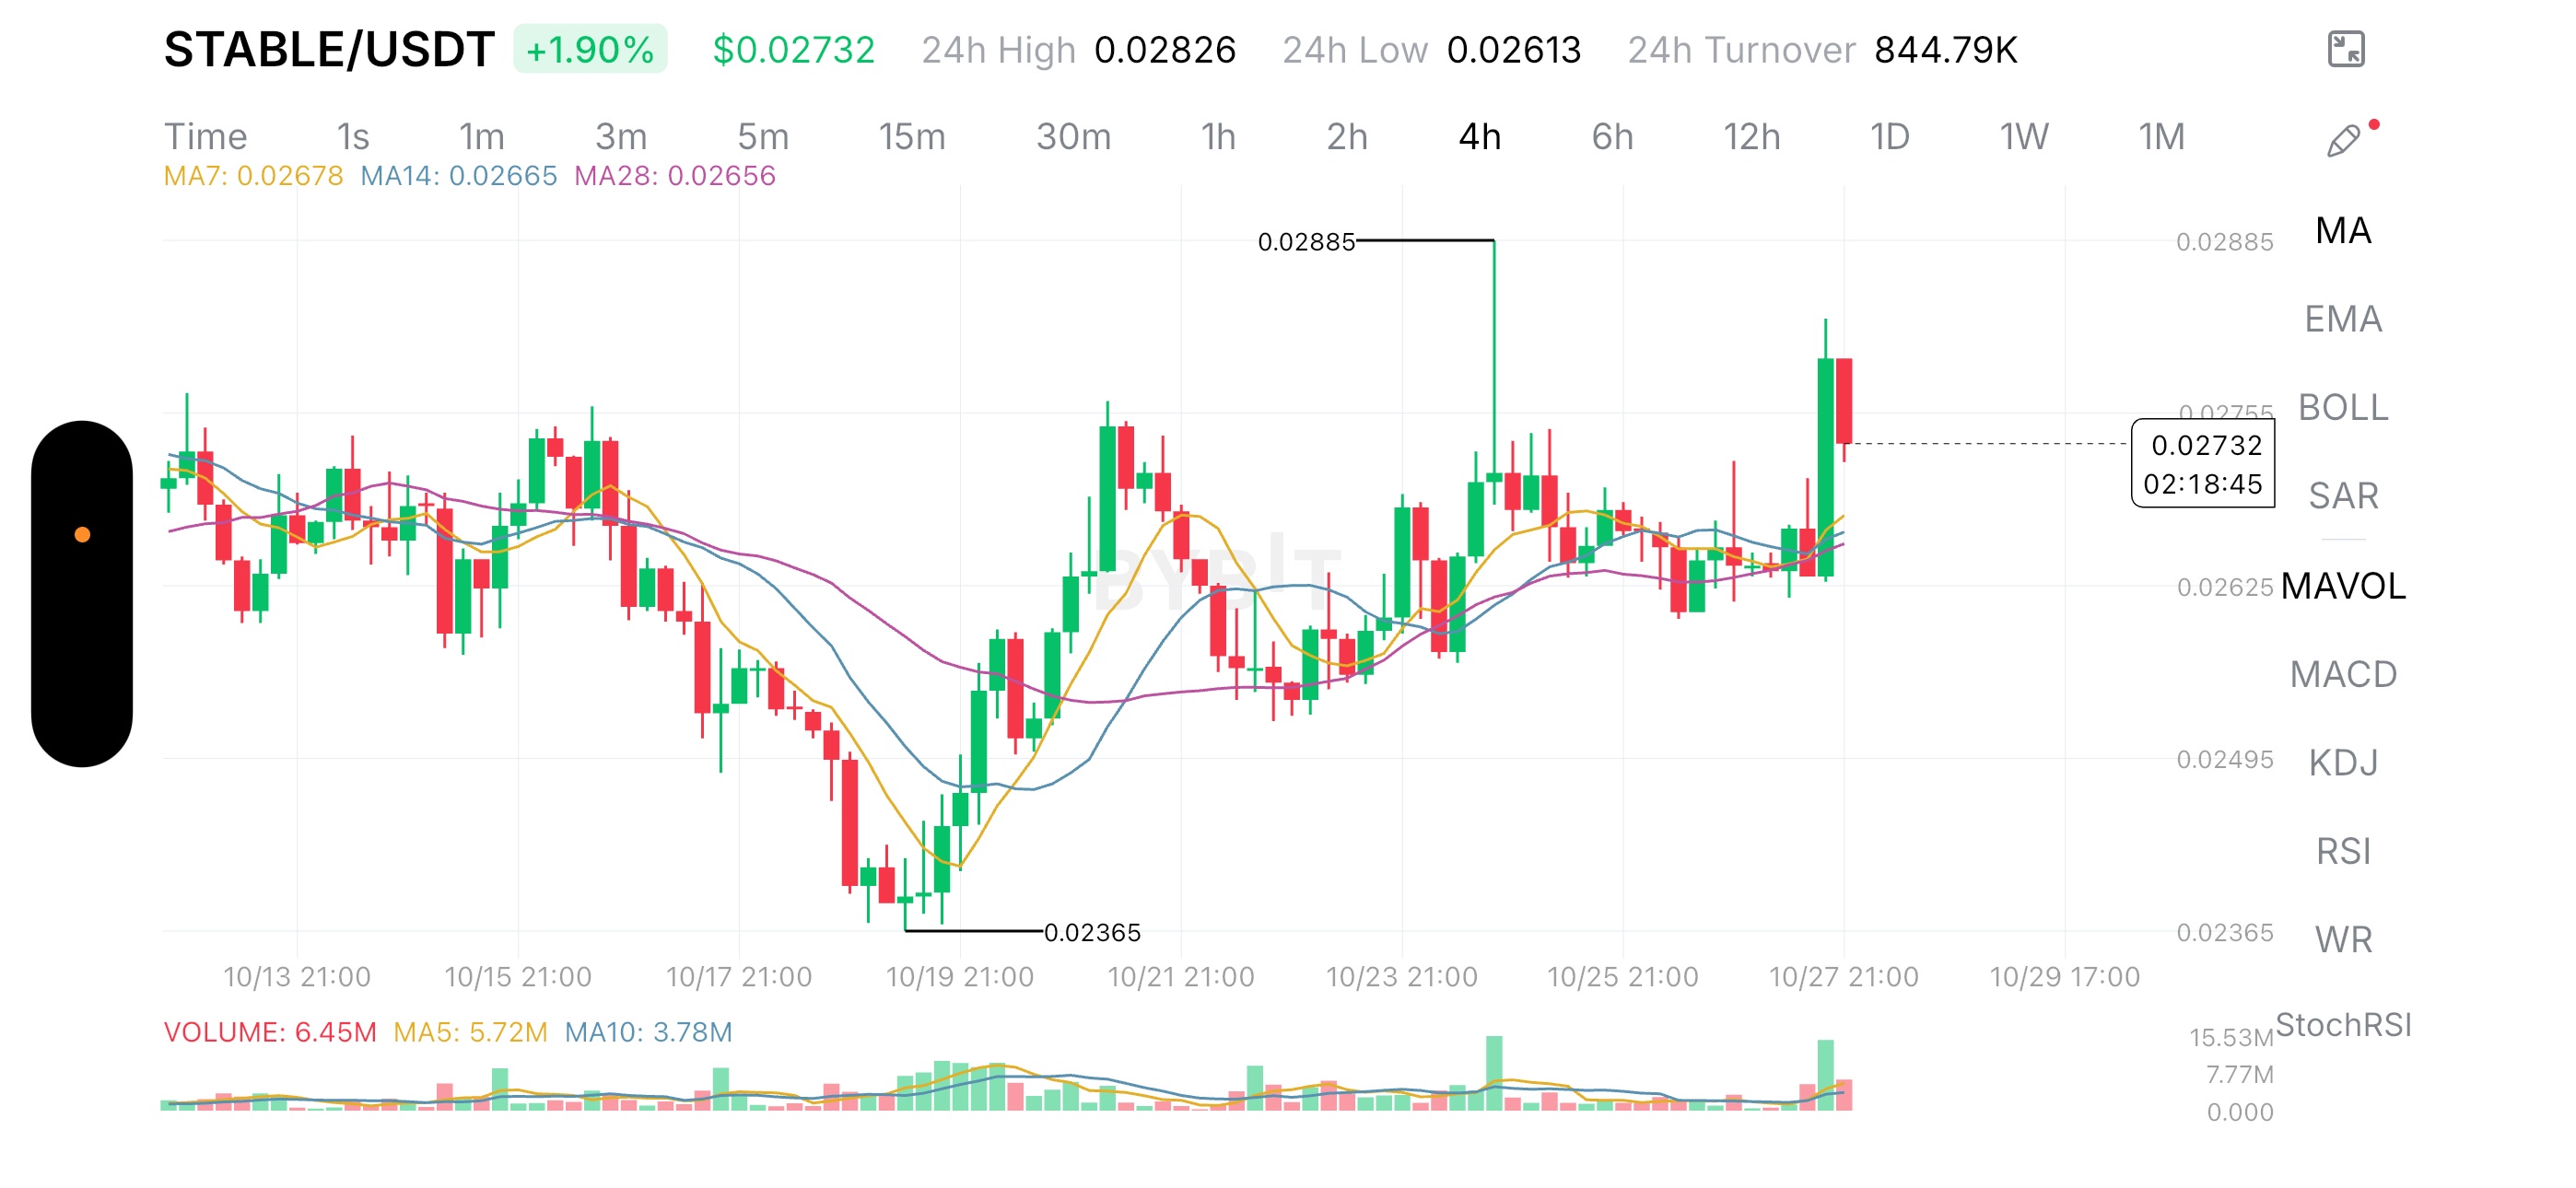
STABLE is trading at $0.02732, up 1.90%, on the provided 4-hour chart. The most important development is not the percentage gain itself. It is the combination of a sharp upward move, a noticeable volume expansion, and a price that has pushed above its recent consolidation range. My central question is whether this move represents the beginning of a sustained breakout or a short-lived liquidity event that attracts buyers before sellers regain control. The distinction matters because a breakout becomes meaningful when the market accepts higher prices, not simply when a candle moves sharply upward. The chart shows STABLE recovering from a marked low near $0.02365 on October 19. Since then, price has gradually rebuilt toward the $0.0260–$0.0270 region, with several attempts to move higher. Before the latest surge, candles were relatively compressed around the $0.0263–$0.0268 area. The latest move has disrupted that balance. There is evidence supporting the bullish interpretation. STABLE is trading above all three displayed moving averages: MA(7) at $0.02678, MA(14) at $0.02665, and MA(28) at $0.02656. This alignment suggests improving short-term momentum and a recovery in the average traded price. However, I would not treat the moving averages as independent confirmation of a larger trend reversal. They are calculated from past prices, so a sudden rally can pull them upward. The more important test is whether price can remain above the former consolidation zone after the initial excitement fades. Volume strengthens the case, but it also introduces uncertainty. The screenshot displays volume of 6.45M, compared with the MA(5) of 5.72M and MA(10) of 3.78M. That indicates elevated activity relative to the displayed averages. Yet the latest candle is red after the sharp upward move, suggesting some rejection of the higher price reached during the surge. The marked high near $0.02885 is especially important. It shows how far the market moved during the recent spike, but it should not automatically be treated as a realistic next target. The current price of $0.02732 is already below that level. The immediate question is whether buyers can absorb selling pressure without allowing the price to fall back into its previous range. I would separate three price areas. First, $0.0275–$0.0280: This is the immediate recovery zone to watch. Sustained trading above it would suggest that buyers are attempting to regain control after the latest rejection. Second, $0.0265–$0.0268: This is the important support area derived from the displayed moving averages and recent consolidation. A successful retest here would make the breakout structure more credible. Third, $0.02885: This is the visible spike high. A return toward it would require renewed buying pressure and acceptance above the intervening resistance zone. My bullish scenario requires STABLE to hold above the former range, build support, and then reclaim $0.0275–$0.0280. If that happens, the previous high becomes a potential test rather than an assumed destination. The bearish scenario develops if price falls below $0.0265 and cannot reclaim the area. That would raise the possibility that the surge was a temporary liquidity event rather than a durable breakout. A deeper move toward the $0.0260 region would then become worth monitoring, although the screenshot alone does not establish a confirmed downside target. There is also a fundamental limitation to this analysis: the chart does not establish what STABLE’s underlying token economics look like, whether the project has experienced a meaningful catalyst, or whether the volume increase reflects sustained spot demand. Without verified information on circulating supply, liquidity depth, token utility, and recent project developments, I cannot conclude that the price move reflects improving fundamentals. My decision is to wait for the retest rather than chase the spike. The chart has improved, and the volume expansion deserves attention, but the red candle following the surge makes confirmation important. A hold above the breakout region would strengthen the bullish case; a return into the old range would weaken it. The insight I would not overlook is that the next few candles may be more informative than the breakout candle itself. The surge shows that price can move higher. The retest will help reveal whether buyers are actually willing to defend those higher prices. $STABLEUSDT #IMPACTbyTrade #ByXIMPACT
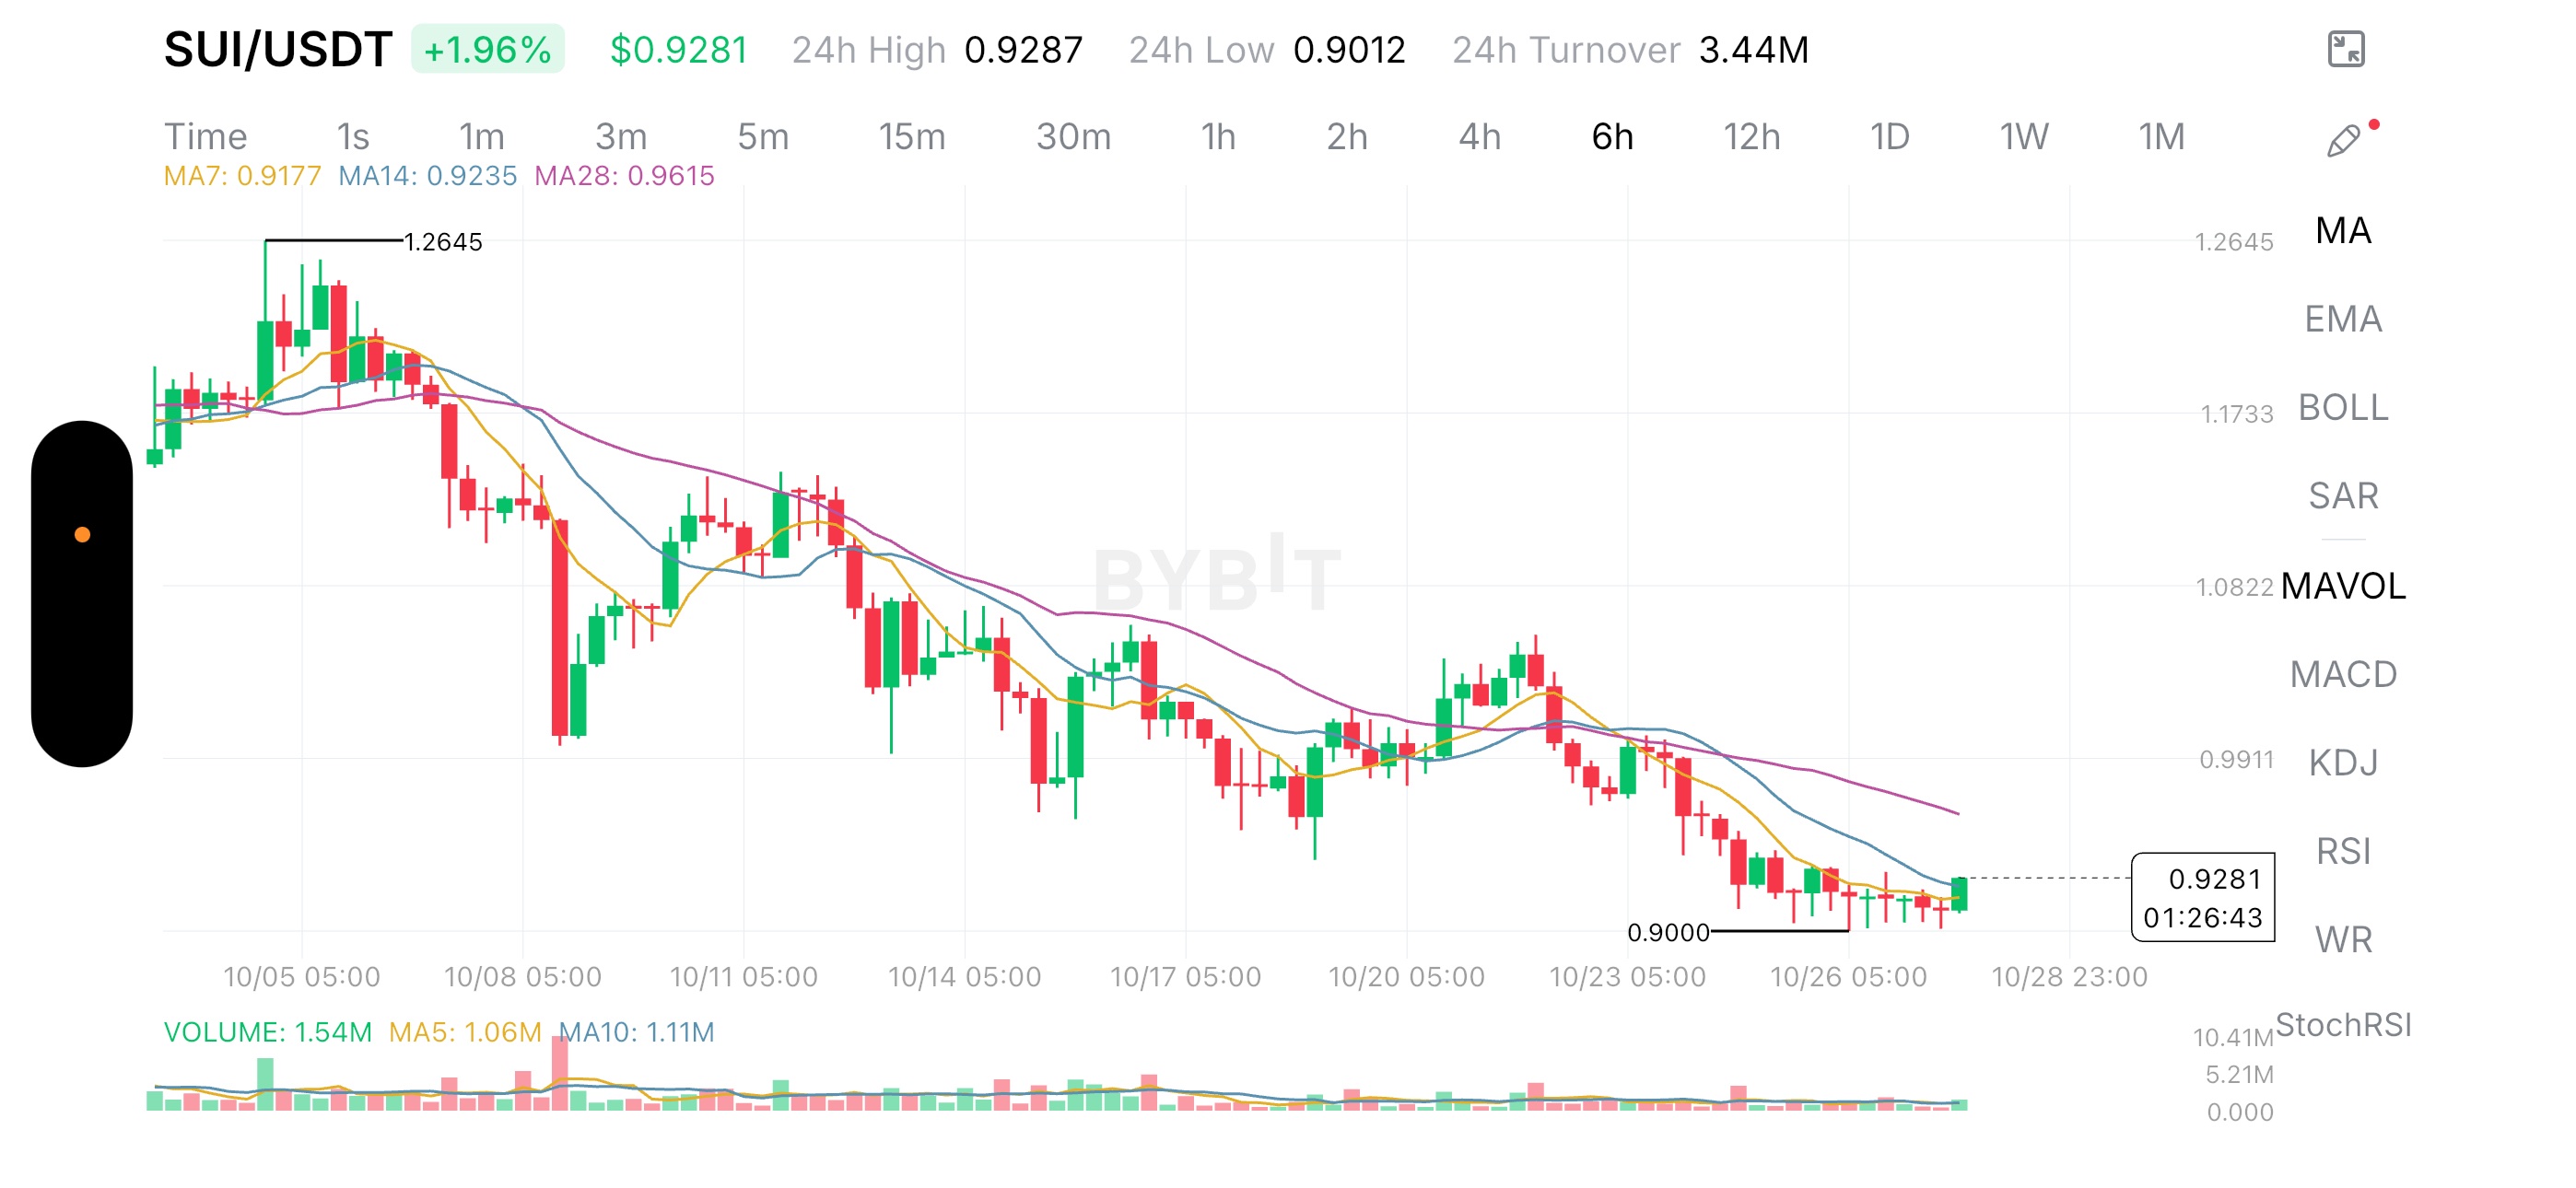
SUI is up 1.96% at $0.9281 on the provided 6-hour chart, but I would not interpret this move as a bullish reversal yet. The more interesting detail is that SUI has spent weeks declining from its marked high near $1.2645, and the latest bounce is emerging only after price approached the $0.90 area. That creates a specific market question: Are buyers accumulating SUI near a potential floor, or is this simply a relief bounce inside a larger downtrend? For me, the distinction matters more than the daily percentage gain. A token can rise 2% and still remain structurally weak if buyers cannot reclaim the levels where previous selling began. The moving averages make that problem visible. SUI is trading above its MA(7) at $0.9177 and MA(14) at $0.9235, but it remains below the MA(28) at $0.9615. The short-term recovery is encouraging, yet the longer average is still substantially higher than the current price. I read this as an early attempt at stabilization, not confirmation of a trend change. The first challenge is to hold above $0.92–$0.93. Beyond that, the region around $0.96 becomes important because it combines the longer moving average with a potential test of overhead selling pressure. There is a second clue in the price structure. After reaching approximately $1.2645 in early October, SUI produced a series of lower highs and lower lows. Several rebounds failed to restore the previous upward momentum, and price eventually returned to the $0.90 region. That repeated weakness tells me sellers have controlled the broader structure. However, the recent candles around $0.90 show that the decline has at least encountered an area where selling pressure may be slowing. The marked $0.9000 level is therefore the immediate line to watch, although one chart cannot establish how much genuine buying interest sits there. Volume offers a potentially useful signal. The screenshot shows current volume of 1.54M, compared with the displayed MA(5) of 1.06M and MA(10) of 1.11M. That is evidence of stronger activity in the latest candle relative to those averages. It does not tell us whether the activity came from sustained spot buying, short covering, or other trading flows. I would want to see whether buying activity continues as price approaches resistance. This is where I would separate the trading setup from the investment thesis. SUI’s technical weakness does not, by itself, prove that its ecosystem is deteriorating or that the token is fundamentally overvalued. Equally, a short-term rebound does not prove that network adoption or token demand is improving. The screenshot provides no current TVL, network-fee, token-unlock, or derivatives data, so I would not use it to make a fundamental valuation claim. For the trade, I see two conditional scenarios. Bullish scenario: If SUI holds above $0.90 and reclaims the $0.96 area on the 6-hour timeframe, with follow-through buying, the recovery would become more credible. The next visible chart region to assess is around $0.99, followed by approximately $1.08. These are reference zones from the displayed price scale, not guaranteed targets. Bearish scenario: If SUI loses $0.90 decisively and fails to reclaim it, the potential base would be breaking down. I would then look for additional historical price data before defining the next downside target. The chart alone does not justify inventing a precise entry, stop-loss, or risk-to-reward ratio. My decision: Wait for confirmation rather than chase the green candle. The bullish case needs a successful resistance reclaim; the bearish case gains strength if the $0.90 floor fails. Until one of those conditions develops, SUI remains a recovery attempt within a broader downtrend. The overlooked point is that the market does not need SUI to rally dramatically to change the immediate setup. It needs buyers to demonstrate that they can defend support and absorb selling at higher prices. If that happens, the current bounce could become the beginning of a more meaningful recovery. If it does not, the 1.96% gain may prove to be only a temporary pause in the decline. $SUIUSDT #IMPACTbyTrade #ByXIMPACT
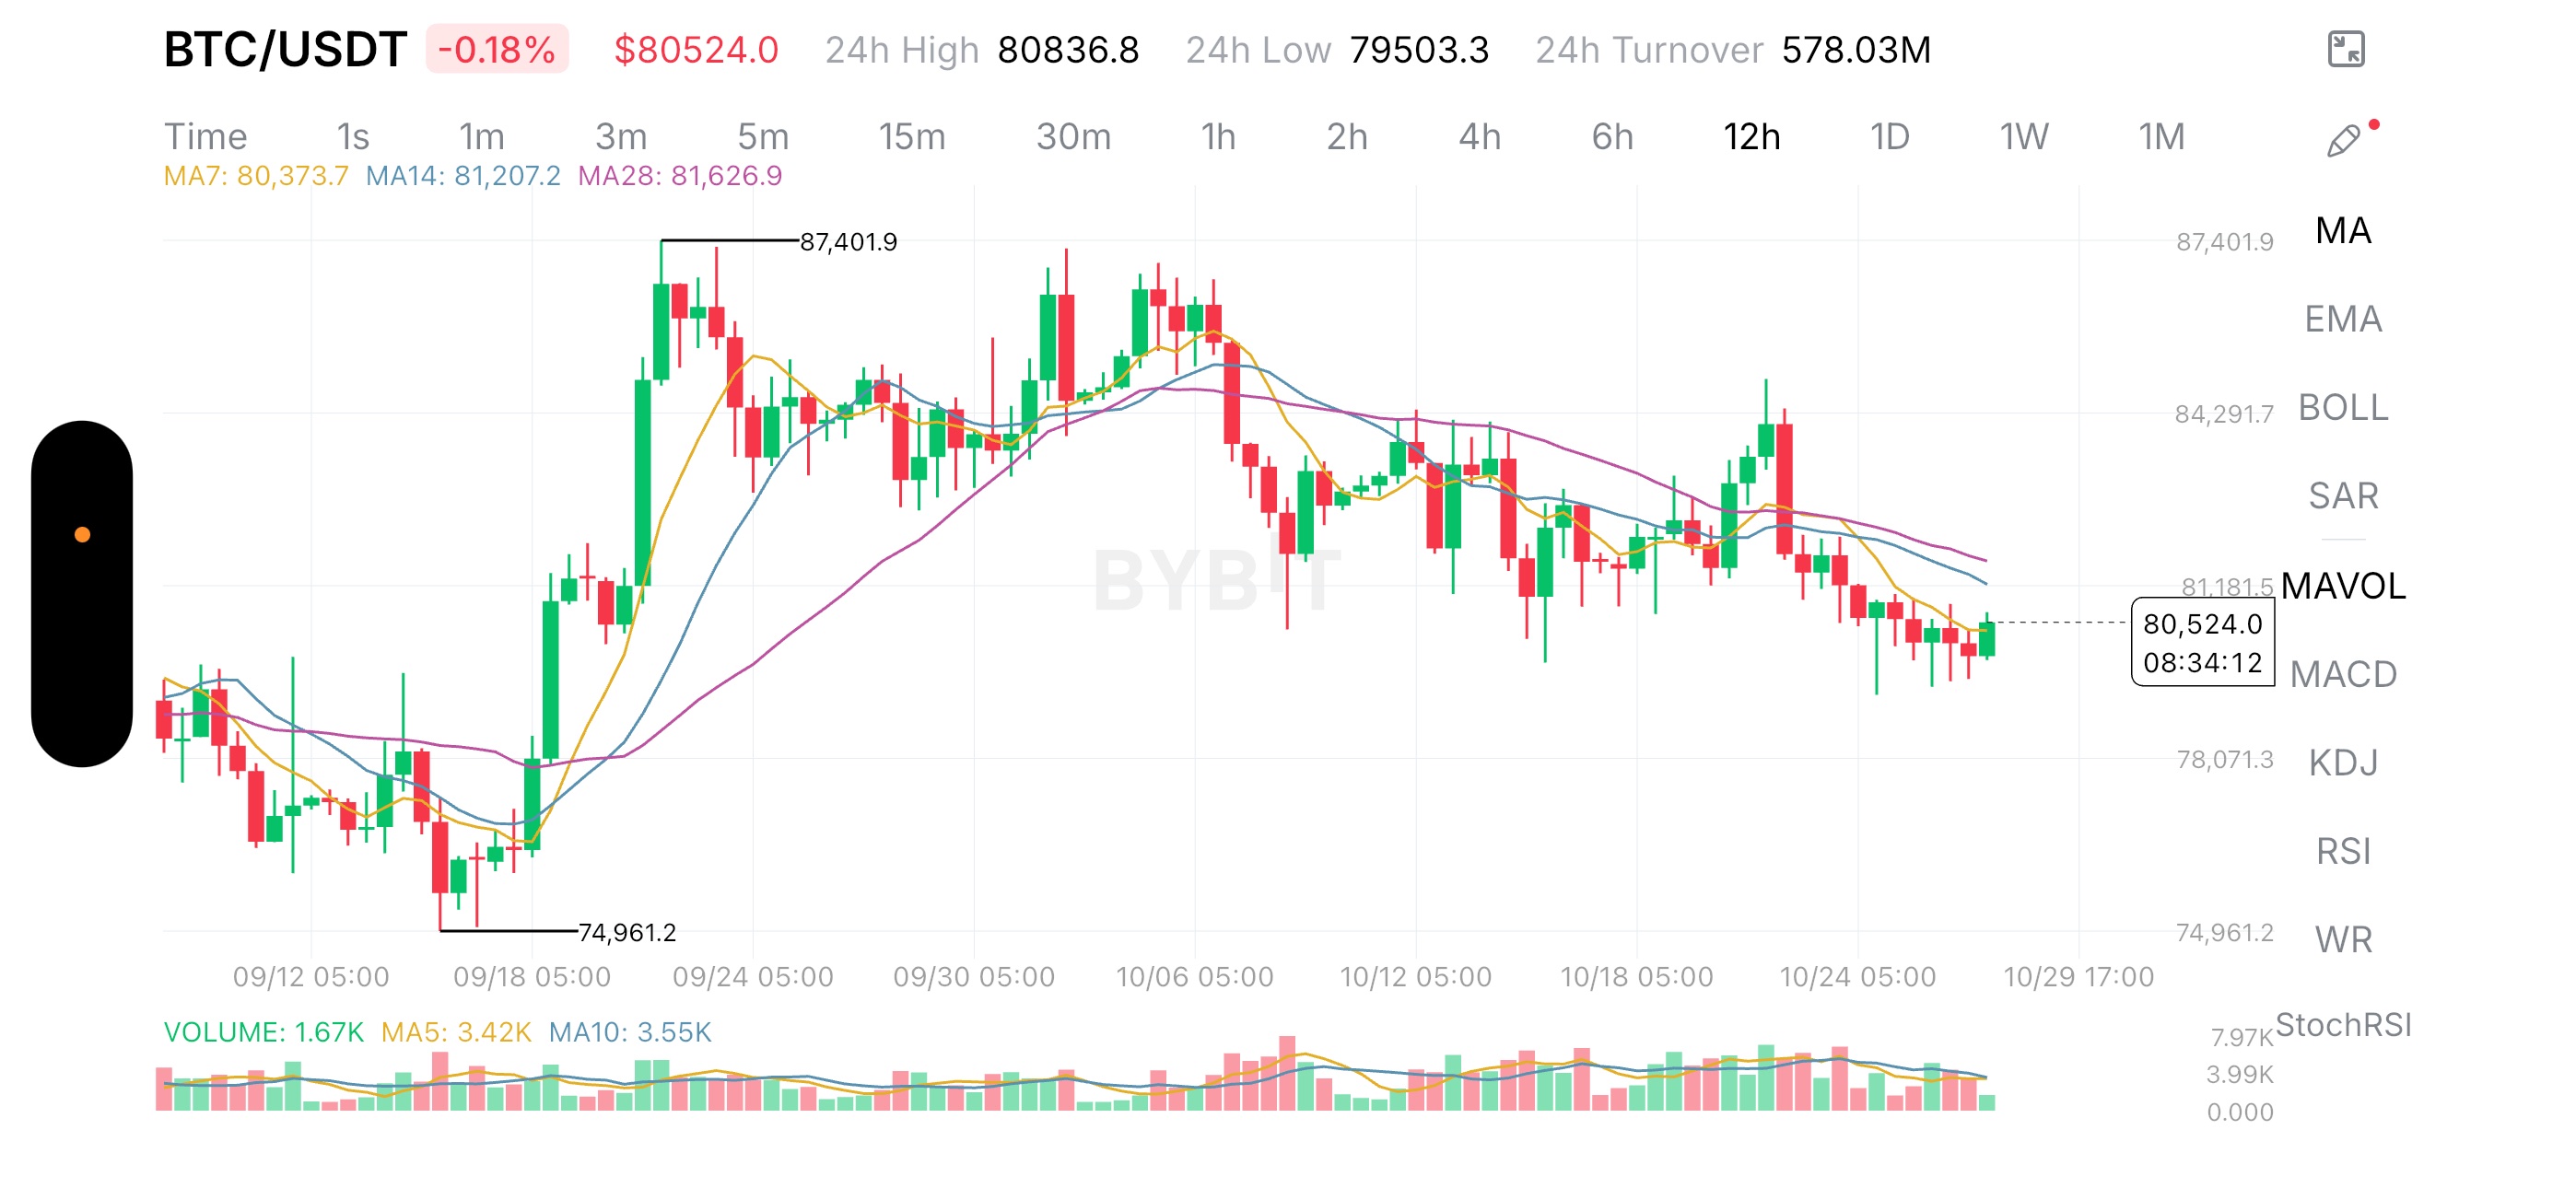
Bitcoin’s Bounce Is Facing a Test: Can Buyers Reclaim $81,200, or Is This Just a Pause Before Another Leg Down? Bitcoin is trading near $80,524 on the provided 12-hour chart, down 0.18%. At first glance, the latest green candle might look like an early recovery signal. I would be careful with that interpretation. BTC has already attempted to recover from lower levels several times, yet each rally has struggled to establish a sustainable move back toward its previous highs. The question I find more important is this: Is Bitcoin building a base around $80,000, or are buyers simply slowing the decline without reversing it? The chart currently favors caution, but the next move depends on whether buyers can reclaim lost resistance rather than merely defend the current price. The first clue comes from the moving averages. BTC is trading below the MA(7) at $80,373.7? Not quite—the current price of $80,524 is slightly above that short-term average. However, it remains below the MA(14) at $81,207.2 and MA(28) at $81,626.9. That distinction matters: short-term momentum may be stabilizing, but the broader structure on this timeframe has not yet turned bullish. I see the $81,200–$81,650 region as the first meaningful recovery test. It combines the medium- and longer-period moving averages, creating an area where sellers may attempt to defend the prevailing downtrend. A move into this zone would not automatically confirm a reversal. I would want to see BTC close above it on the 12-hour timeframe and hold the area during a subsequent retest. There is another detail worth watching. Bitcoin previously reached approximately $87,402 before losing momentum. Since then, the chart shows lower recovery attempts, including a rejection near the $84,000 region. The market has moved from an aggressive rally into a sequence of weaker rebounds and lower trading levels. That change tells me something about demand. Buyers were previously willing to push price substantially higher, but recent attempts have not produced the same follow-through. It does not prove that institutional demand has disappeared or that large holders are selling; the chart alone cannot establish either claim. It does, however, show that bullish momentum has weakened. Volume adds another layer. The latest displayed volume is 1.67K, below the shown MA(5) of 3.42K and MA(10) of 3.55K. If the current candle is still forming, that comparison is incomplete. Even so, the screenshot does not provide strong volume confirmation for the latest bounce. I would rather see expanding buying volume during a resistance reclaim than assume that a small green candle signals renewed accumulation. The counterargument is that BTC may be stabilizing after its decline. The price is hovering around $80,000, and the latest candle suggests some buying interest. If the market holds above the recent local lows and begins reclaiming resistance, the current consolidation could develop into a recovery. That possibility is why I would not automatically chase a short at the current level. For the trading plan, I would focus on two scenarios. Bullish scenario: A confirmed 12-hour reclaim of $81,200–$81,650, followed by a successful retest, would improve the setup. The next visible resistance area is around $84,000–$84,300. I would reassess momentum there rather than assume BTC will immediately revisit $87,402. Bearish scenario: If BTC fails to reclaim the moving-average cluster and breaks below the recent local support around $79,500, sellers could regain control. A sustained breakdown would strengthen the bearish case, although the next downside target needs more detailed price history before assigning a defensible level. My decision is to wait for confirmation. The fundamental thesis and the short-term trade are different questions: this chart cannot tell us whether Bitcoin is undervalued, and it does not provide current derivatives positioning, spot-flow data, or broader valuation evidence. Technically, however, buyers still have work to do. The signal I am watching is not whether BTC can print another green candle. It is whether the market can reclaim $81,200–$81,650 and turn that resistance into support. Until that happens, I see the bounce as an unconfirmed attempt at stabilization rather than evidence that the downtrend has ended. $BTCUSDT #IMPACTbyTrade #ByXIMPACT
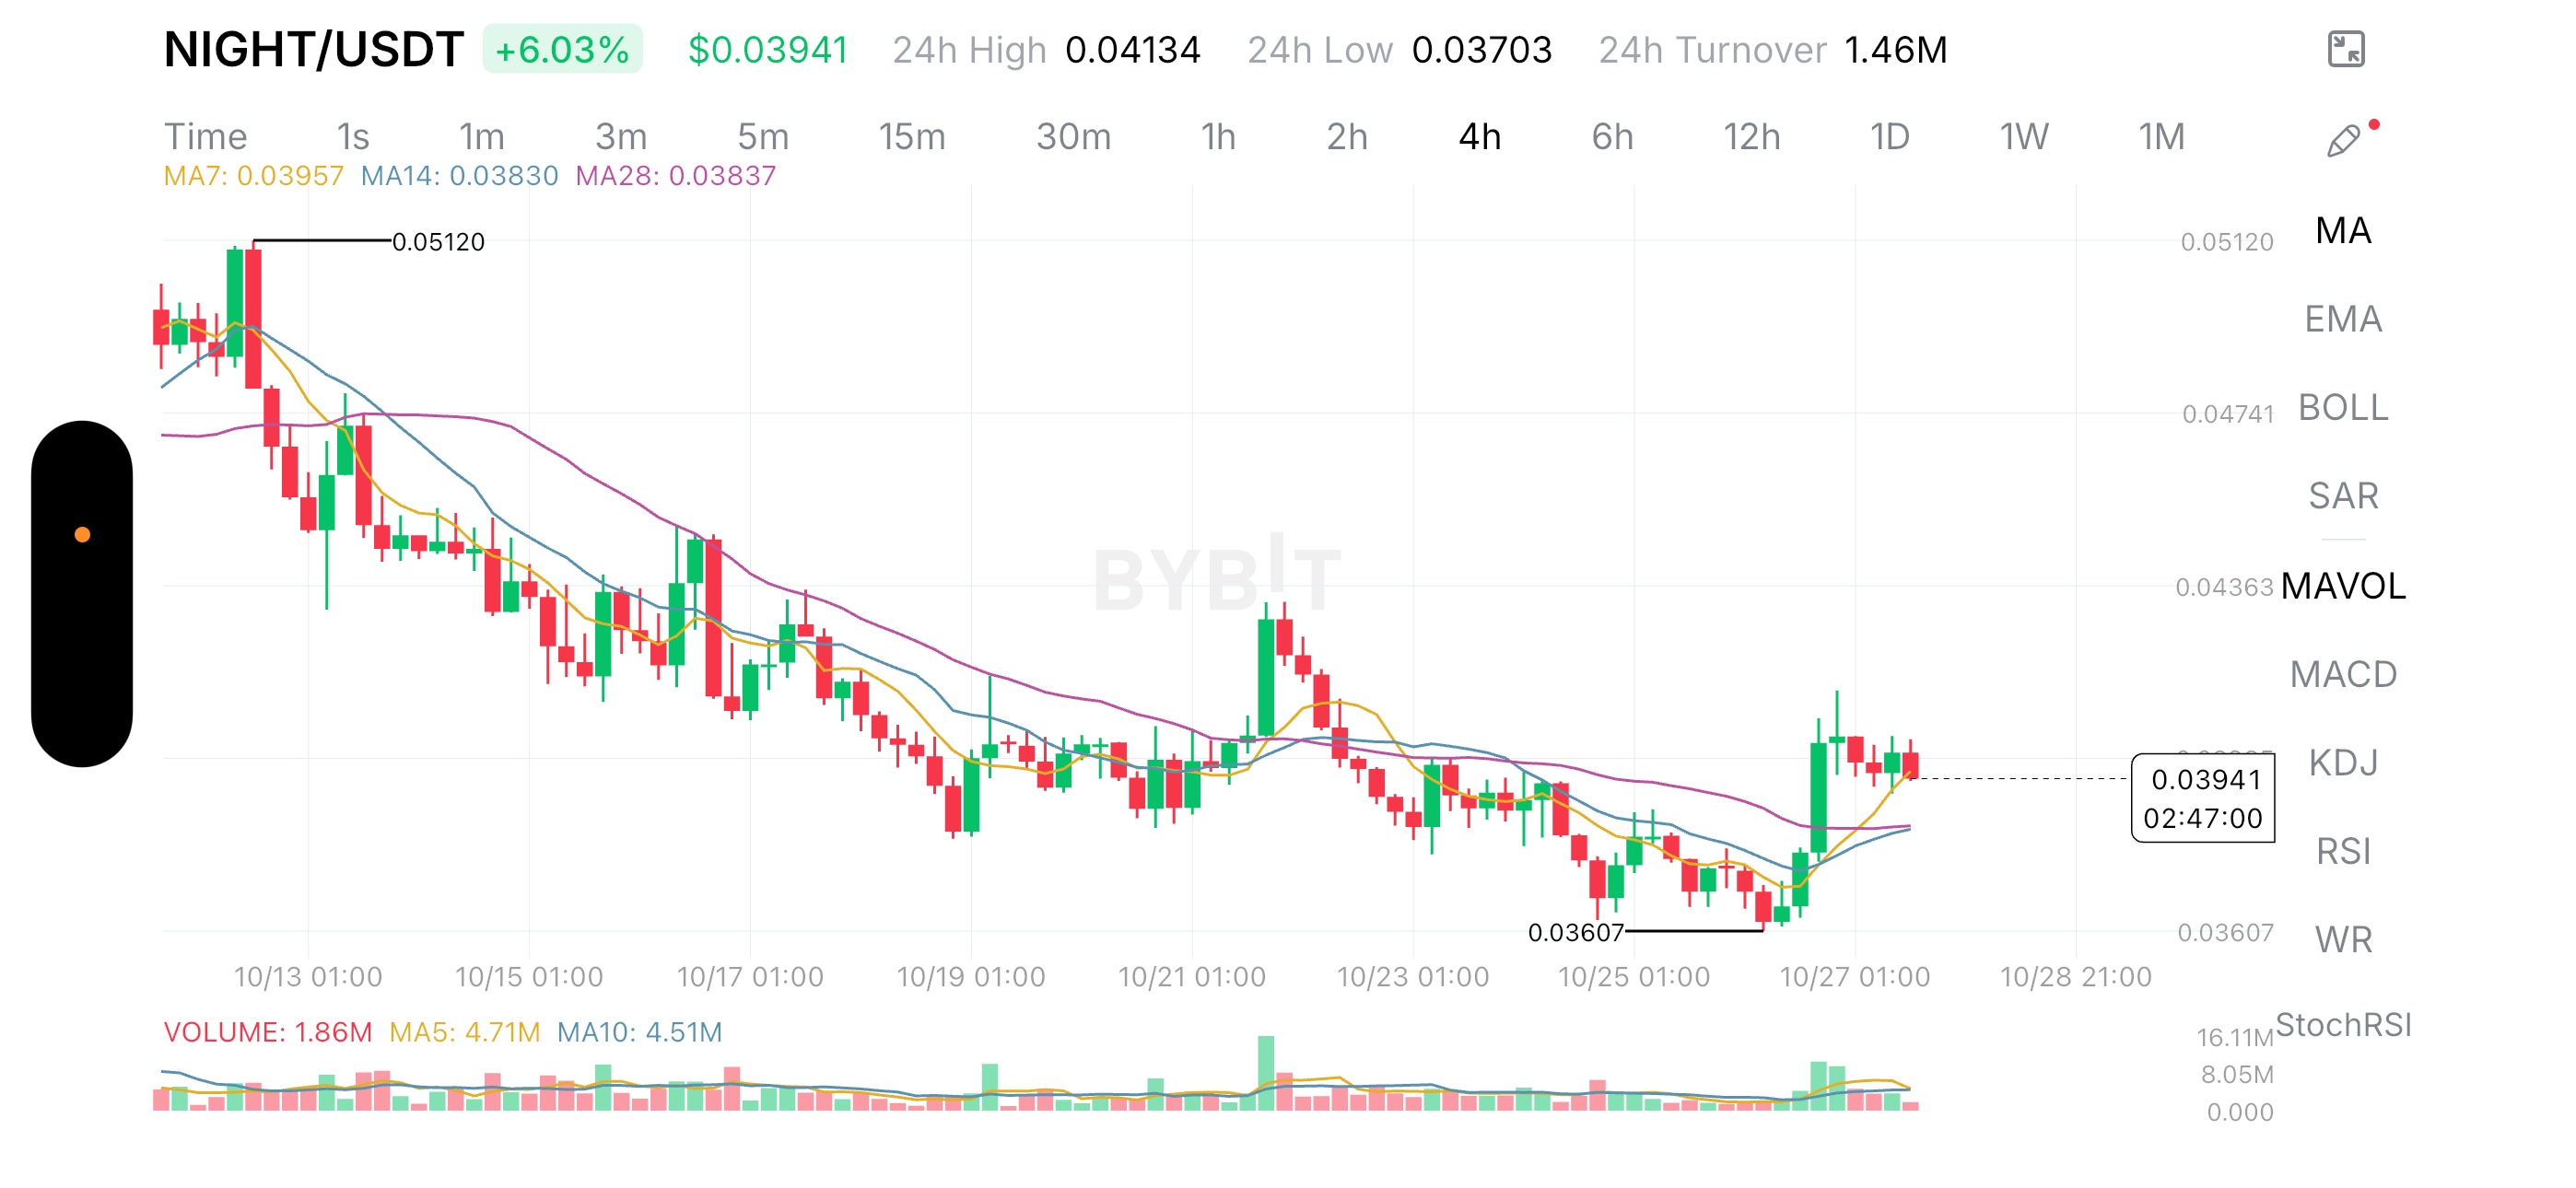
NIGHT is up 6.03% at $0.03941 on the provided 4-hour chart. At first glance, that looks like a bullish recovery. But I think the more important question is whether this bounce has changed the market structure or simply interrupted a persistent downtrend. The distinction matters because small-cap tokens can produce sharp rallies without attracting enough sustained demand to reverse their broader trend. NIGHT has fallen from a visible chart high near $0.05120 to a recent low around $0.03607. That represents a decline of approximately 29.6%. The latest rebound is meaningful, but it has not yet recovered most of that lost ground. My central thesis: NIGHT is showing early signs of short-term stabilization, but traders need confirmation that the rebound can turn into sustained demand before treating it as a trend reversal. The moving averages reveal the real test The screenshot shows three moving averages: MA(7): $0.03957 MA(14): $0.03830 MA(28): $0.03837 With NIGHT trading at $0.03941, the price is slightly below the seven-period average but above the 14- and 28-period averages. This is a more constructive picture than the prolonged decline visible earlier in the chart. The short-term averages have also begun to turn upward following the latest rebound. However, I would separate a bullish short-term signal from a confirmed structural reversal. NIGHT previously produced a sharp rally around October 21 before losing momentum and moving lower again. That earlier move is a reminder that a sudden price expansion does not necessarily create a sustainable trend. For me, the immediate test is whether buyers can reclaim approximately $0.0396 and maintain price above the $0.0383–$0.0384 moving-average area during a pullback. If that happens, the recovery gains credibility. If price falls back below these averages and fails to reclaim them, the latest bounce could lose momentum quickly. Volume is important, but it does not tell the whole story The displayed 24-hour turnover is approximately $1.46 million, while the latest four-hour volume reads 1.86 million against the displayed five-period and ten-period volume averages of 4.71 million and 4.51 million. The latest candle may still be forming, so its volume should not be compared directly with completed candles. The chart nevertheless shows increased activity around the recent upward move. That is useful evidence, but it does not establish whether the move is being driven by sustained spot accumulation, short covering, or speculative positioning. Open interest, funding rates, order-book liquidity, and completed-candle volume would help distinguish those possibilities. This is the market’s potential blind spot: a price rebound can look convincing before the underlying demand has proved durable. The levels that matter next The recent low near $0.03607 is the clearest downside reference on this chart. It marks the area where selling pressure was recently interrupted. On the upside, I would monitor the following zones: $0.0396: The immediate short-term momentum test near MA(7). $0.0400–$0.0413: The next recovery area, with $0.04134 marking the displayed 24-hour high. $0.0436: A broader resistance reference from the earlier price structure. These are observation zones, not guaranteed turning points. A move above $0.04134 that holds on a retest would provide stronger evidence of continuing demand. A rejection followed by a loss of the moving-average cluster would weaken the bullish case. My trading decision: Wait for confirmation Bullish scenario: NIGHT reclaims $0.0396, holds the moving-average region on a retest, and breaks above $0.04134 with sustained buying. That would improve the case for a move toward the $0.0436 area. Bearish scenario: NIGHT fails to hold $0.0383–$0.0384 and loses $0.03607. That would suggest the rebound failed to establish a durable floor, although further downside targets would require additional chart history. I would not assign a precise entry, stop-loss, or risk-to-reward ratio yet. The screenshot does not provide enough confirmation to justify those numbers, and the token’s liquidity and derivatives positioning remain unverified. My conclusion is cautiously constructive in the short term, but not yet bullish on the broader structure. NIGHT has demonstrated that buyers can respond after a sustained decline. The next question is whether they can defend the recovery when the initial excitement fades. That is the difference between a temporary bounce and a meaningful change in market direction. $NIGHTUSDT #IMPACTbyTrade #ByXIMPACT
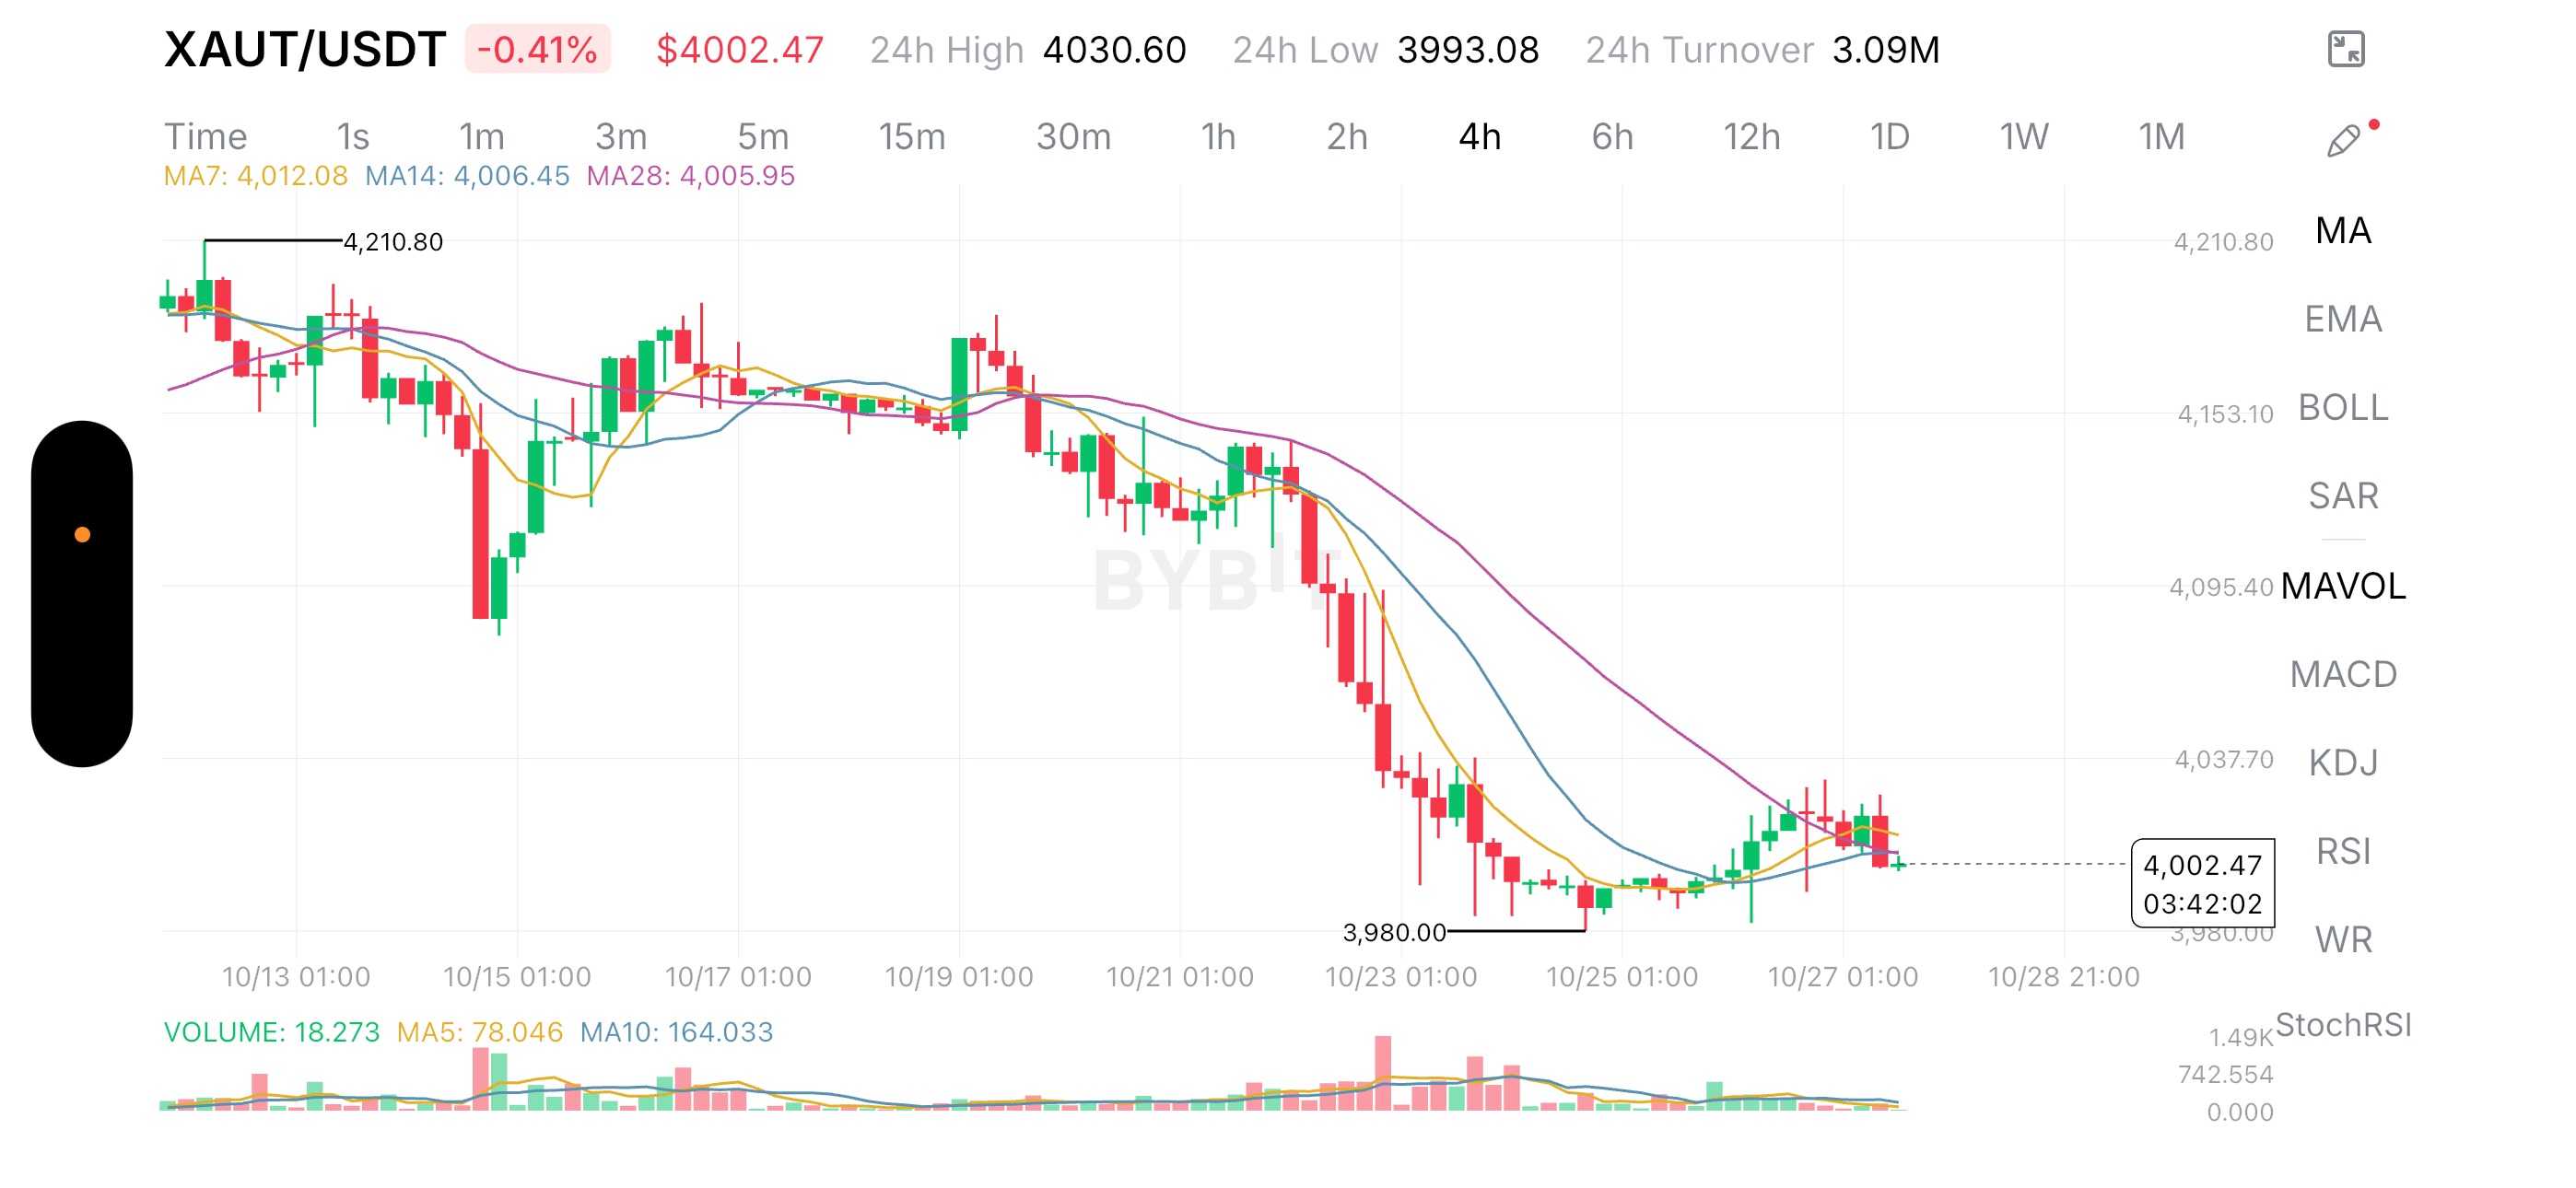
The interesting signal in XAUT is not simply that tokenized gold has fallen to $4,002.47. It is that the market has attempted to stabilize after a sharp sell-off, yet the recovery is already struggling beneath its moving averages. On the 4-hour chart, XAUT declined from a visible high near $4,210.80 to a low around $3,980.00. Buyers subsequently pushed the price higher, but the rebound has not established a convincing bullish reversal. My central question is whether this is genuine demand returning to tokenized gold or merely a temporary pause after aggressive selling. That distinction matters because XAUT represents exposure to gold, while its short-term trading price is also affected by crypto-market liquidity, order flow and the relationship between the token and the underlying metal. The recovery is facing a technical credibility test The displayed moving averages are clustered above the current price: * MA(7): $4,012.08 * MA(14): $4,006.45 * MA(28): $4,005.95 XAUT is trading below all three, although the gap is relatively small. The short-term average has also moved above the other two, suggesting a recent rebound in shorter-term momentum, but that alone does not establish a trend reversal. What I find more important is the broader structure. The chart shows a sequence of lower prices followed by a sharp decline around October 22–24. The recovery from approximately $3,980 has been modest compared with the preceding sell-off. This creates a specific problem for bullish traders: buyers have demonstrated that they can defend the lows, but they have not yet demonstrated that they can sustain a recovery. The first test is whether XAUT can reclaim the $4,006–$4,012 moving-average area and hold above it. A sustained move higher would improve the short-term picture, while repeated rejection would suggest that sellers still control the recovery attempts. The overlooked issue: token price and gold value are not identical I would separate two different questions. First, what is happening to gold itself? Second, how is XAUT trading relative to the value of the gold it represents? Those questions can produce different answers. If the underlying gold market remains resilient while XAUT weakens, the difference could reflect temporary crypto-market selling, liquidity conditions or a deviation from its underlying value. If gold itself is declining, however, the token’s weakness may simply reflect a broader repricing of the asset. The screenshot does not provide the spot-gold benchmark, XAUT’s premium or discount to its underlying value, or current redemption-market conditions. Therefore, I cannot conclude that the decline represents a mispricing or a buying opportunity. This is the key distinction that a candlestick-only analysis can miss: a technical discount is not necessarily a fundamental discount. Before treating the pullback as an opportunity, I would want to compare XAUT’s market price with the corresponding gold value. The levels that matter next The visible low near $3,980 is the immediate structural reference. If price breaks below that area and fails to recover it, the recent stabilization would be undermined, opening the possibility of further downside. The screenshot does not provide enough historical detail to justify a precise lower target. On the upside, the $4,030–$4,037 area is a reasonable near-term zone to watch because it aligns with the recent rebound highs and a visible price-axis region. A sustained break above it would offer stronger evidence of recovering demand than a simple moving-average crossover. Beyond that, the chart’s earlier breakdown area near $4,095 becomes a more distant reference. Reaching it would require a substantial improvement in momentum. My trading decision: wait for confirmation Bullish scenario: XAUT reclaims $4,012, holds that area on a retest, and breaks above the recent rebound zone around $4,030–$4,037. That would improve the case for a recovery, provided the underlying gold market supports the move. Bearish scenario: Price loses $3,980 and fails to reclaim it. That would weaken the stabilization thesis and make further downside more plausible. I would avoid assigning exact entries, stops and risk-to-reward ratios without a clearer execution timeframe and additional price data. The fundamental question also remains unresolved until XAUT is compared with the underlying gold benchmark. My conclusion is that XAUT is approaching a decision point, not presenting a confirmed reversal. The next move matters, but the relationship between token price and underlying gold value matters even more. If both recover together, the bullish case becomes more credible. If XAUT rebounds while its underlying benchmark weakens, or trades at an unexplained premium, the move deserves greater caution. $XAUTUSDT #IMPACTbyTrade #ByXIMPACT
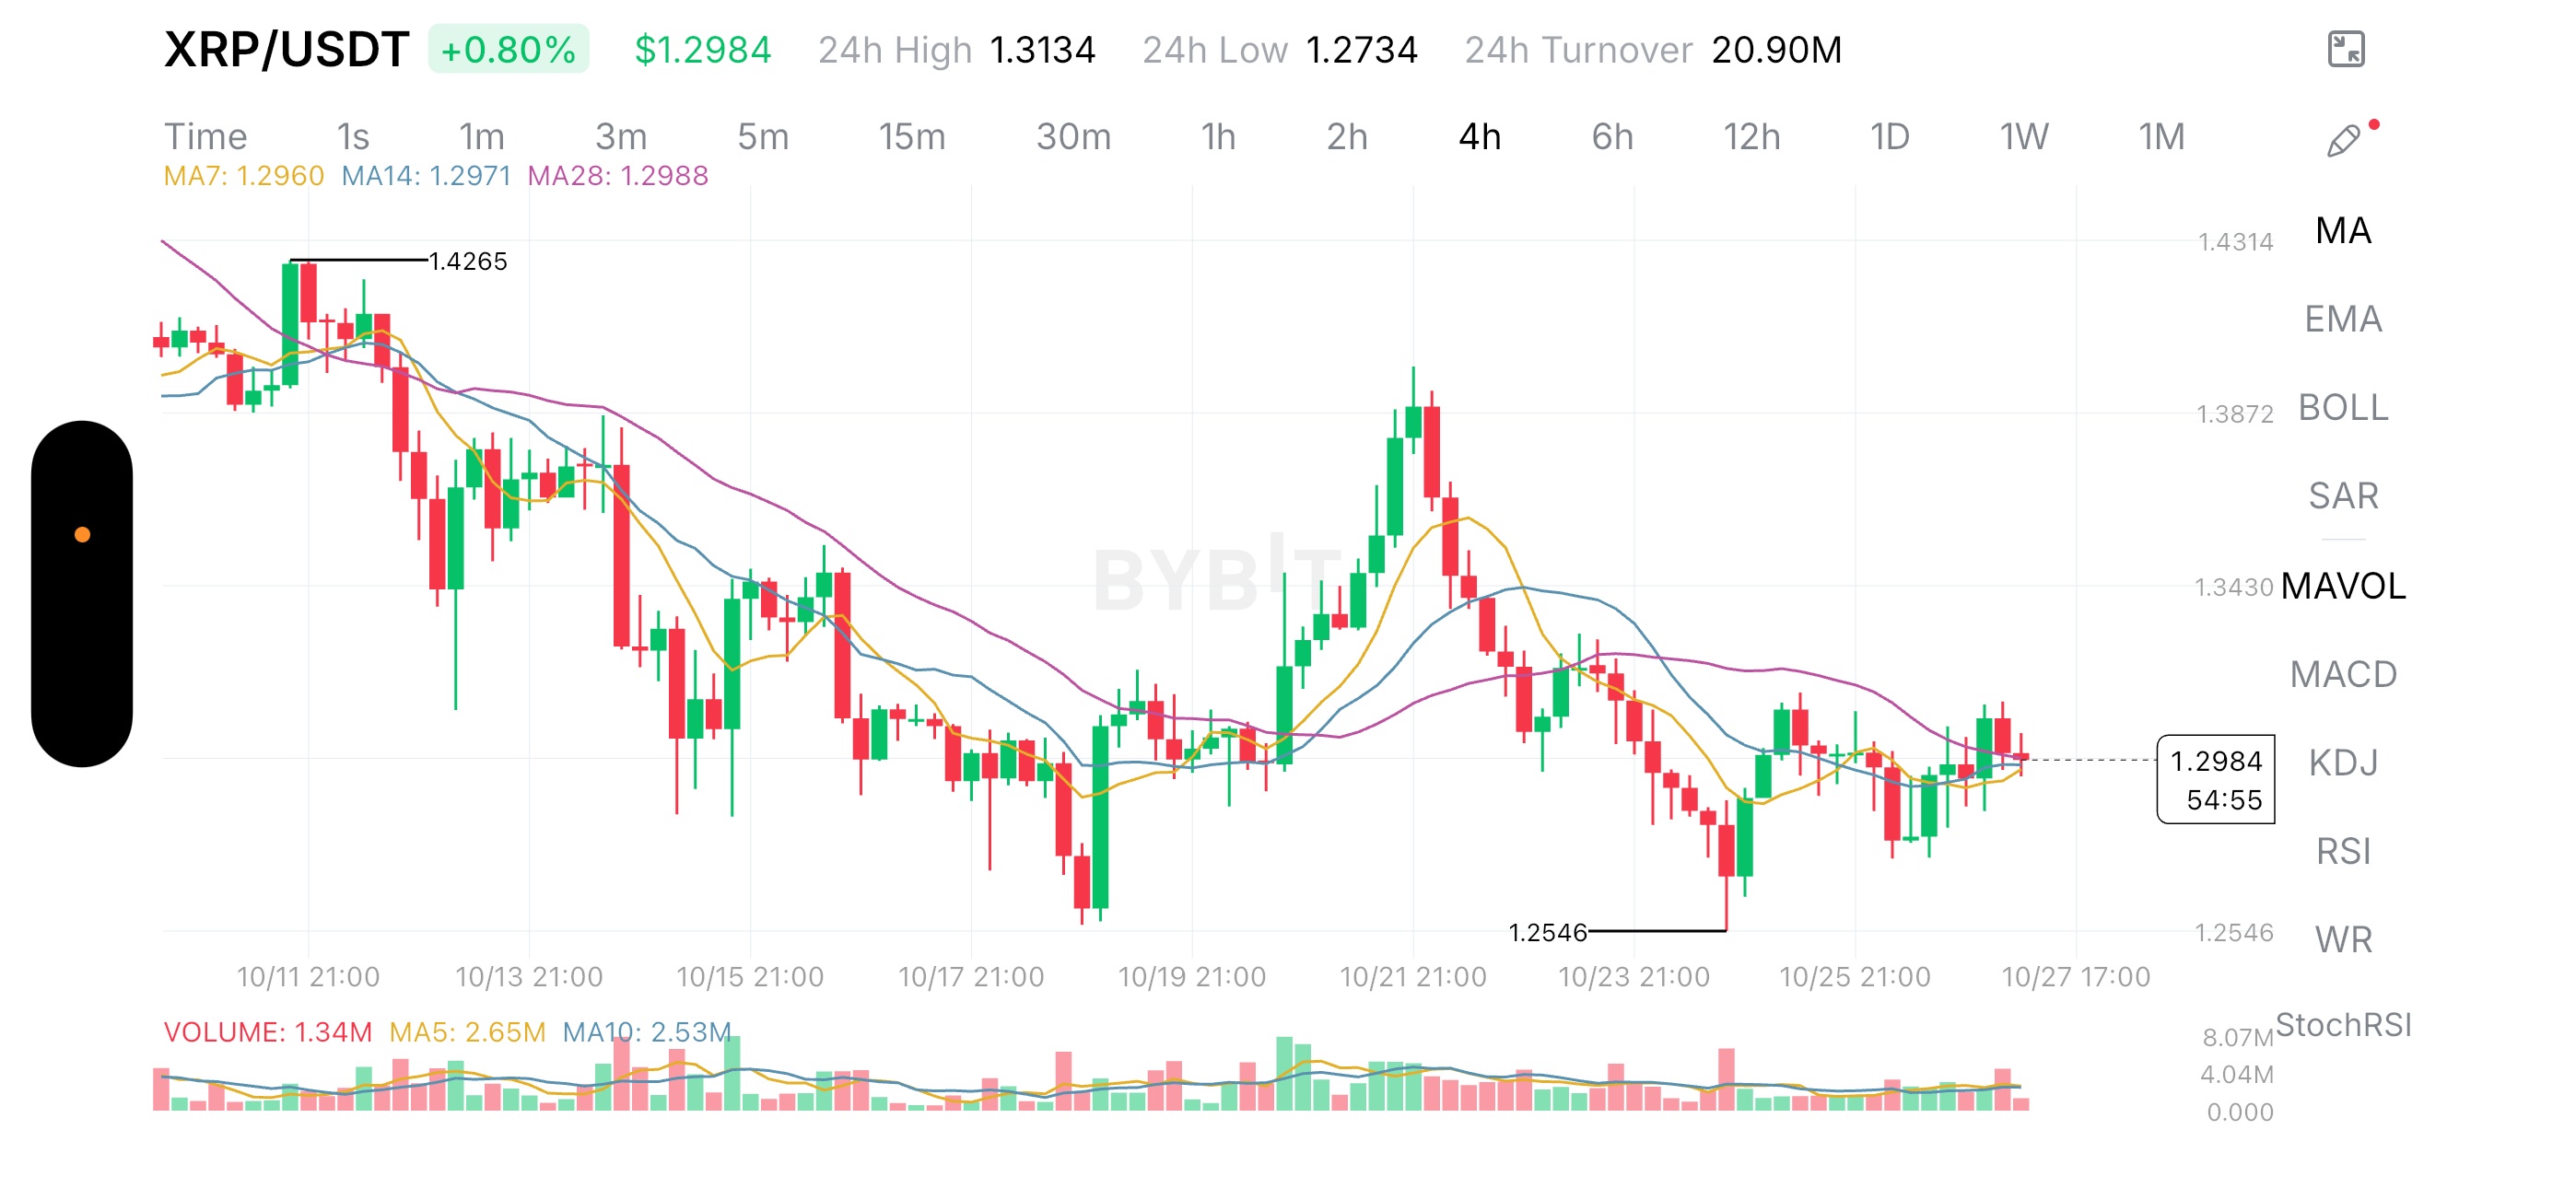
XRP is trading near $1.2984 on the 4-hour chart, up 0.80%, but I think the more important story is what has happened after the sharp recovery from $1.2546. The rebound has stabilized price, yet it has not produced a convincing breakout from the consolidation that followed the previous sell-off. The market is approaching a decision point: is XRP building a base for recovery, or is it simply pausing before another move lower? What makes this setup interesting is the difference between price stabilization and genuine buying strength. XRP previously climbed toward $1.4265 before sellers took control. The decline continued through several lower price swings, and a later recovery toward $1.39 also failed to hold. That second rejection matters because it shows that buyers were unable to preserve the recovery even after a substantial upward move. Since then, price has found support around $1.2546 and returned to the $1.29–$1.30 region. I would interpret this as an attempt to establish a short-term base, not confirmation that the broader downtrend has ended. The moving averages reinforce that cautious view. The displayed MA(7) is $1.2960, MA(14) is $1.2971, and MA(28) is $1.2988. XRP is trading just above the first two averages but slightly below the third. These lines are tightly clustered around the current price, suggesting that short-term momentum has become compressed. That compression can precede a stronger move in either direction. It does not tell us which direction will win. The volume reading adds another important qualification. The latest displayed volume is 1.34M, below the MA(5) volume of 2.65M and MA(10) volume of 2.53M. Because the current four-hour candle may still be forming, this comparison is provisional. Nevertheless, the screenshot does not yet show a decisive expansion in participation accompanying the recovery. For me, the key distinction is whether XRP can attract stronger demand as it approaches resistance. A price increase without meaningful follow-through can leave a recovery vulnerable to another rejection. The immediate area around $1.30 is the first test, followed by the visible region near $1.3134, the displayed 24-hour high. A sustained move above that high, supported by stronger volume and a successful retest, would provide better evidence that buyers are regaining control. Beyond that, the previous trading area around $1.33–$1.34 becomes relevant. The downside picture is equally important. If XRP loses the recent consolidation and selling pushes it back toward $1.2734, the displayed 24-hour low becomes an immediate reference. A deeper move toward $1.2546 would put the recent recovery under serious pressure. I would not assume that a test of either level is inevitable. These are conditional reference points drawn from the supplied chart, not predictions. There is also a fundamental limitation to this analysis. The screenshot cannot establish whether XRP’s stabilization is being supported by broader spot-market demand, derivatives positioning, or a change in investor expectations. Nor does it provide evidence of a new fundamental catalyst. A technical recovery and an improvement in token demand are separate claims, and the available evidence supports only a cautious technical interpretation. My trading decision is to wait for confirmation rather than chase the current price. A bullish setup would become more credible if XRP breaks above $1.3134 with stronger participation and holds that level on a retest. A bearish setup would strengthen if the market loses its recent support structure and fails to reclaim it. Until either condition develops, a precise entry, stop-loss, and risk-to-reward estimate would be premature. The insight I would not overlook is that XRP has recovered from its recent low, but recovery alone does not prove accumulation. The next breakout attempt needs to demonstrate that buyers are willing to defend higher prices, not merely that selling pressure has temporarily eased. $XRPUSDT #IMPACTbyTrade #ByXIMPACT
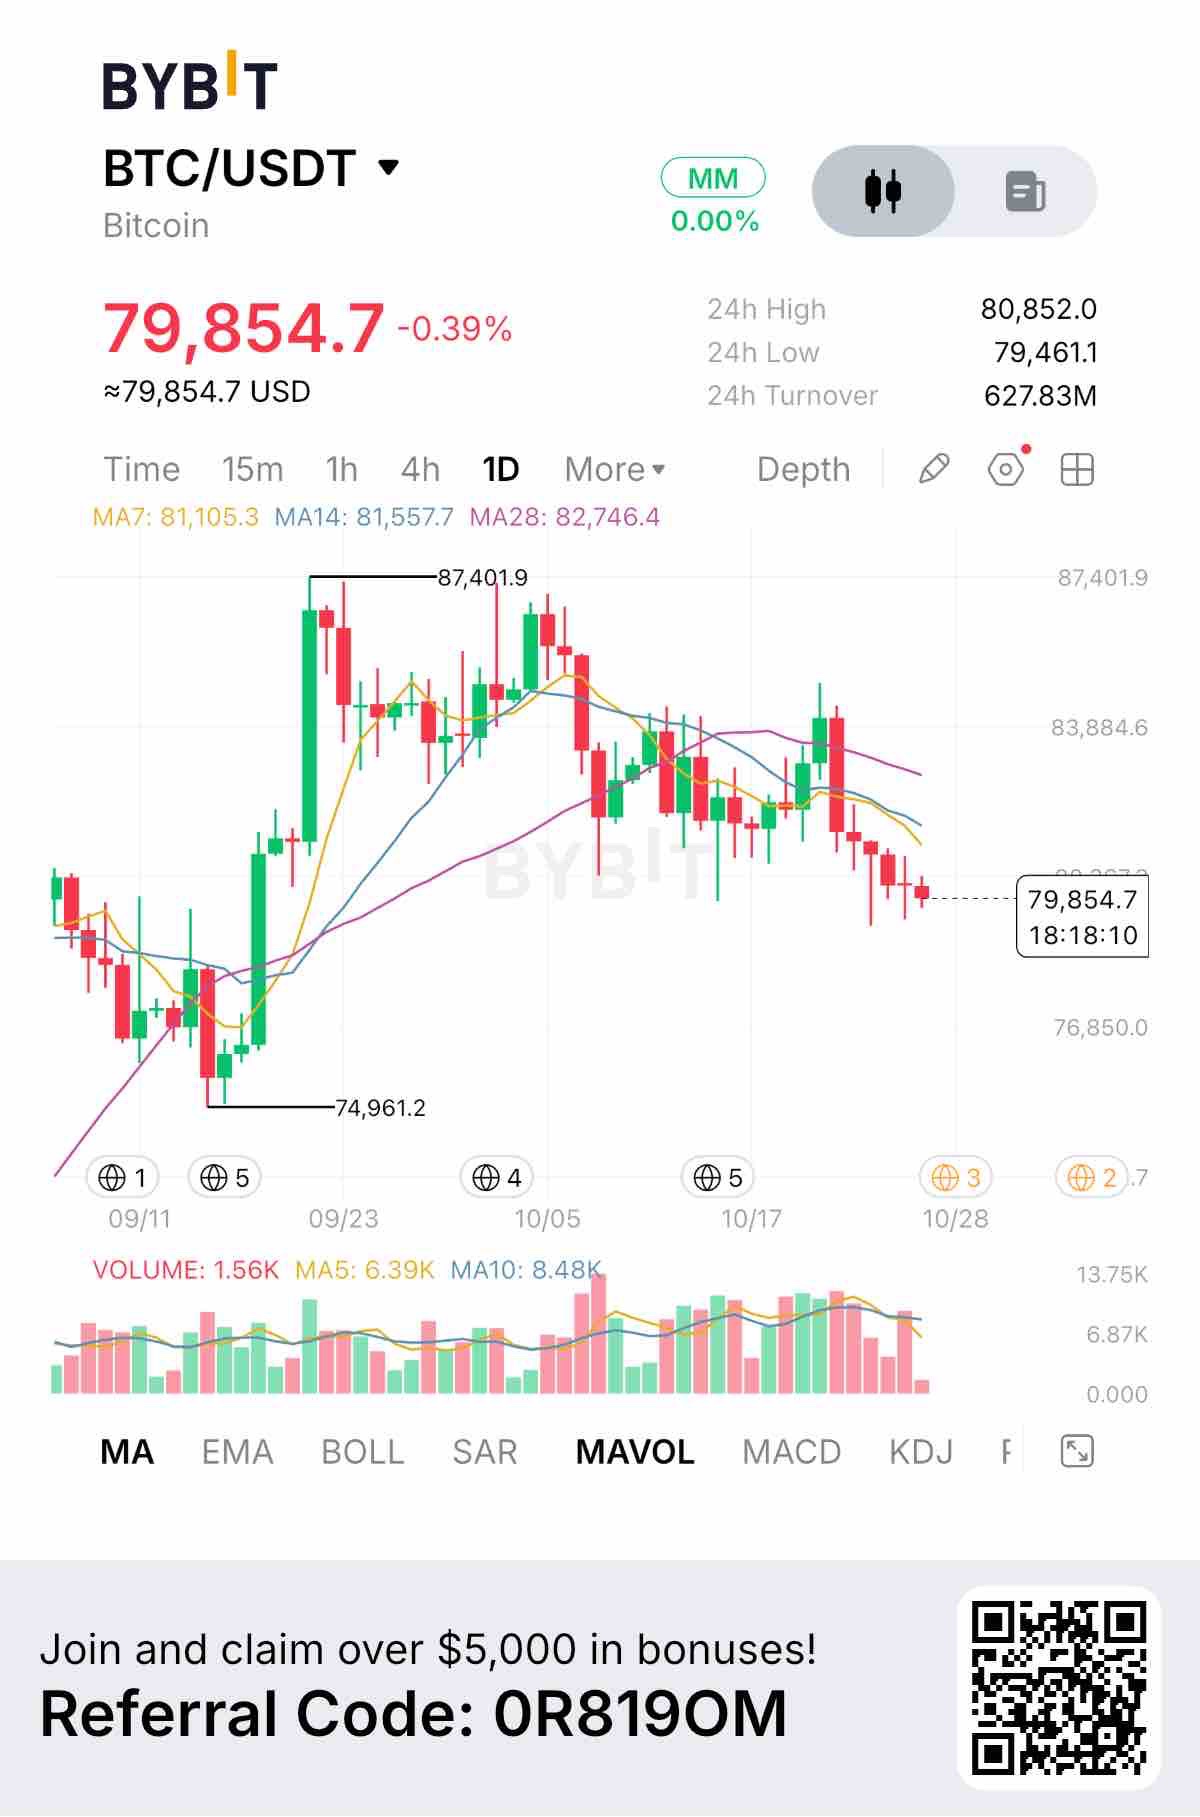
Bitcoin is trading near $79,854 on the provided daily chart, but I’m paying more attention to what happened after BTC failed near $87,402. The market has moved from a strong rally into a sequence of weaker recoveries, and that shift changes how I view the current price. The important question is whether $80,000 is becoming a launchpad for another recovery or simply a temporary pause before further downside. BTC is currently below its 7-day moving average at $81,105, its 14-day average at $81,557, and its 28-day average at $82,746. This alignment suggests sellers still have the short-term advantage. More importantly, every recovery toward the moving-average cluster now has the potential to become a test of overhead supply. I wouldn’t call this a confirmed breakdown yet. Bitcoin is approaching a decision zone, and the next reaction matters more than the current red candles. The immediate level I’m watching is $79,461, the 24-hour low shown in the screenshot. A break below it followed by a failed recovery would strengthen the bearish case. If BTC instead holds this region and reclaims $81,100–$81,600, selling pressure may be losing control. The $82,746 area would then become the next important test. Volume adds another layer of uncertainty. The latest candle displays 1.56K, below the shown 5-period and 10-period volume averages. However, the candle may still be forming, so this reading alone cannot confirm whether sellers are exhausted or buyers are simply absent. We would need completed-candle data and broader spot-market activity to distinguish those possibilities. My approach is conditional rather than predictive. A bullish setup needs a reclaim of the short-term moving averages and a successful retest. A bearish setup needs a convincing break below $79,461 and evidence that buyers cannot recover the level. Until one of those conditions appears, forcing a trade offers little advantage. The bigger insight is that Bitcoin does not need to collapse to become technically weak; it only needs repeated recovery attempts to fail. That is the pattern the current chart is asking traders to monitor. A successful reclaim could invalidate the immediate bearish interpretation, while continued lower highs and a loss of nearby support would strengthen it. For now, I favor patience over chasing either direction. The next confirmed move around these levels should provide better evidence than guessing whether the correction has already ended. $BTCUSDT #IMPACTbyTrade #ByXIMPACT
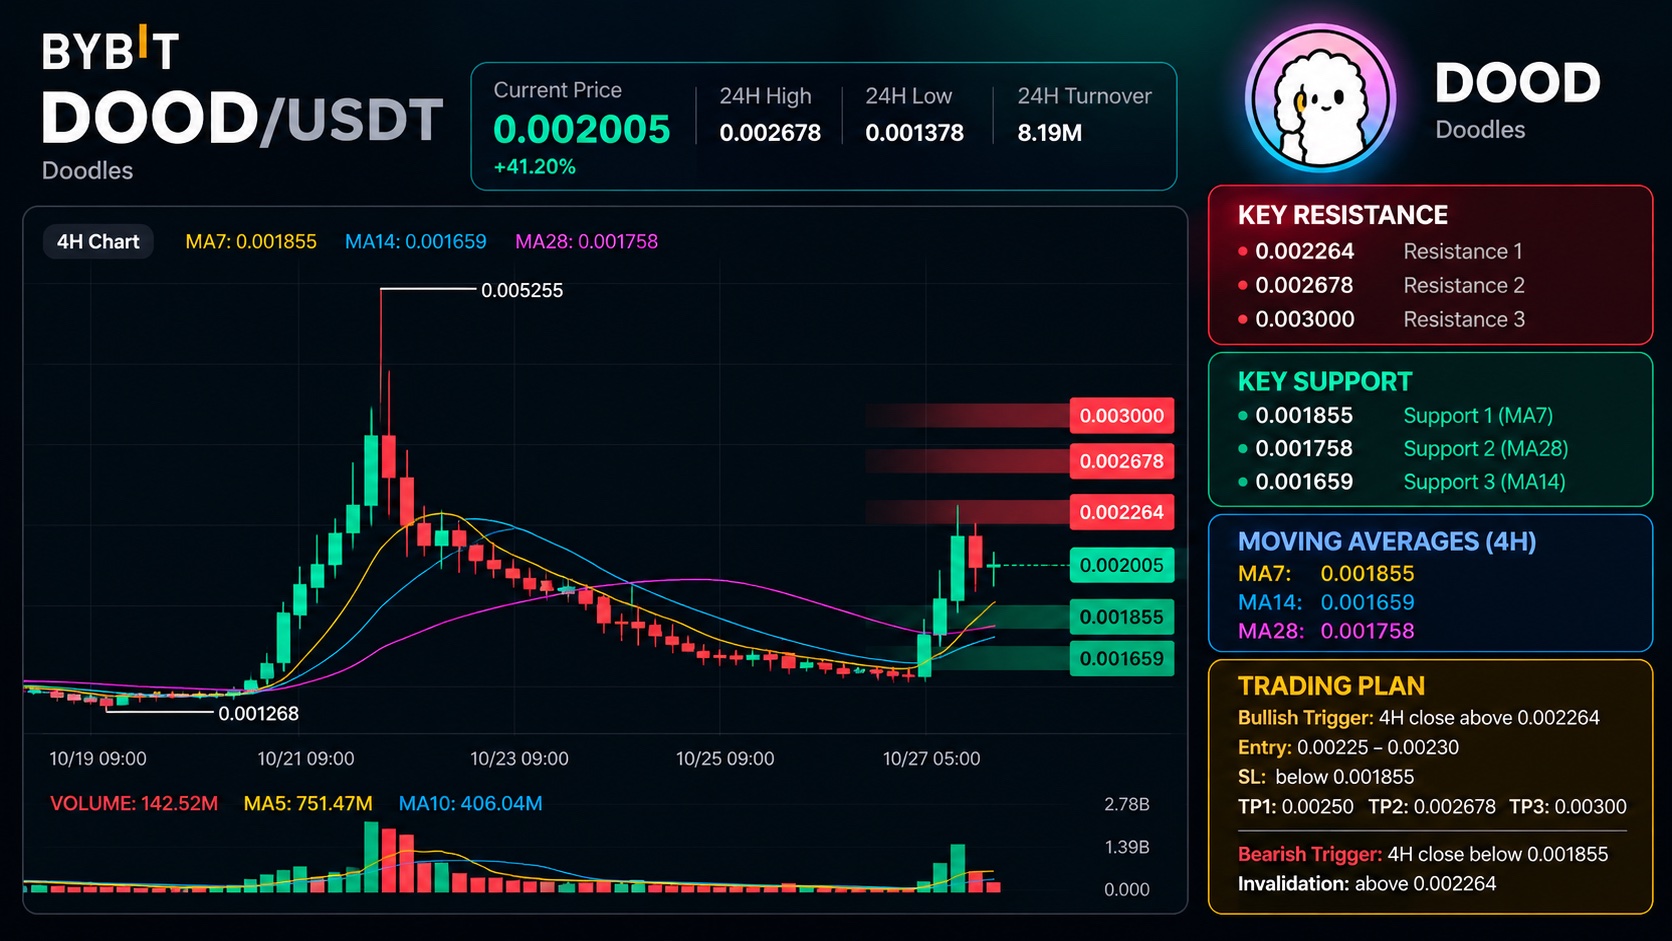
The biggest change in DOOD is the sudden expansion in price after several sessions of declining momentum. What catches my attention is not just the 41.20% gain, but the fact that buyers have pushed price back above all three moving averages after an extended decline. That is a meaningful change in the short-term structure, although it does not yet confirm a sustained trend reversal. On the 4H chart, DOOD is trading at $0.002005, with a visible 24H high of $0.002678, a low of $0.001378, and turnover of $8.19M. Before this move, price had gradually declined from an earlier spike to $0.005255 and eventually formed a base near $0.001268. The latest rally has lifted price away from that base, suggesting buyers are becoming more active after a prolonged period of weakness. The moving averages support this shift. MA7 is at $0.001855, MA14 at $0.001659, and MA28 at $0.001758. Price is now above all three, which improves the immediate technical picture. However, I would not confuse a short-term recovery with a confirmed long-term reversal. DOOD has already experienced a dramatic spike followed by a substantial decline, so I want to see whether the current move can establish a more stable structure. Volume is the next important piece of evidence. The chart displays current volume at approximately 142.52M, compared with MA5 volume of 751.47M and MA10 volume of 406.04M. The recent breakout was accompanied by a noticeable increase in trading activity, but the latest volume reading is lower than both averages. My interpretation is that the initial move attracted attention, while the market now needs fresh participation to sustain the rally. Without that follow-through, the price could struggle to break its nearby resistance levels. The immediate resistance zone is around $0.002264, followed by the recent high at $0.002678. These levels matter because buyers need to overcome them to demonstrate that the rally has more room to develop. On the downside, $0.001855 is the first level I am watching because it aligns with MA7. Below that, the $0.001659–$0.001758 region contains the MA14 and MA28, creating a broader support area. My read is cautiously constructive, but I would not chase a 41% move without confirmation. The recovery above the moving averages is encouraging, yet the history of a sharp spike followed by a prolonged decline makes risk management particularly important. I want to see DOOD hold its reclaimed levels and build support rather than rely on the size of the latest percentage gain. For a bullish setup, I would look for a 4H close above $0.002264, ideally followed by a successful retest with stronger volume. A possible entry zone would be $0.00225–$0.00230 after confirmation, with invalidation below $0.001855. My upside targets would be $0.00250, $0.002678, and $0.00300. The final target would require a convincing break above the recent high rather than just another brief price spike. For a bearish setup, I would watch for a decisive 4H close below $0.001855 followed by a failed reclaim. That would weaken the breakout structure and increase the possibility of a deeper retracement toward the $0.001758–$0.001659 area. A sustained recovery above $0.002264 would weaken this immediate bearish scenario. The one signal I am watching next is whether DOOD can break and hold above $0.002264 with expanding volume. If buyers achieve that, the current recovery could develop into a stronger continuation move toward $0.002678. If price fails at resistance and falls back below $0.001855, I would become more cautious and wait for a clearer structure before considering another entry. $DOODUSDT #IMPACTbyTrade #ByXIMPACT
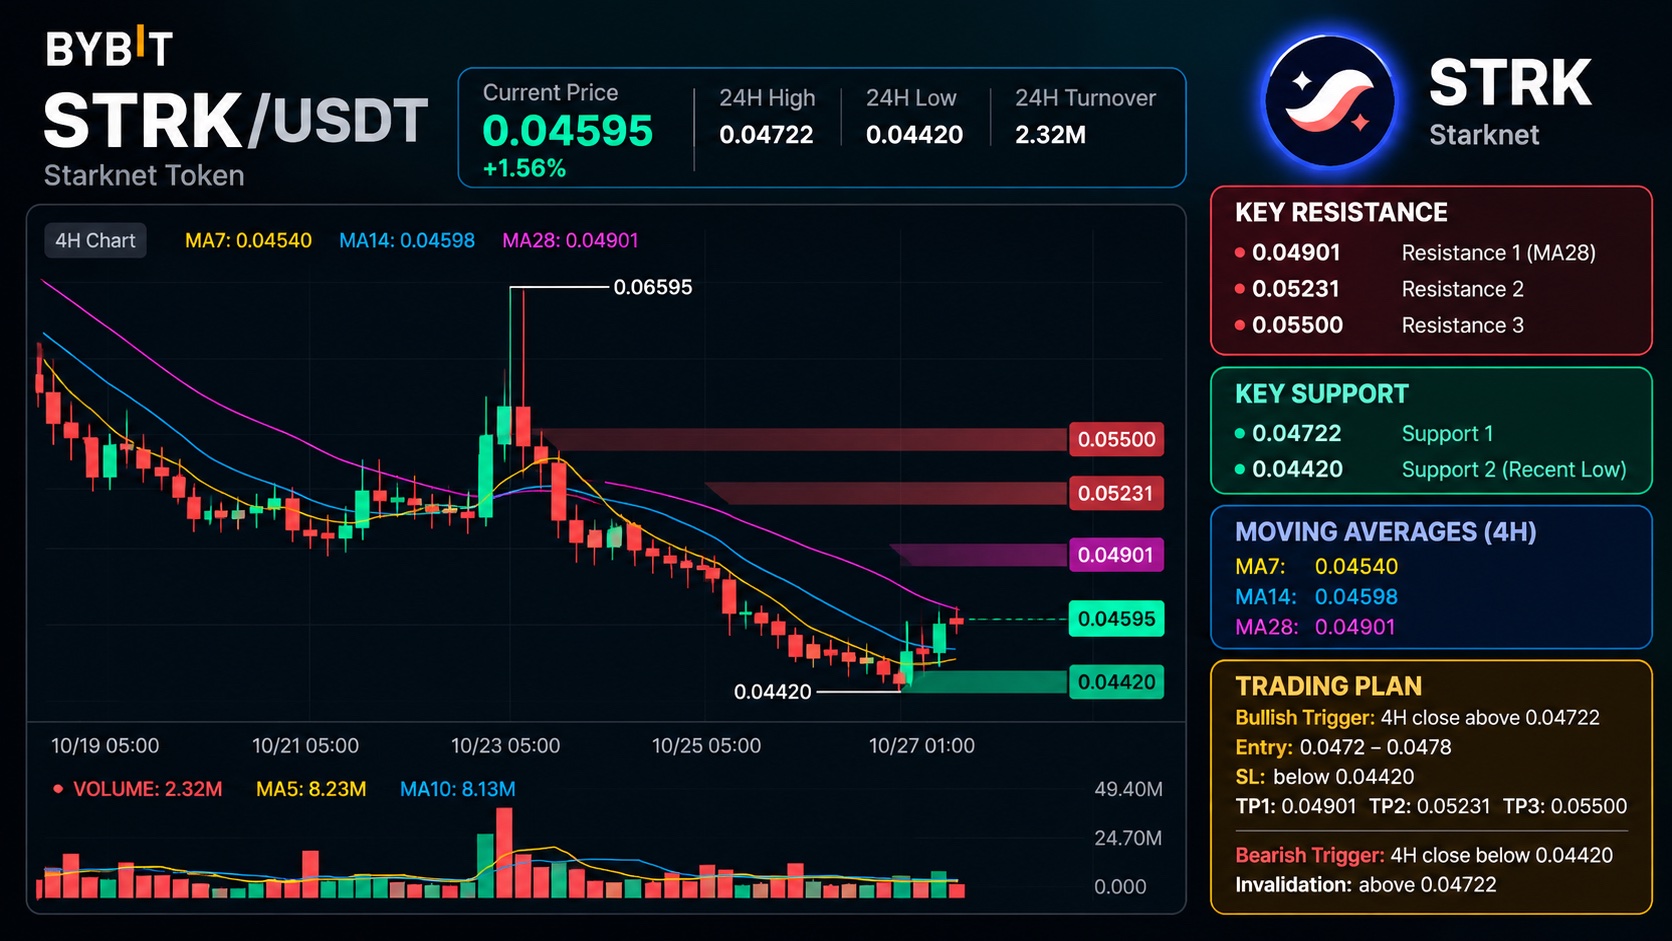
The most important change in STRK is that the price has finally bounced from a fresh low, but the broader 4H downtrend remains intact. I’m watching whether this is the beginning of a genuine recovery or simply a temporary pause after sustained selling. STRK is trading at $0.04595, up 1.56%, with a visible 24H high of $0.04722, a low of $0.04420, and turnover of $2.32M. The chart shows a persistent decline from above $0.060, interrupted by a sharp spike to $0.06595 that was quickly rejected. Since then, sellers have continued pushing price lower until it reached $0.04420. The current bounce is the first sign of buyers attempting to defend that area, but it is too early to call a trend reversal. The moving averages explain why I remain cautious. MA7 is at $0.04540, MA14 at $0.04598, and MA28 at $0.04901. Price has moved slightly above MA7 but remains around MA14 and well below MA28. The averages are still arranged in a bearish structure, so a small green move alone does not establish that buyers are back in control. Volume also needs context. The chart shows current volume around 2.32M, compared with MA5 at 8.23M and MA10 at 8.13M. The earlier spike around the failed rally attracted substantially more activity, while the latest bounce is happening with comparatively lower volume. I would like to see volume expand on an upward move before treating this recovery as meaningful. My read is that STRK is attempting to form a short-term base near $0.04420, but confirmation is missing. If buyers defend this low and reclaim the $0.0460–$0.0472 zone, momentum could improve. If the price loses $0.04420, the current bounce thesis weakens, and I would avoid trying to catch the falling knife. For a bullish setup, I would wait for a 4H close above $0.04722 followed by a successful retest. An entry around $0.0472–$0.0478 could be considered after confirmation, with invalidation below $0.04420. My upside targets would be $0.04901, $0.05231, and $0.05500. The first target aligns with MA28, while the higher targets would require stronger momentum and a meaningful change in market structure. For a bearish setup, I would watch for a decisive 4H close below $0.04420 followed by a failed reclaim. That would indicate the recent bounce has failed and sellers remain in control. A sustained recovery above $0.04722 would weaken the immediate bearish case, although the broader downtrend would still need further repair. I would WAIT rather than chase the current price. STRK is near its recent low, but buying solely because it looks cheap is not a strategy. I want evidence that demand is returning and that resistance is turning into support. The one signal I’m watching next is whether STRK can break and hold above $0.04722 with stronger volume. If that happens, I would become more constructive about a recovery toward $0.04901. If $0.04420 breaks first, I would treat the bounce as unsuccessful and reassess rather than assume the bottom is in. $STRKUSDT #IMPACTbyTrade #ByXIMPACT
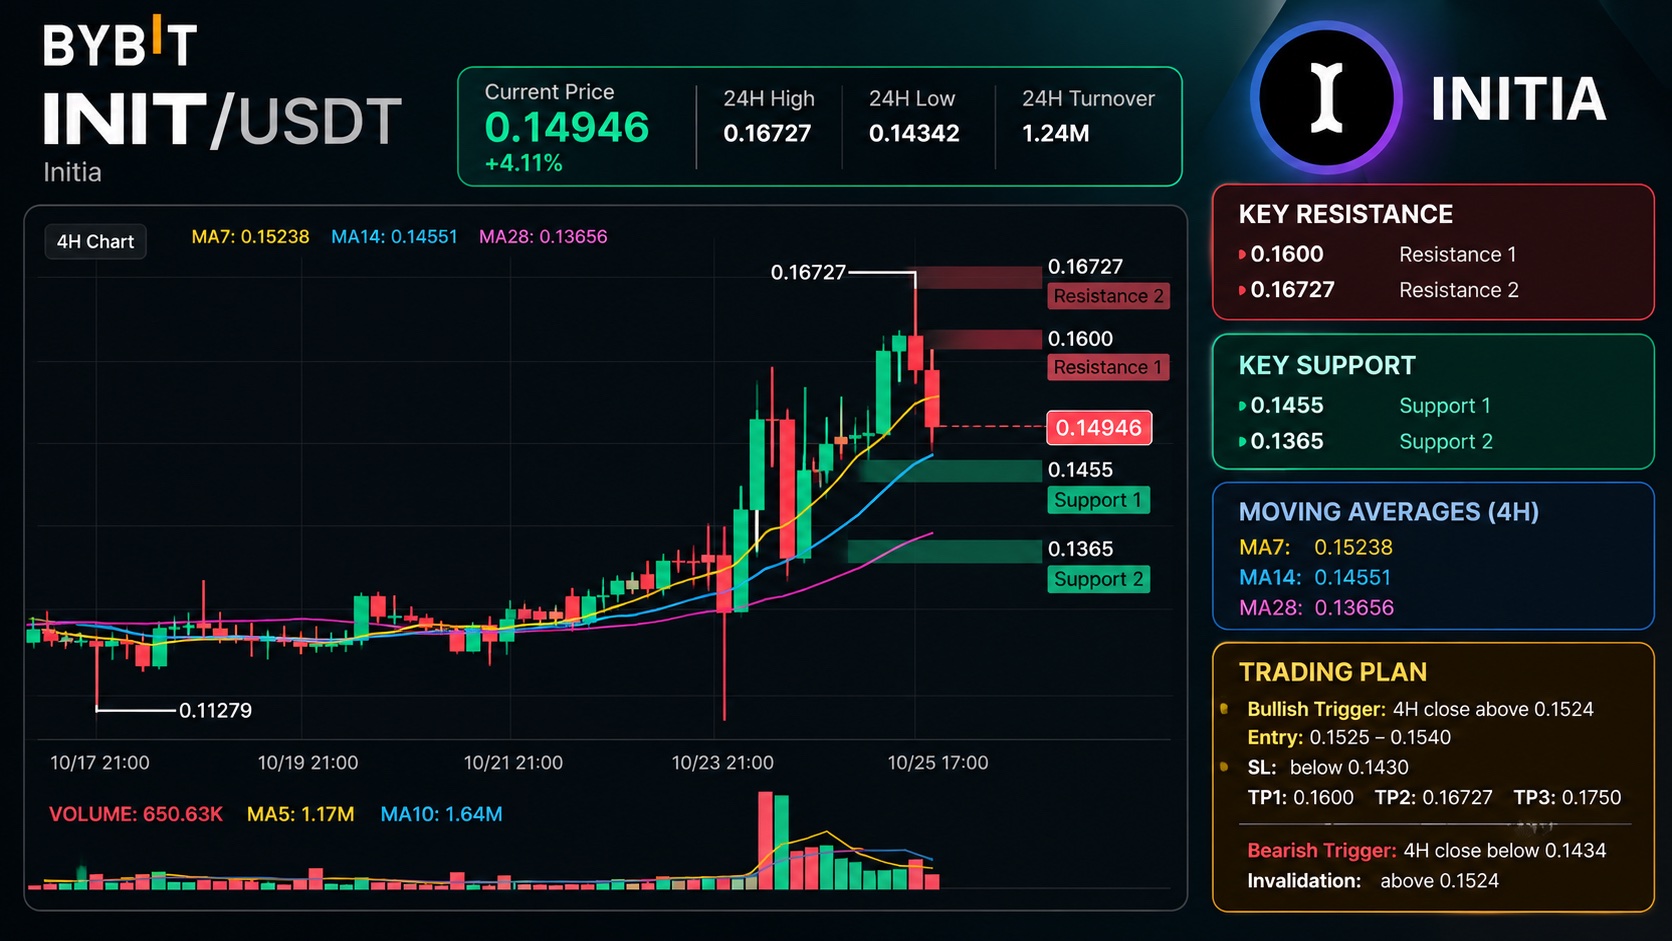
INIT has made a significant move from its previous consolidation range, but the latest candles show that buyers are facing resistance after a rapid rally. What matters now is whether this pullback becomes a healthy retest or the beginning of a deeper correction. On the 4H chart, INIT is trading at $0.14946, up 4.11%, with a visible 24H high of $0.16727, a low of $0.14342, and turnover of $1.24M. Price spent several sessions consolidating around $0.124–$0.130 before breaking higher with a sharp increase in volume. That breakout changed the short-term structure, taking INIT well above its previous trading range. The strongest evidence is the moving-average structure. MA7 is at $0.15238, MA14 at $0.14551, and MA28 at $0.13656. Price has slipped below MA7 but remains above MA14 and MA28. I read this as a short-term cooling phase inside a still-improved structure, rather than a confirmed bearish reversal. However, the recent rejection from $0.16727 shows that sellers are active at higher prices. Volume adds another layer to the picture. The breakout came with a large volume spike, but the latest candle shows approximately 650.63K in volume, below the displayed MA5 of 1.17M and MA10 of 1.64M. That suggests activity has cooled after the initial expansion. I want to see whether buyers return during the pullback instead of assuming that the earlier momentum will continue automatically. My interpretation is that INIT is testing whether its breakout can hold. The $0.1434–$0.1455 area is important because it combines the visible 24H low with the MA14 region. If buyers defend that zone and price reclaims $0.15238, the market could attempt another move toward the recent high. If support fails, the next meaningful area on the chart is around $0.1365, near MA28. For a bullish setup, I would look for a 4H close back above $0.1524, followed by a successful retest. A possible entry zone would be $0.1525–$0.1540 after confirmation, with a stop-loss or invalidation below $0.1430. My targets would be $0.1600, $0.16727, and $0.1750, with the final target conditional on a confirmed breakout above the previous high. These are scenario levels, not guaranteed outcomes. For a bearish setup, I would watch for a decisive 4H close below $0.14342 followed by a failed reclaim. That would weaken the breakout structure and increase the likelihood of a deeper retracement toward $0.1365. A recovery above $0.1524 with sustained buying would weaken this bearish view. I would not chase INIT at the current price without confirmation. The rally has already moved a considerable distance from its consolidation base, and entering during an unresolved pullback can create an unfavorable risk-to-reward profile. The one signal I’m watching next is whether INIT can reclaim $0.15238 and hold it on a 4H closing basis. If buyers recover that level while volume improves, I would become more constructive about a retest of $0.16727. If price instead loses $0.14342, I would treat the pullback as a potential structural breakdown rather than a routine dip. $INITUSDT #ByXIMPACT
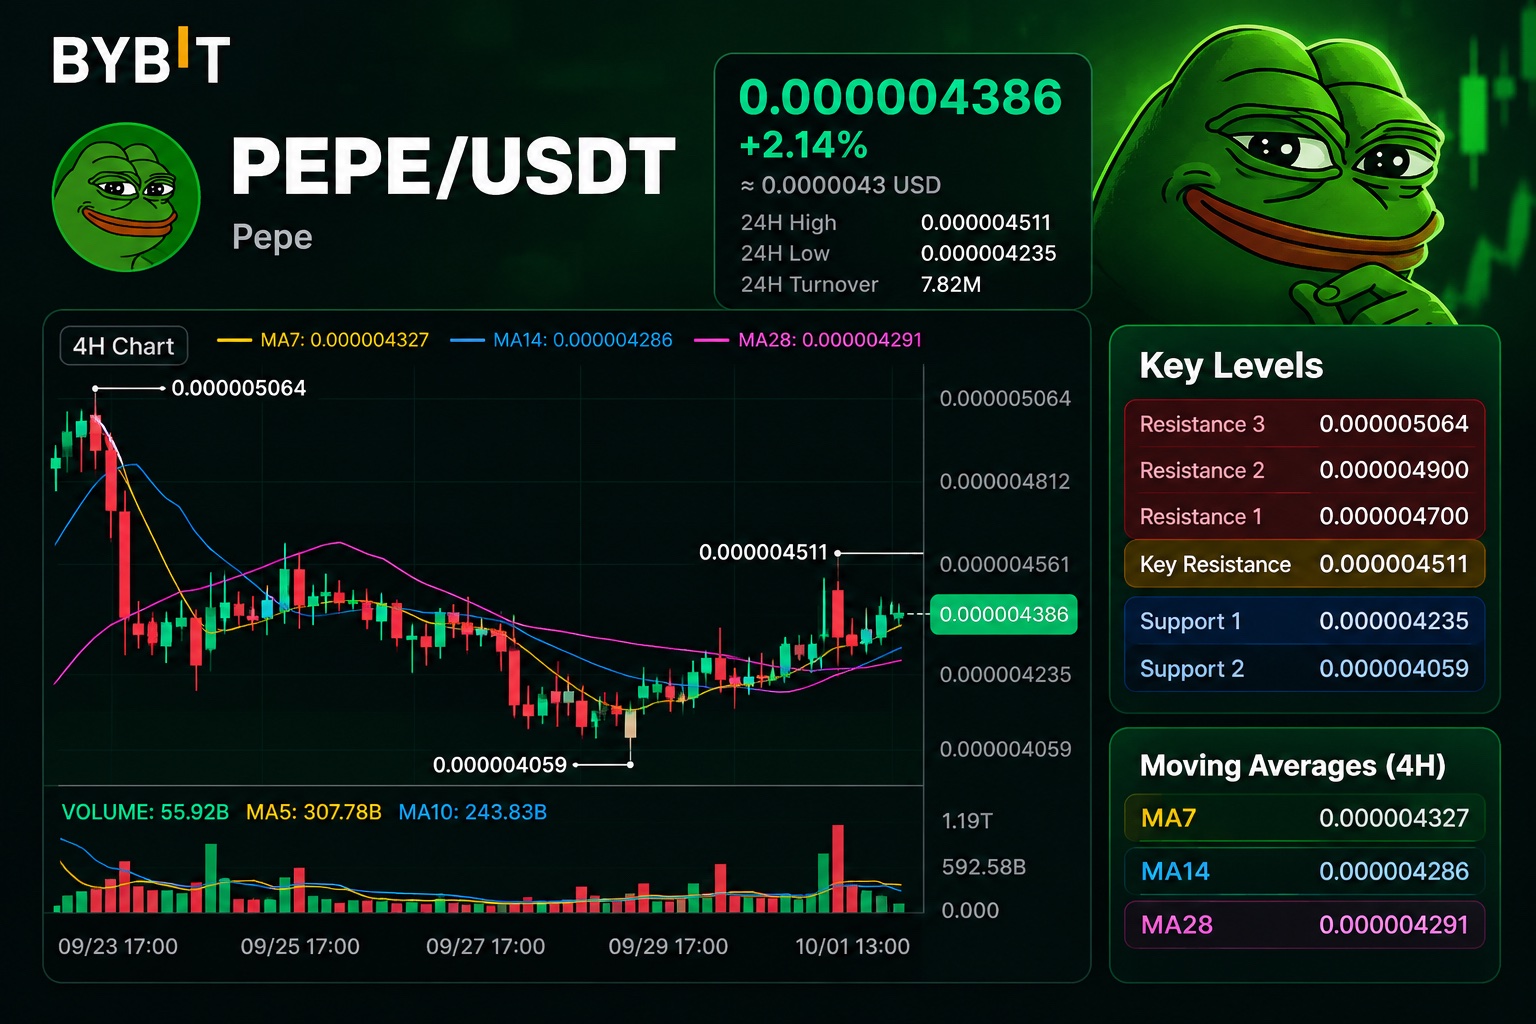
The most important change in PEPE is not the 2.14% green candle on my chart. It is that PEPE recently expanded beyond its original Ethereum trading environment and launched as a canonical Solana SPL token through Wormhole’s Native Token Transfer system. That gives the meme coin access to a completely different liquidity and trading environment, and the market response was large enough to matter. On the uploaded 4H chart, PEPE is trading at 0.000004386, up 2.14%, with a visible 24H high of 0.000004511, low of 0.000004235, and turnover of $7.82M on this Bybit pair. The chart shows that after falling toward 0.000004059, price has started building a recovery structure. It is now trading above the visible MA7 at 0.000004327, MA14 at 0.000004286, and MA28 at 0.000004291. That moving-average shift is the technical change I care about. PEPE spent much of the chart moving sideways to lower, but the latest candles have started pushing above the short-term averages. It is not yet a major breakout because the previous local high around 0.000004511 remains overhead, but the market is beginning to show a different short-term structure. The fundamental catalyst behind the recent activity is PEPE’s September 18 launch on Solana. Through Wormhole NTT, PEPE became a canonical SPL asset rather than simply relying on a wrapped representation. Within roughly 24 hours, Solana-side PEPE trading volume reportedly exceeded $40M, showing that the new distribution route immediately attracted meaningful activity. That matters because PEPE is fundamentally a liquidity- and attention-driven asset. Adding another major ecosystem creates another venue where traders can discover, trade and provide liquidity for the same underlying meme asset. It does not guarantee that the new demand will persist, but it changes the market structure around PEPE. The broader market data also shows that PEPE remains highly liquid. Bybit’s latest market page reports PEPE around $0.00000431, approximately $1.81B market cap, $336.56M in 24H volume, and a circulating supply of 420.69T PEPE. The reported 24H range is approximately $0.00000424–$0.00000450. There is another reason I’m watching the volume rather than simply the percentage gain. CoinMarketCap reported that PEPE surged 27.2% on September 22, while daily trading volume reached approximately $784.5M. That was a much larger expansion than the current 2.14% move. To me, that means the current question is no longer whether PEPE can attract attention—it clearly can. The question is whether that attention can continue after the initial expansion. My read is WAIT for the breakout confirmation. The chart has improved, but PEPE is sitting just below the 0.000004511 local resistance. I don’t want to chase before that level is actually reclaimed. For the bullish setup, my trigger is a clean 4H close above 0.000004511, followed by a successful retest. A potential entry would be around 0.00000450–0.00000455 after confirmation, with invalidation below 0.00000430. The first levels I would monitor are approximately 0.00000470, 0.00000490, and 0.00000506. For the bearish scenario, a 4H breakdown below 0.000004235 would weaken the current recovery. If PEPE then loses 0.000004059, I would consider the recent bounce invalidated rather than assuming another immediate recovery. The ONE signal I’m watching next is 0.000004511. If PEPE breaks that level with expanding volume and successfully holds it as support, I’ll have stronger evidence that the current recovery is becoming a genuine continuation move. If it repeatedly rejects there, I would rather wait for a clearer structure than chase the first bounce. $PEPEUSDT #ByXIMPACT
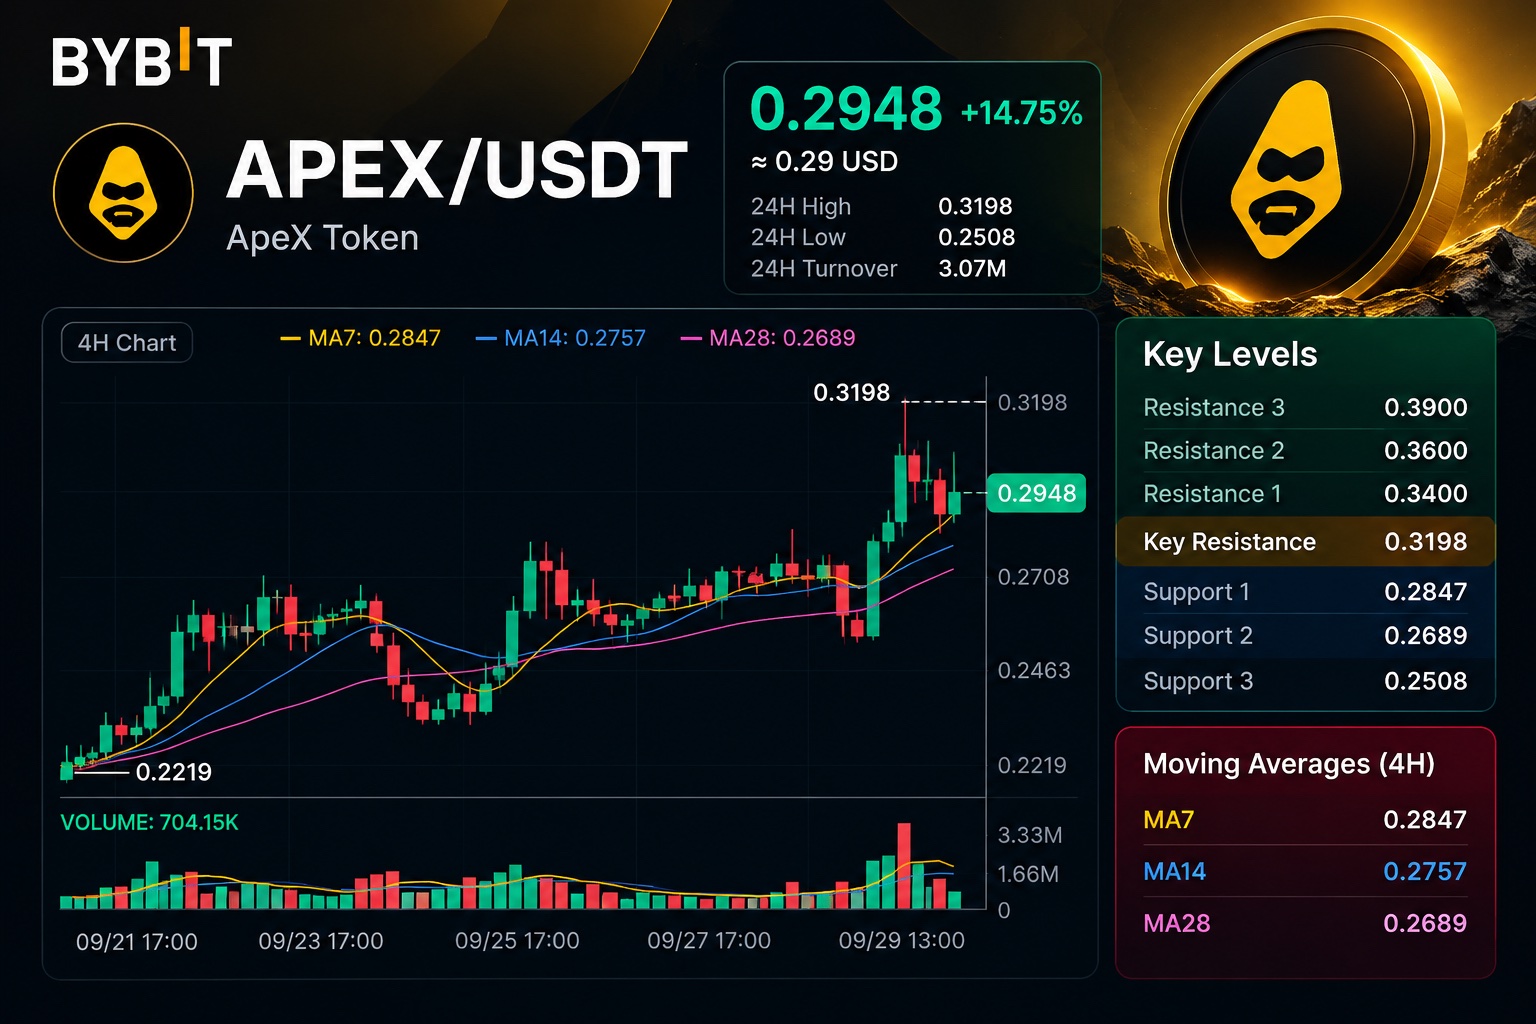
APEX has just moved from a slow consolidation into a much more aggressive expansion phase, and the part I’m watching is how the price behaves after the first breakout spike. On the uploaded 4H chart, APEX is trading at $0.2948, up 14.75%, with a visible 24H high of $0.3198, low of $0.2508, and turnover of $3.07M. Price had been moving around the $0.25–$0.27 area for several sessions, then suddenly broke higher and reached $0.3198. That is the most important structural change on the chart. The breakout also came with a noticeable volume expansion. The screenshot shows current volume around 704K, while MA5 volume is approximately 1.66M and MA10 is 1.34M. More importantly, the largest volume bars appeared during the initial breakout rather than during the earlier sideways structure. That tells me the move attracted substantially more participation than the preceding consolidation. The moving-average structure has also changed. APEX is currently above MA7 at $0.2847, MA14 at $0.2757 and MA28 at $0.2689. The short-term averages are therefore sitting below price, creating a potential support ladder. But the immediate problem is obvious: price is still below the recent $0.3198 spike high. There is a fundamental reason I’m paying attention to this move. ApeX has continued expanding ApeX Omni, its non-custodial trading platform. ApeX describes Omni as offering more than 100 perpetual markets, up to 100x leverage, plus stock perpetuals, prediction markets and event trading. Its official site also highlights zero-gas derivatives trading and cross-collateral functionality. That product expansion matters because it gives the APEX ecosystem a broader trading-activity narrative rather than relying only on one crypto-perpetual product. Recent ApeX updates also show continued development around Omni, including automatic redemption, TRON USDT deposits and other platform changes. The market data supports the acceleration visible on my chart. CoinGecko currently reports APEX around $0.2948, with roughly $4.01M in 24H trading volume, approximately 160M APEX circulating, and a market cap around $45.9M. Another important detail is supply. Tokenomist currently lists the APEX vesting schedule as having ended in 2026, meaning there is no upcoming scheduled unlock according to its latest data. That removes one immediate scheduled-supply event from the short-term setup, although the circulating/fully diluted supply distinction still matters. My read is that the chart has clearly improved, but I don’t want to chase a 14% move directly underneath $0.3198. The more interesting setup would be a pullback that proves the breakout zone has become support. For the bullish scenario, I’m watching for a clean 4H break above $0.3198, ideally followed by a successful retest. A potential entry would be around $0.316–$0.322 after confirmation, with invalidation below $0.2940. The next areas I would watch are $0.3400, $0.3600 and $0.3900. For the bearish scenario, a 4H close below $0.2847 would weaken the immediate breakout structure. The more important invalidation area is around $0.2689, where the MA28 currently sits. If price loses that zone after failing to hold the breakout, I would rather wait for a new structure than assume the rally will continue. The ONE signal I’m watching next is $0.3198. A clean reclaim and successful retest would tell me the market is accepting prices above the recent spike high. A rejection followed by a loss of $0.2847 would tell me the breakout needs much more time to prove itself. $APEXUSDT #ByXIMPACT
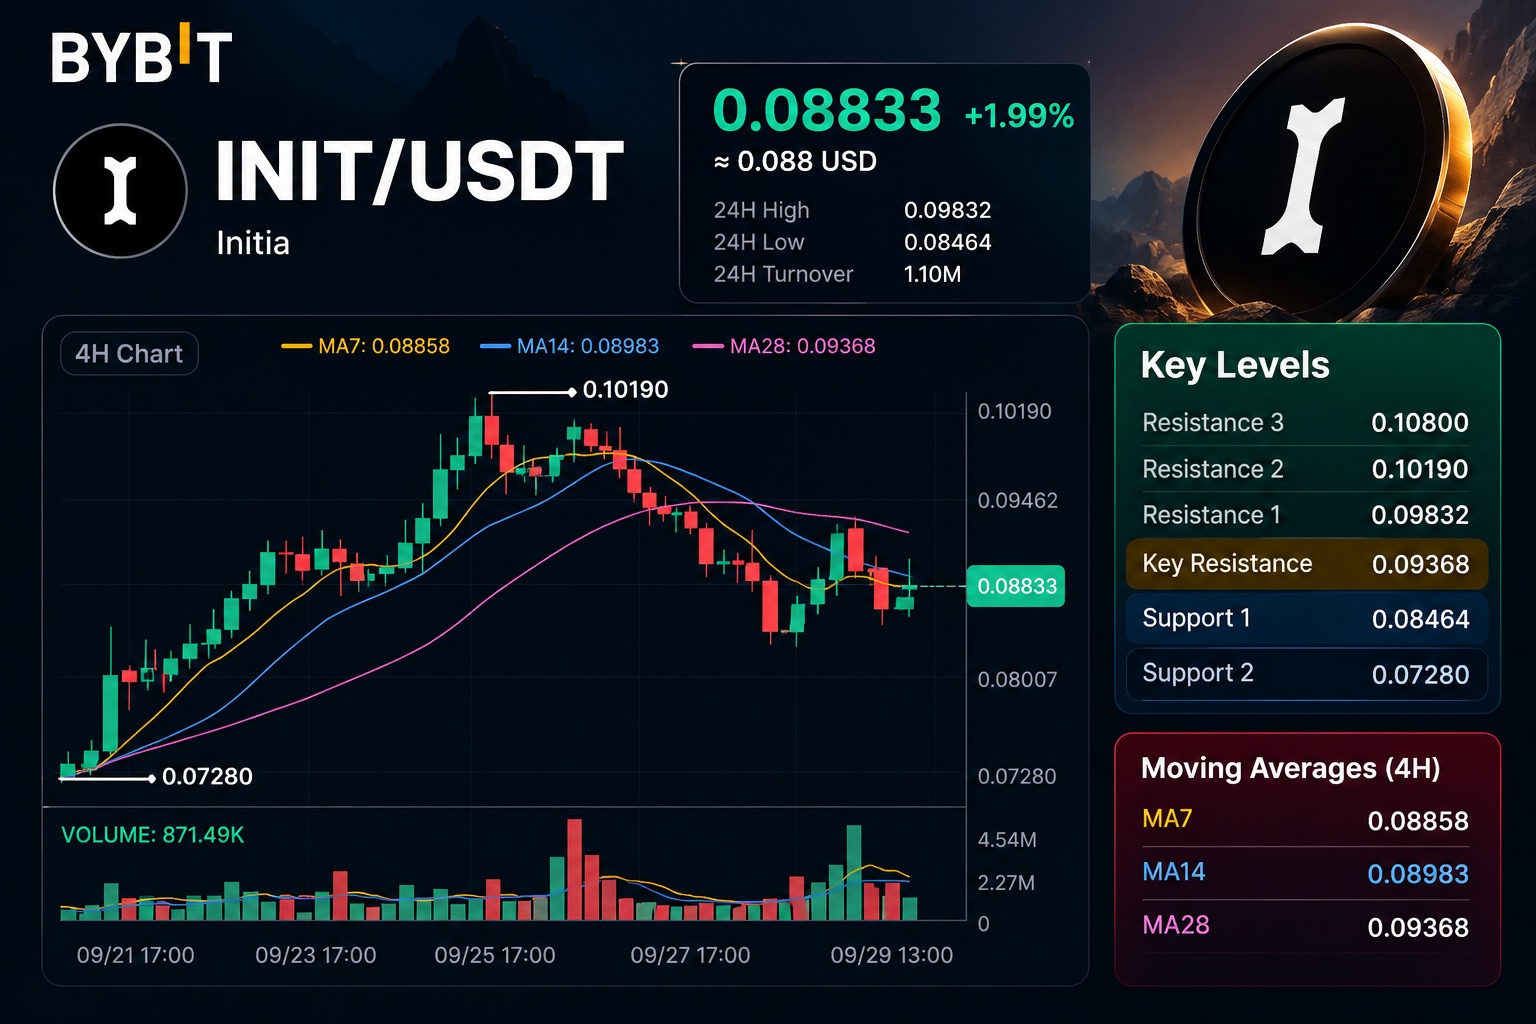
The key change in INIT is not the 1.99% green candle. It is the fact that price is trying to stabilize immediately after a sharp selloff, while the 4H structure is still sitting below a major moving-average resistance cluster. On the uploaded chart, INIT is trading at $0.08833, with a 24H high of $0.09832, low of $0.08464, and turnover of $1.10M. The chart shows a strong rally from roughly $0.07280 into $0.10190, followed by a sustained decline. The recent bounce from around $0.084–$0.085 has not yet repaired that structure. The moving averages are important here. MA7 is at $0.08858, MA14 at $0.08983, and MA28 at $0.09368. Price is currently sitting just below MA7 and MA14 and well below MA28. So I’m not interested in chasing the small green recovery yet. I want to see whether INIT can reclaim this resistance cluster first. There is also a supply-side factor worth watching. Tokenomics trackers show that 8.49M INIT were unlocked on September 24, equal to about 0.85% of total supply. Smaller daily releases are also continuing, while another larger unlock is scheduled for October 24. I wouldn’t automatically blame the recent decline on the unlock because correlation does not prove causation, but the timing makes circulating supply something I would keep on my radar. From a fundamental perspective, Initia is building around its Interwoven Stack, combining application-specific rollups with shared infrastructure for interoperability, data availability and other network services. That gives INIT a broader protocol role, but near-term price still has to absorb supply and prove that buyers are willing to step back in. My read is WAIT for confirmation. The recent bounce is interesting because buyers defended the $0.08464 area and produced a sharp reaction, but the recovery has so far stalled around the moving averages. The volume spike during the rebound shows strong participation, but I want to see whether that demand continues instead of disappearing after one impulse. For a bullish setup, I’m watching for a 4H close above $0.09368 followed by a successful retest. A potential entry would be around $0.0935–$0.0945 after confirmation, with invalidation below $0.0890. The levels I would watch afterward are $0.09832, $0.10190 and potentially $0.10800. For the bearish scenario, a 4H close below $0.08464 followed by failure to reclaim that level would change the structure again. In that case, I would avoid assuming the current bounce has established a bottom. A recovery back above $0.09368 with sustained volume would invalidate that bearish setup. The ONE signal I’m watching next is $0.09368. That is the MA28 level and sits near the recent breakdown area. If INIT reclaims it and holds, the chart would begin repairing its downtrend. If price instead loses $0.08464, the recent bounce has failed and I would wait for a new structure rather than force a trade. $INITUSDT #ByXIMPACT
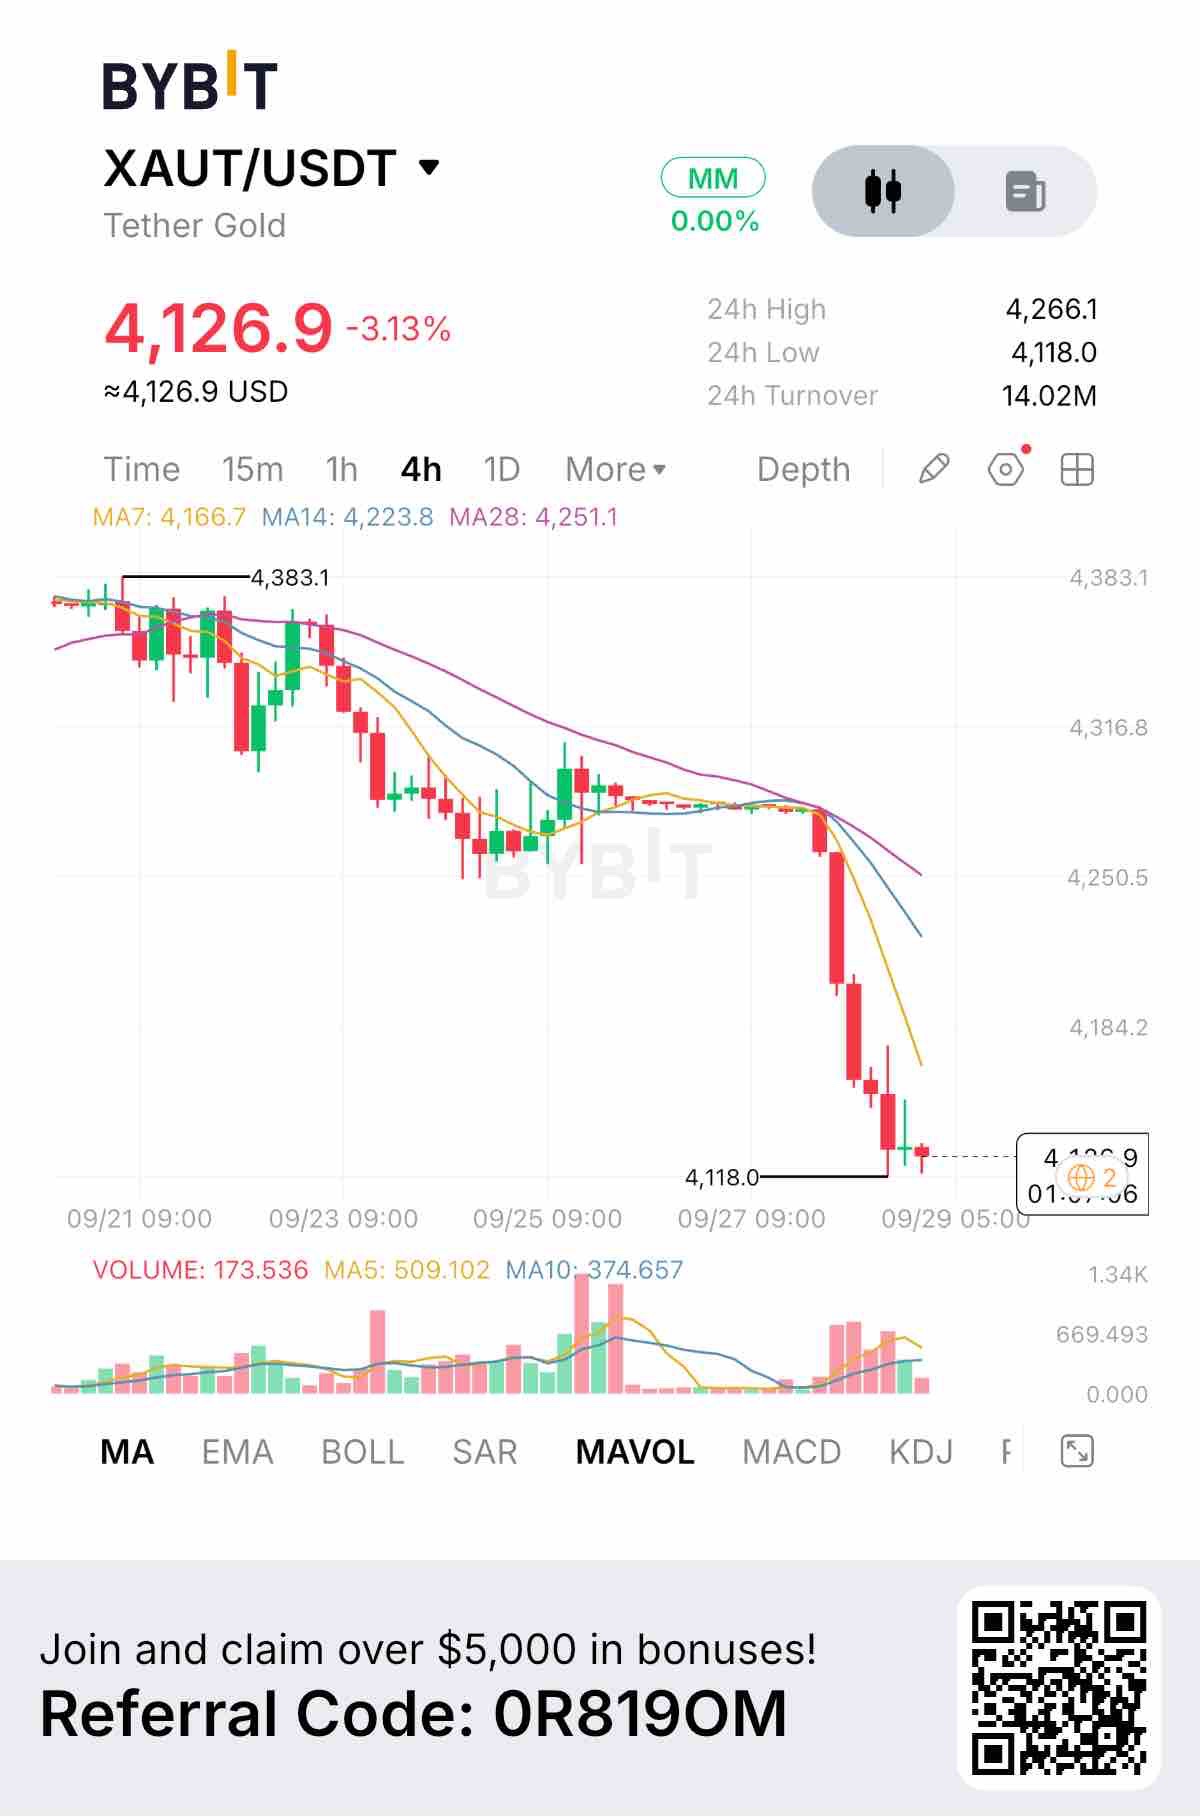
The important change in XAUT is not simply the 3.13% drop. What changed is that the token has now broken sharply below a multi-session support structure while the underlying gold market is also coming under pressure. That makes this move different from a normal crypto pullback. On my 4H chart, XAUT is trading at $4,126.9, down 3.13%, with a visible 24H range of $4,118–$4,266.1 and turnover of $14.02M. Price had spent several sessions compressing around the $4,250 area, but then sellers broke that structure with consecutive large red candles. The technical damage is clear. XAUT is now below: MA7: $4,166.7 MA14: $4,223.8 MA28: $4,251.1 The averages are also pointing downward, while the latest selling candles came with elevated volume. The chart shows current volume around 173.5K, compared with MA5 around 509.1K and MA10 around 374.7K. So although the current candle’s volume is lower than those averages, the recent selloff itself was accompanied by several large-volume red bars. The external data confirms that this isn’t isolated to the Bybit chart. CoinGecko’s historical data shows XAUT closing around $4,372 on September 20, falling to about $4,261 on September 27. That is roughly a 2.5% decline in one week before the sharper move visible on my chart. There’s an important structural detail behind XAUT itself: one XAU₮ represents ownership of one fine troy ounce of physical gold, with Tether’s documentation stating that the gold is held in Swiss custody and meets the London Good Delivery standard. That means I don’t treat XAUT exactly like a normal altcoin. Its fundamental anchor is gold, while its trading behavior still carries crypto-market liquidity and exchange-specific volatility. There has also been a recent change in Tether’s gold ecosystem. Alloy by Tether and aUSD₮ are being wound down, with new minting closed and users instructed to return aUSD₮ and remove XAU₮ from the platform by September 17, 2026. I wouldn’t automatically attribute today’s XAUT decline to that event, but it is relevant context when looking at gold-token liquidity and collateral flows. My read: the chart is currently in a clear defensive phase. I don’t see enough evidence to buy simply because XAUT has reached the $4,118 area. I would rather see whether that level produces a genuine 4H reversal. Bullish trigger: reclaim $4,166.7, followed by a 4H close above the MA7 and stabilization. Entry: around $4,170–$4,200 after confirmation. SL/invalidation: below $4,118. TP1: $4,223.8 TP2: $4,251.1 TP3: $4,316.8 Bearish trigger: decisive 4H close below $4,118 followed by failure to reclaim it. Invalidation: recovery above $4,223.8 with sustained buying. I would WAIT rather than chase either direction here. The distance between the current price and the first resistance cluster is relatively small, while the recent downside momentum remains strong. The ONE signal I’m watching next is $4,118. If buyers defend it and reclaim $4,166.7, the selloff may be entering a stabilization phase. If $4,118 breaks cleanly, I would treat the current structure as continuation rather than a simple dip. $XAUTUSDT #ByXIMPACT

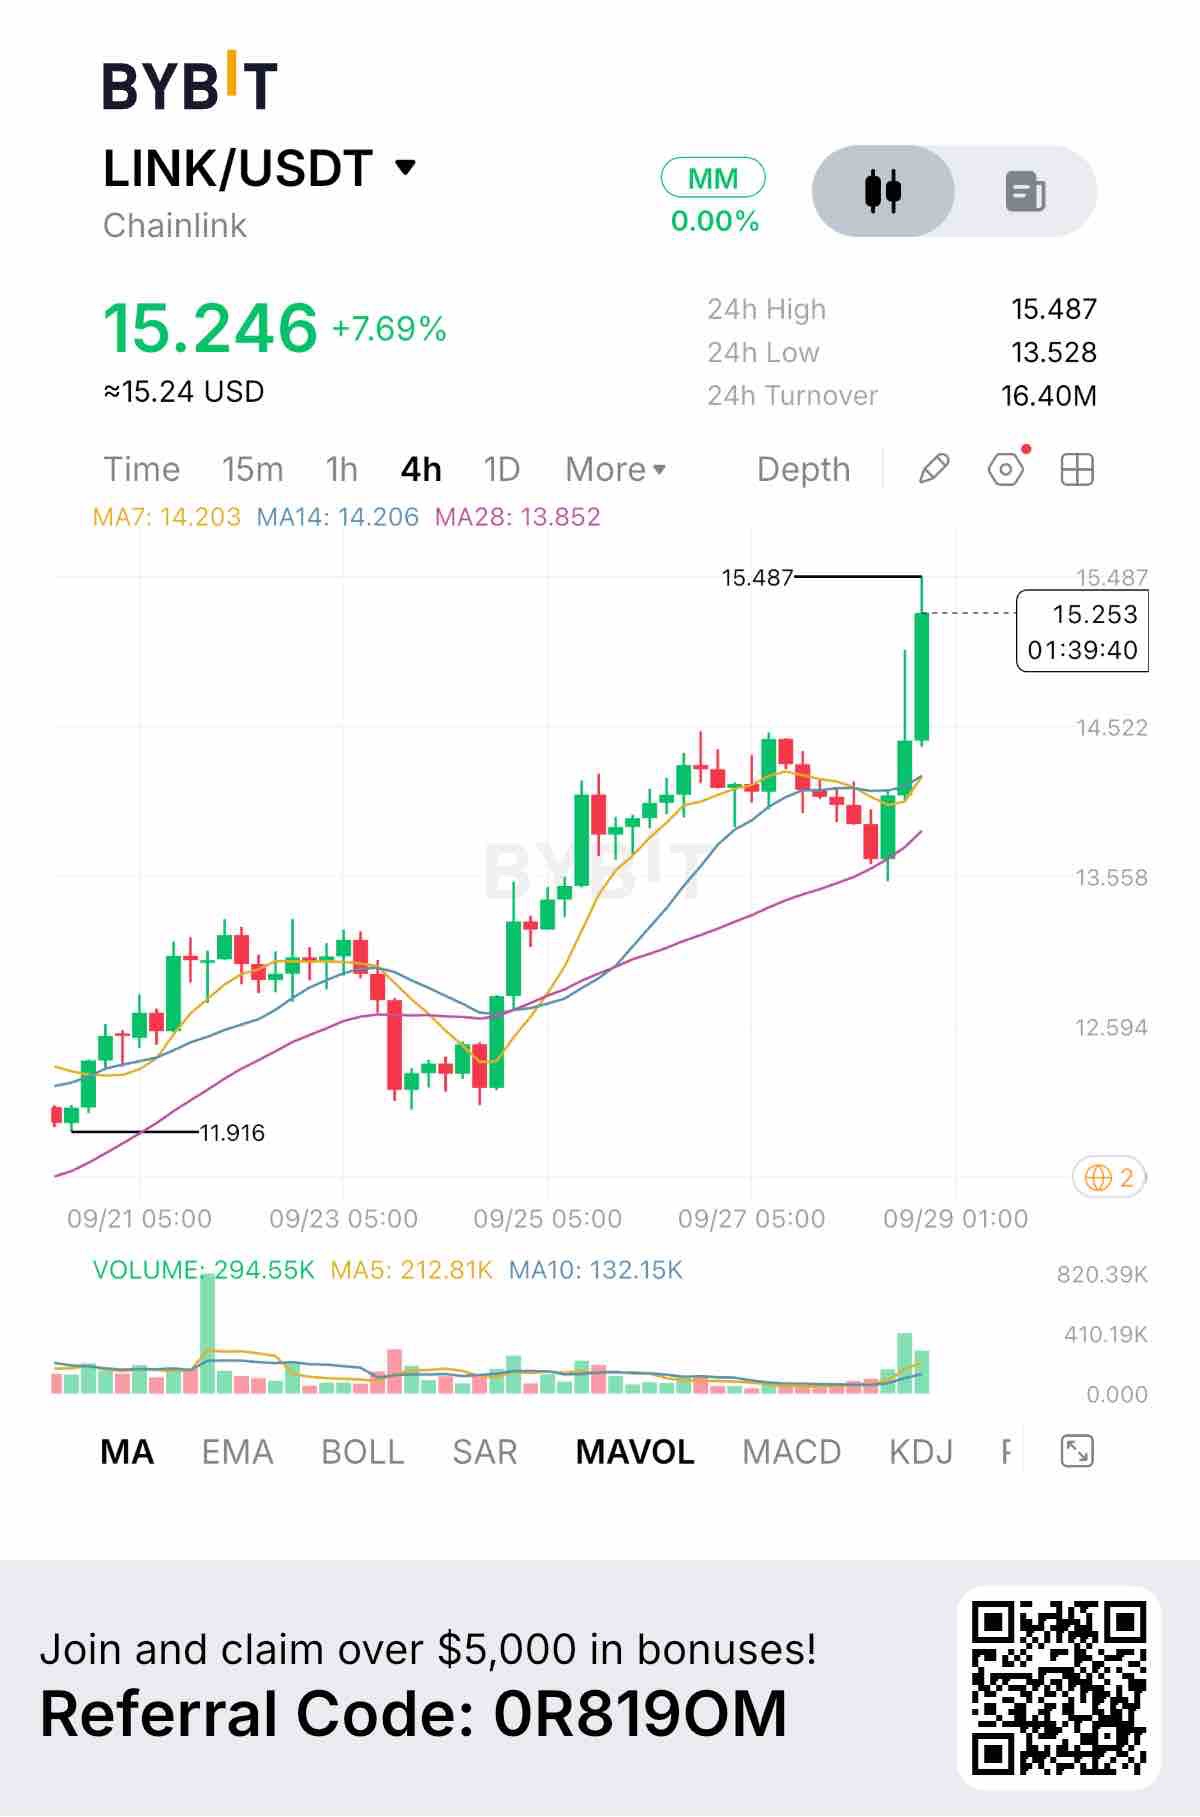
The biggest change in LINK right now isn’t simply the 7.69% move. It is that the rally is arriving at the same time Chainlink has launched CCIP 2.0, turning the current price expansion into a move with a fresh fundamental catalyst behind it. Chainlink announced CCIP 2.0 on September 28, describing it as a new generation of its cross-chain interoperability protocol aimed at helping institutions distribute tokenized assets across different blockchains without rebuilding their existing technology stack. The launch includes support from names including AWS, ANZ Bank, Deutsche Börse’s Crypto Finance, Fidelity International, Google Cloud, SBI Digital Markets, Sygnum and Taurus. That matters because this is not just another partnership headline. The important change is the type of demand Chainlink is targeting: institutional movement of digital and tokenized assets across multiple networks. I can see the market reacting to that change on the uploaded 4H chart. LINK is shown at $15.246, up 7.69%, with a visible 24H high of $15.487, low of $13.528, and turnover of $16.40M. More importantly, price has pushed above the previous consolidation area around $14.0–$14.5 and is now testing the chart high. The moving averages have also shifted into a supportive structure: MA7: $14.203 MA14: $14.206 MA28: $13.852 Price is currently above all three. The volume structure is another reason I’m paying attention. The latest candles show a clear increase in activity, with the chart displaying current volume around 294.55K, versus MA5 volume around 212.81K and MA10 around 132.15K. So this isn’t a quiet drift upward; participation has increased as LINK approached the previous high. There is also a broader infrastructure story behind the move. Chainlink’s own documentation shows continued expansion of CCIP and its data infrastructure during September, including CCIP expansion to Arc Mainnet and additional cross-chain token support. My read is that LINK has changed from range-bound trading into a breakout test, but I don’t want to chase the candle directly underneath $15.487. That level is now the key battlefield. If buyers can turn the previous high into support, the breakout has room to develop. If LINK gets rejected and falls back into the old range, I would treat the move much more cautiously. Bullish trigger: 4H close above $15.487, followed by a successful retest. Entry: $15.45–$15.70 after confirmation/retest SL/invalidation: $14.90 TP1: $16.30 TP2: $17.00 TP3: $18.00 Using a $15.60 entry and $14.90 invalidation, TP1 gives roughly 1R, TP2 around 2R, and TP3 around 3.4R, before fees and slippage. Bearish trigger: rejection from $15.487 followed by a 4H breakdown below $14.90. Invalidation: reclaiming and holding above $15.487 with expanding volume. The ONE signal I’m watching next is whether $15.487 becomes support after the breakout. That tells me whether today’s move is genuine structural expansion or simply a news-driven spike into resistance. If buyers successfully defend that level, my interpretation changes significantly; if they cannot, I would rather wait than chase. $LINKUSDT #ByXIMPACT
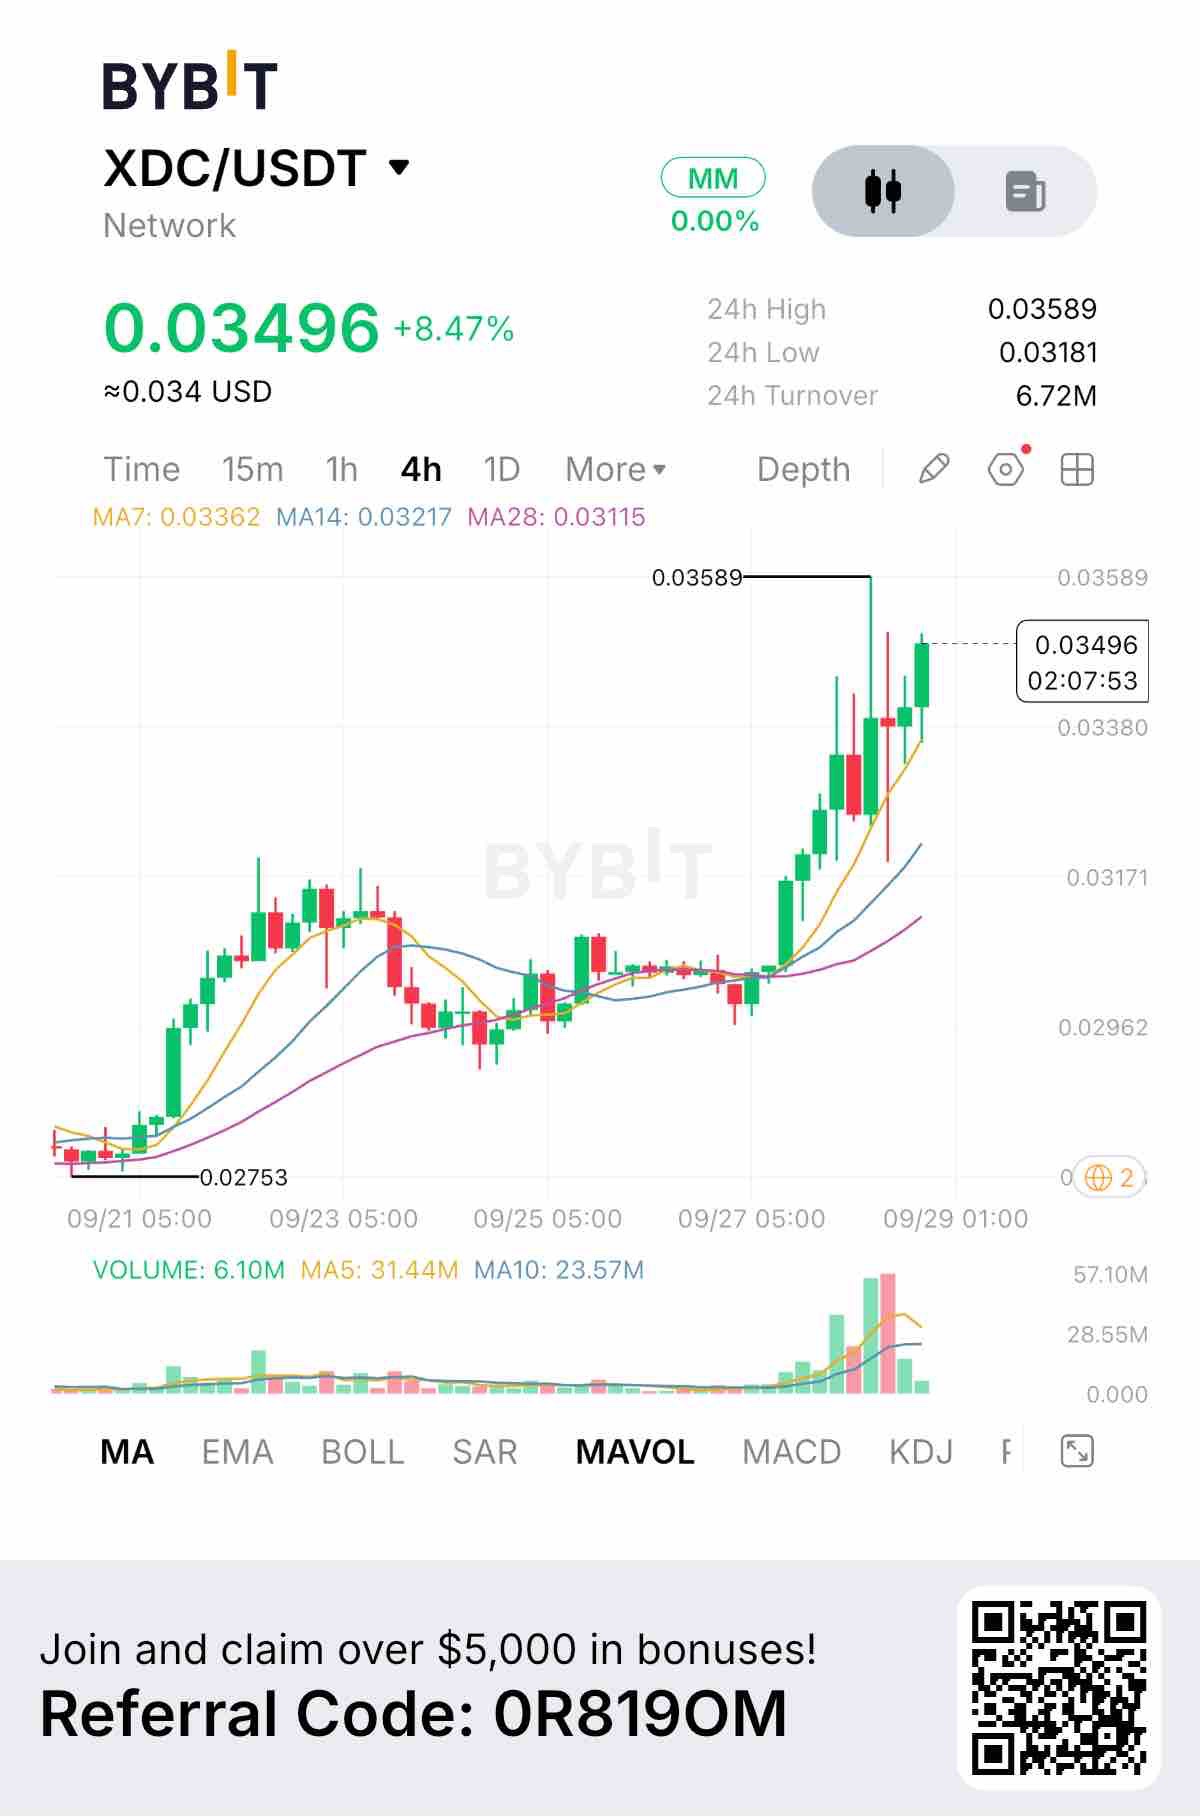
What changed on XDC is bigger than the 8.47% green candle on my chart: the move has now transitioned from a slow accumulation phase into a high-volume breakout attempt. On the uploaded 4H chart, XDC is trading around $0.03496, up 8.47%, with a visible 24H range of $0.03181–$0.03589 and turnover of about $6.72M. The important part is the sequence. Price spent several sessions moving sideways around the $0.0296–$0.0305 region, then suddenly expanded upward through the previous range. At the same time, volume accelerated sharply. That is the change I care about. The breakout also pushed price above all three moving averages shown on the chart: MA7 $0.03362, MA14 $0.03217 and MA28 $0.03115. More importantly, those averages are now stacked beneath price. I read that as a clear change in short-term structure rather than simply another green candle. The broader market data supports the activity visible on the screenshot. Bybit’s current XDC page reports XDC around $0.0334, with approximately $23.1M in 24H volume, a market cap around $665.9M, and a 24H high near $0.03562. Historical market data also shows the sharp acceleration: XDC closed around $0.02983 on September 27, compared with roughly $0.03042 on September 25. There is also a fundamental change happening behind the chart. XDC reported 27.7 million network transactions in July, its highest monthly transaction count at the time, representing roughly 50% growth over six months. Its validator ecosystem also surpassed 320 validators. Recent September developments have continued adding institutional infrastructure. DSRV joined as an institutional masternode validator, while XDC has also been expanding its AI-payment, stablecoin and tokenization narrative. In addition, BASIS.pro announced a partnership with XDC focused on the intersection of institutional yield infrastructure and real-world assets. I don’t think those developments automatically justify chasing the current candle. For me, the interesting question is whether this breakout can hold after the initial volume expansion. My read is therefore simple: the structure has improved, but I want confirmation rather than chasing $0.035+. The first level I’m watching is the previous breakout area around $0.0338–$0.0340. If that zone becomes support, the move has a better chance of developing into continuation. If XDC falls back through it and starts closing 4H candles below the moving-average cluster, I would become much more cautious. Bullish trigger: 4H close above $0.03589, followed by a successful retest. Entry: approximately $0.0345–$0.0350 after a confirmed breakout/retest. SL/invalidation: below $0.0330. TP1: $0.0375 TP2: $0.0400 TP3: $0.0430 Using an illustrative $0.0347 entry and $0.0330 invalidation, TP1 gives roughly 1.65R, TP2 around 3.1R, and TP3 around 4.9R, before fees and slippage. Bearish trigger: 4H breakdown below the $0.0318–$0.0330 support region after failing to hold the breakout. Invalidation: reclaiming and holding the $0.034–$0.035 area with renewed volume. The ONE signal I’m watching next is the reaction around $0.0338–$0.0340. If buyers defend that area after the breakout, my view becomes more constructive. If the breakout completely unwinds and price loses the moving-average structure, I would treat the recent volume spike very differently. $XDCUSDT #ByXIMPACT
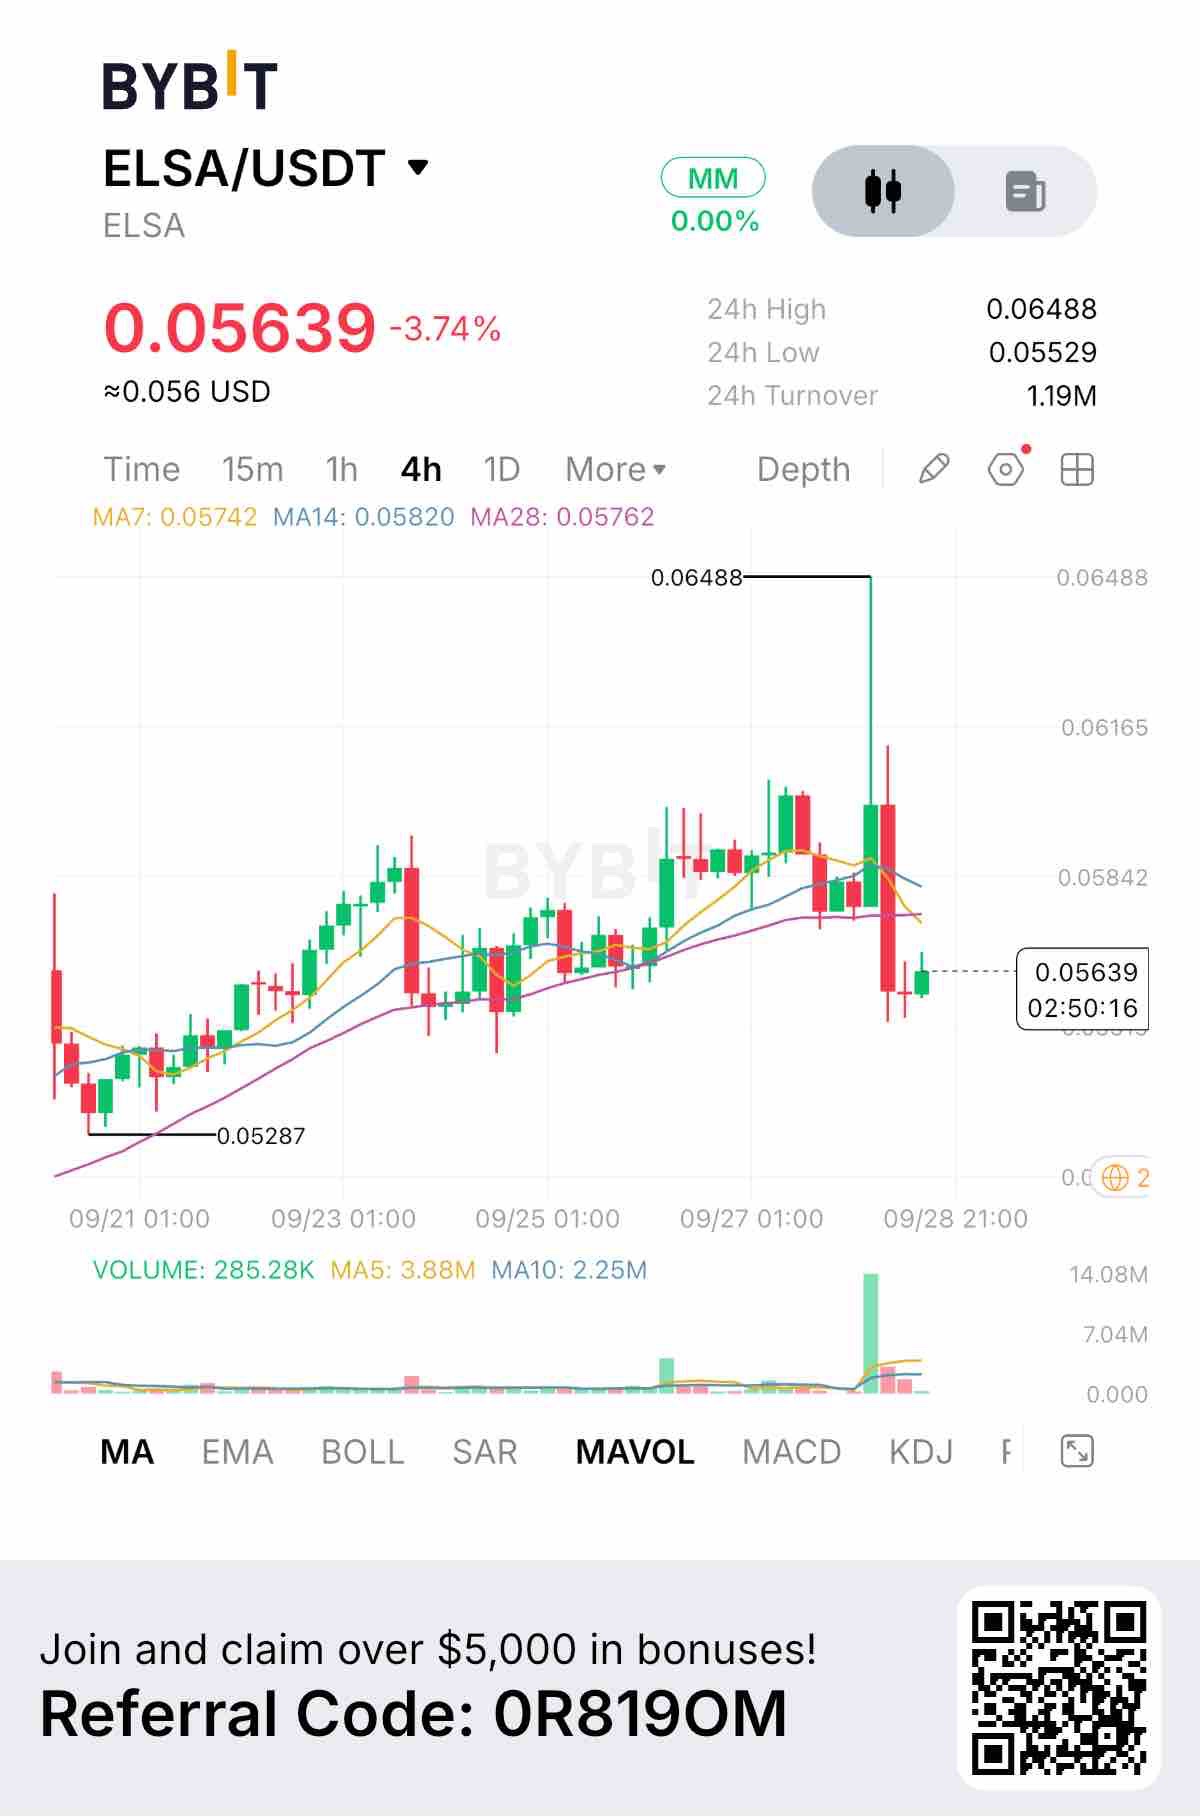
The move I’m paying attention to on ELSA is not the 3.74% red candle by itself. It is what happened immediately before it: price pushed all the way to 0.06488, printed a sharp rejection, and then dropped back toward 0.05639. That changes the short-term structure because the market has now shown that buyers were unable to hold the breakout area. On the uploaded 4H chart, ELSA is trading at 0.05639, while the visible 24H range is 0.05529–0.06488. The biggest clue is the enormous volume spike underneath the move into 0.06488. The screenshot shows current volume around 285K, while the MA5 volume is around 3.88M and MA10 around 2.25M. So the rejection happened alongside a much larger-than-normal burst of activity. That matters because a breakout that immediately gives back most of its move can represent a very different market condition from a clean continuation. I don’t want to automatically call it bearish, but I also don’t want to chase the price while it is sitting below the short-term moving averages. The current chart has price below MA7 at 0.05742, MA14 at 0.05820 and MA28 at 0.05762. That puts roughly 0.0574–0.0582 into an important reclaim zone. If ELSA can recover that area and start closing 4H candles above it, the recent rejection could become a liquidity sweep rather than a confirmed reversal. External market data also shows that ELSA has remained active recently. CoinGecko currently reports roughly $3.9M in 24H volume, around $13.5M market cap, and approximately 230M ELSA circulating against a 1B maximum supply. It also shows ELSA up about 8.4% over seven days, despite the sharp rejection visible on today’s chart. There is another supply factor I’m keeping in the background. Tokenomics.com lists the next scheduled unlock for October 20, 2026, involving approximately 6.668M ELSA, or 0.7% of total supply. That isn’t large enough by itself to determine the trade, but with a relatively small circulating market cap, I would pay attention to liquidity around future supply events. My read: the market just tested a much higher price and rejected it aggressively. Until ELSA reclaims the moving-average cluster, I consider the chart WAIT rather than blindly bullish. What I’m watching: the reaction around 0.05529–0.05820. This is where the next meaningful information should appear. Bullish trigger: 4H reclaim and hold above 0.05820, preferably with expanding volume. Entry: around 0.0582–0.0588 after confirmation. SL/invalidation: below 0.05529. TP1: 0.06165 TP2: 0.06488 TP3: above 0.06488, only if price breaks and holds the previous spike high. At an example entry of 0.0585 with a 0.05529 invalidation, TP1 around 0.06165 would offer roughly 1:1, while TP2 around 0.06488 would be roughly 2:1 before fees/slippage. Bearish trigger: a decisive 4H breakdown below 0.05529 followed by failure to reclaim it. Invalidation: reclaiming and holding back above the 0.0582 area. The ONE signal I’m watching next is whether ELSA can reclaim 0.05820 on a 4H closing basis. If buyers recover that level after such a violent rejection, my interpretation changes from “failed breakout” toward “liquidity sweep and potential continuation.” If price instead loses 0.05529, the failed breakout thesis becomes much more relevant. $ELSAUSDT #ByXIMPACT
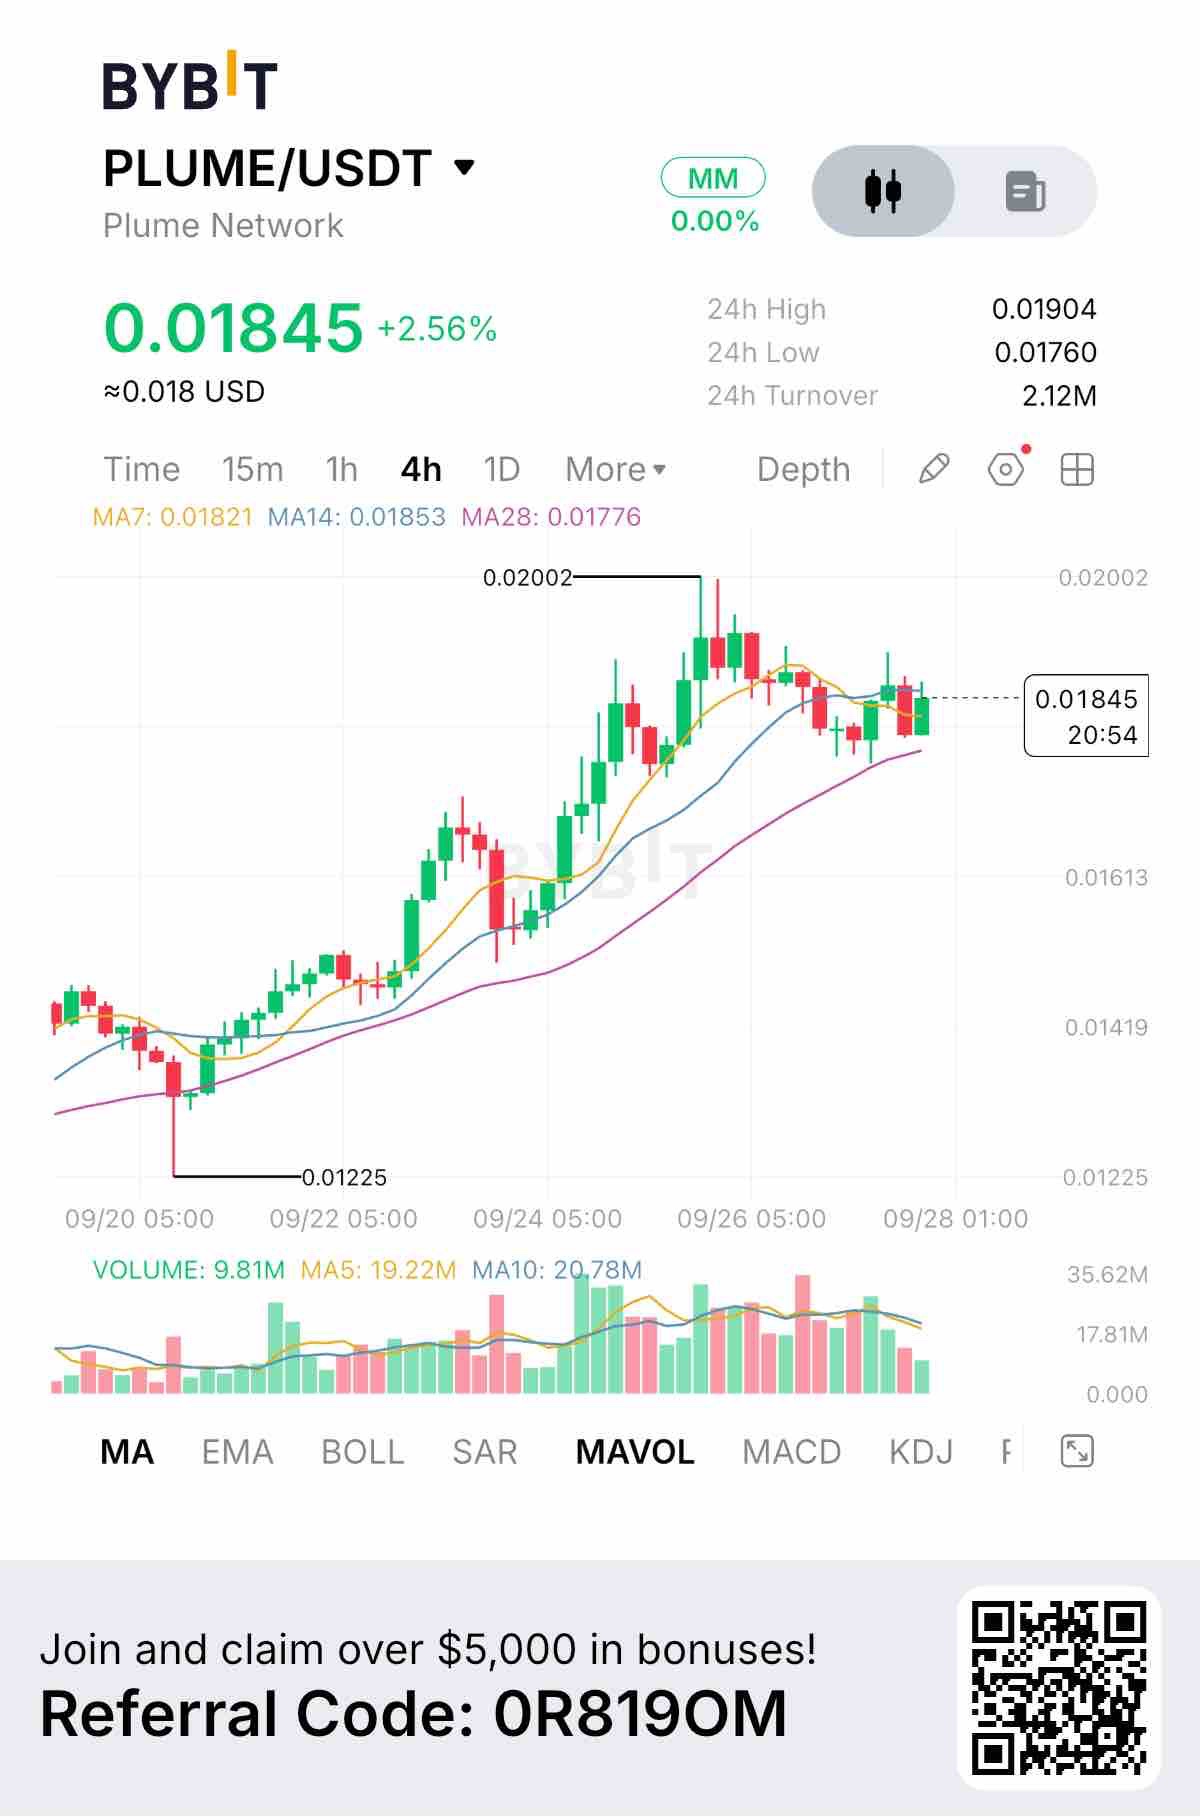
PLUME is showing a much different setup from the explosive breakout names. The move has already happened, but the interesting part is that price is now holding near the highs instead of immediately collapsing. On the 4H chart, PLUME is trading around $0.01845, up 2.56%, with a visible 24H range of $0.01760–$0.01904. The larger move started from the chart low around $0.01225, followed by a sustained sequence of higher highs and higher lows. Price eventually reached $0.02002, which is currently the key visible resistance. What stands out to me is the consolidation underneath that $0.02002 high. After the initial rally, candles have become smaller and price is rotating around the $0.018–$0.019 area. That suggests the market is currently digesting the previous expansion rather than producing another immediate vertical move. The moving averages are also still supporting the structure. MA7 is around $0.01821, MA14 around $0.01853, and MA28 around $0.01776. Price is sitting between the short-term averages but remains above MA28. So the trend hasn’t broken, but momentum has clearly cooled compared with the earlier part of the rally. Volume is another important detail. Current visible volume is around 9.81M, while MA5 is approximately 19.22M and MA10 around 20.78M. Volume has been declining during the latest consolidation. For me, that means the next meaningful move needs confirmation: a breakout without participation would be less convincing than a breakout accompanied by a fresh volume expansion. The level I’m watching most closely is $0.02002. A clean 4H breakout and close above that area, accompanied by increasing volume, would show that buyers are attempting to resume the larger trend. I would rather wait for that confirmation than chase PLUME while it is still trapped below resistance. On the downside, $0.01821 is the first short-term reference because it is close to MA7. Below that, $0.01776 is more important because it aligns with MA28 and sits near the recent consolidation support. A decisive 4H breakdown below that zone would weaken the current bullish structure and make a deeper retracement more likely. So my setup is simple: $0.02002 = breakout trigger, $0.01821 = first momentum support, $0.01776 = structural support. Until one of those boundaries breaks with meaningful volume, PLUME is essentially in a compression phase after a strong advance. I’m watching whether the next expansion comes out of the $0.018–$0.019 range or back into it after another rejection from $0.02002. That reaction should tell us much more than the current candle alone. $PLUMEUSDT #ByXIMPACT
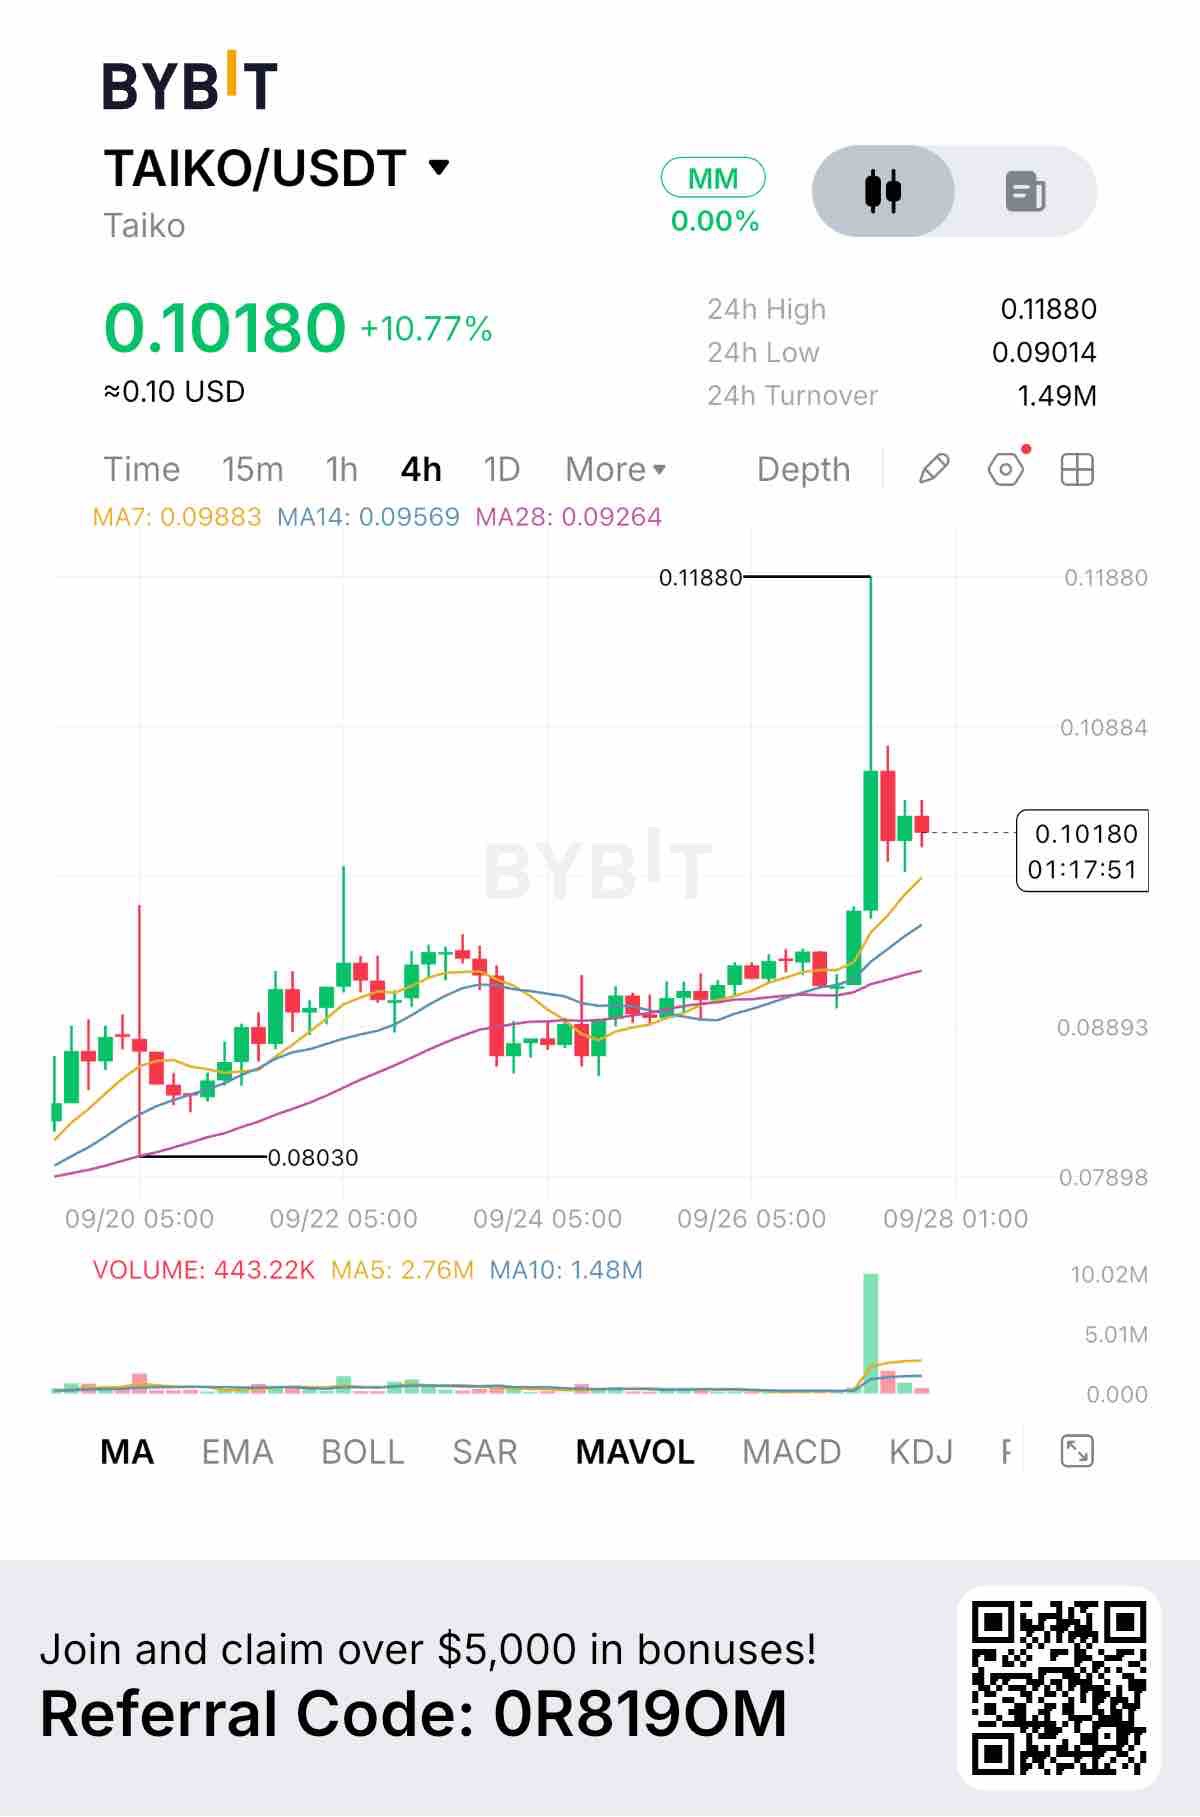
TAIKO has just shifted from a slow, controlled recovery into a sharp momentum expansion, and the important question now is whether buyers can defend the breakout after the first rejection from $0.11880. On the 4H chart, TAIKO is trading around $0.10180, up 10.77%, with a visible 24H range of $0.09014–$0.11880. Before the latest move, price had been gradually climbing from the $0.08030 low, building a sequence of higher lows while mostly staying below $0.10. The recent breakout changed that structure quickly, sending price from the $0.09 area toward $0.11880. The biggest evidence is the volume expansion. The latest visible volume reached around 443.22K, while MA5 is approximately 2.76M and MA10 around 1.48M. The largest breakout candle clearly produced a major volume spike compared with the preceding candles. Because the current candle is still developing, I would not treat its volume as final, but the breakout itself was accompanied by a clear increase in participation. Price is now pulling back from $0.11880 and trading around $0.10180. What interests me is that the pullback has not yet erased the entire breakout. The MA7 is around $0.09883, MA14 around $0.09569, and MA28 around $0.09264. Price remains above all three, which keeps the short-term structure constructive. My read is constructive, but I would not chase the vertical candle. The market has already moved more than 10% today and has rejected the first major extension at $0.11880. I want to see whether the $0.0988–$0.0957 area can become support before considering a continuation trade. For a bullish setup, my trigger would be a 4H close above $0.11880, preferably with renewed volume. I would then want a retest of that level rather than entering directly into the breakout candle. The visible chart does not provide enough established resistance above $0.11880 to responsibly create multiple precise targets, so I would reassess price discovery after confirmation rather than inventing levels. For the bearish scenario, the first warning would be a decisive loss of $0.09883, the MA7. A stronger breakdown below $0.09569 would weaken the current breakout structure and increase the probability of a deeper retracement toward the $0.09264 MA28 area. The original breakout base around $0.089 would become another important reference if selling pressure continues. I’m not treating the current $0.10180 price as an automatic entry. The move from roughly $0.09 to $0.11880 happened very quickly, so the cleaner opportunity may come from either a successful retest or a fresh breakout after consolidation. Right now, I want the market to prove that the breakout can survive profit-taking. The ONE signal I’m watching next is whether TAIKO holds the $0.0988–$0.0957 zone and then returns toward $0.11880 with increasing volume. Holding that area would support the idea that the breakout is being absorbed rather than reversed. Losing it would change my view toward waiting for a new structure. $TAIKOUSDT #ByXIMPACT