Abdullahi
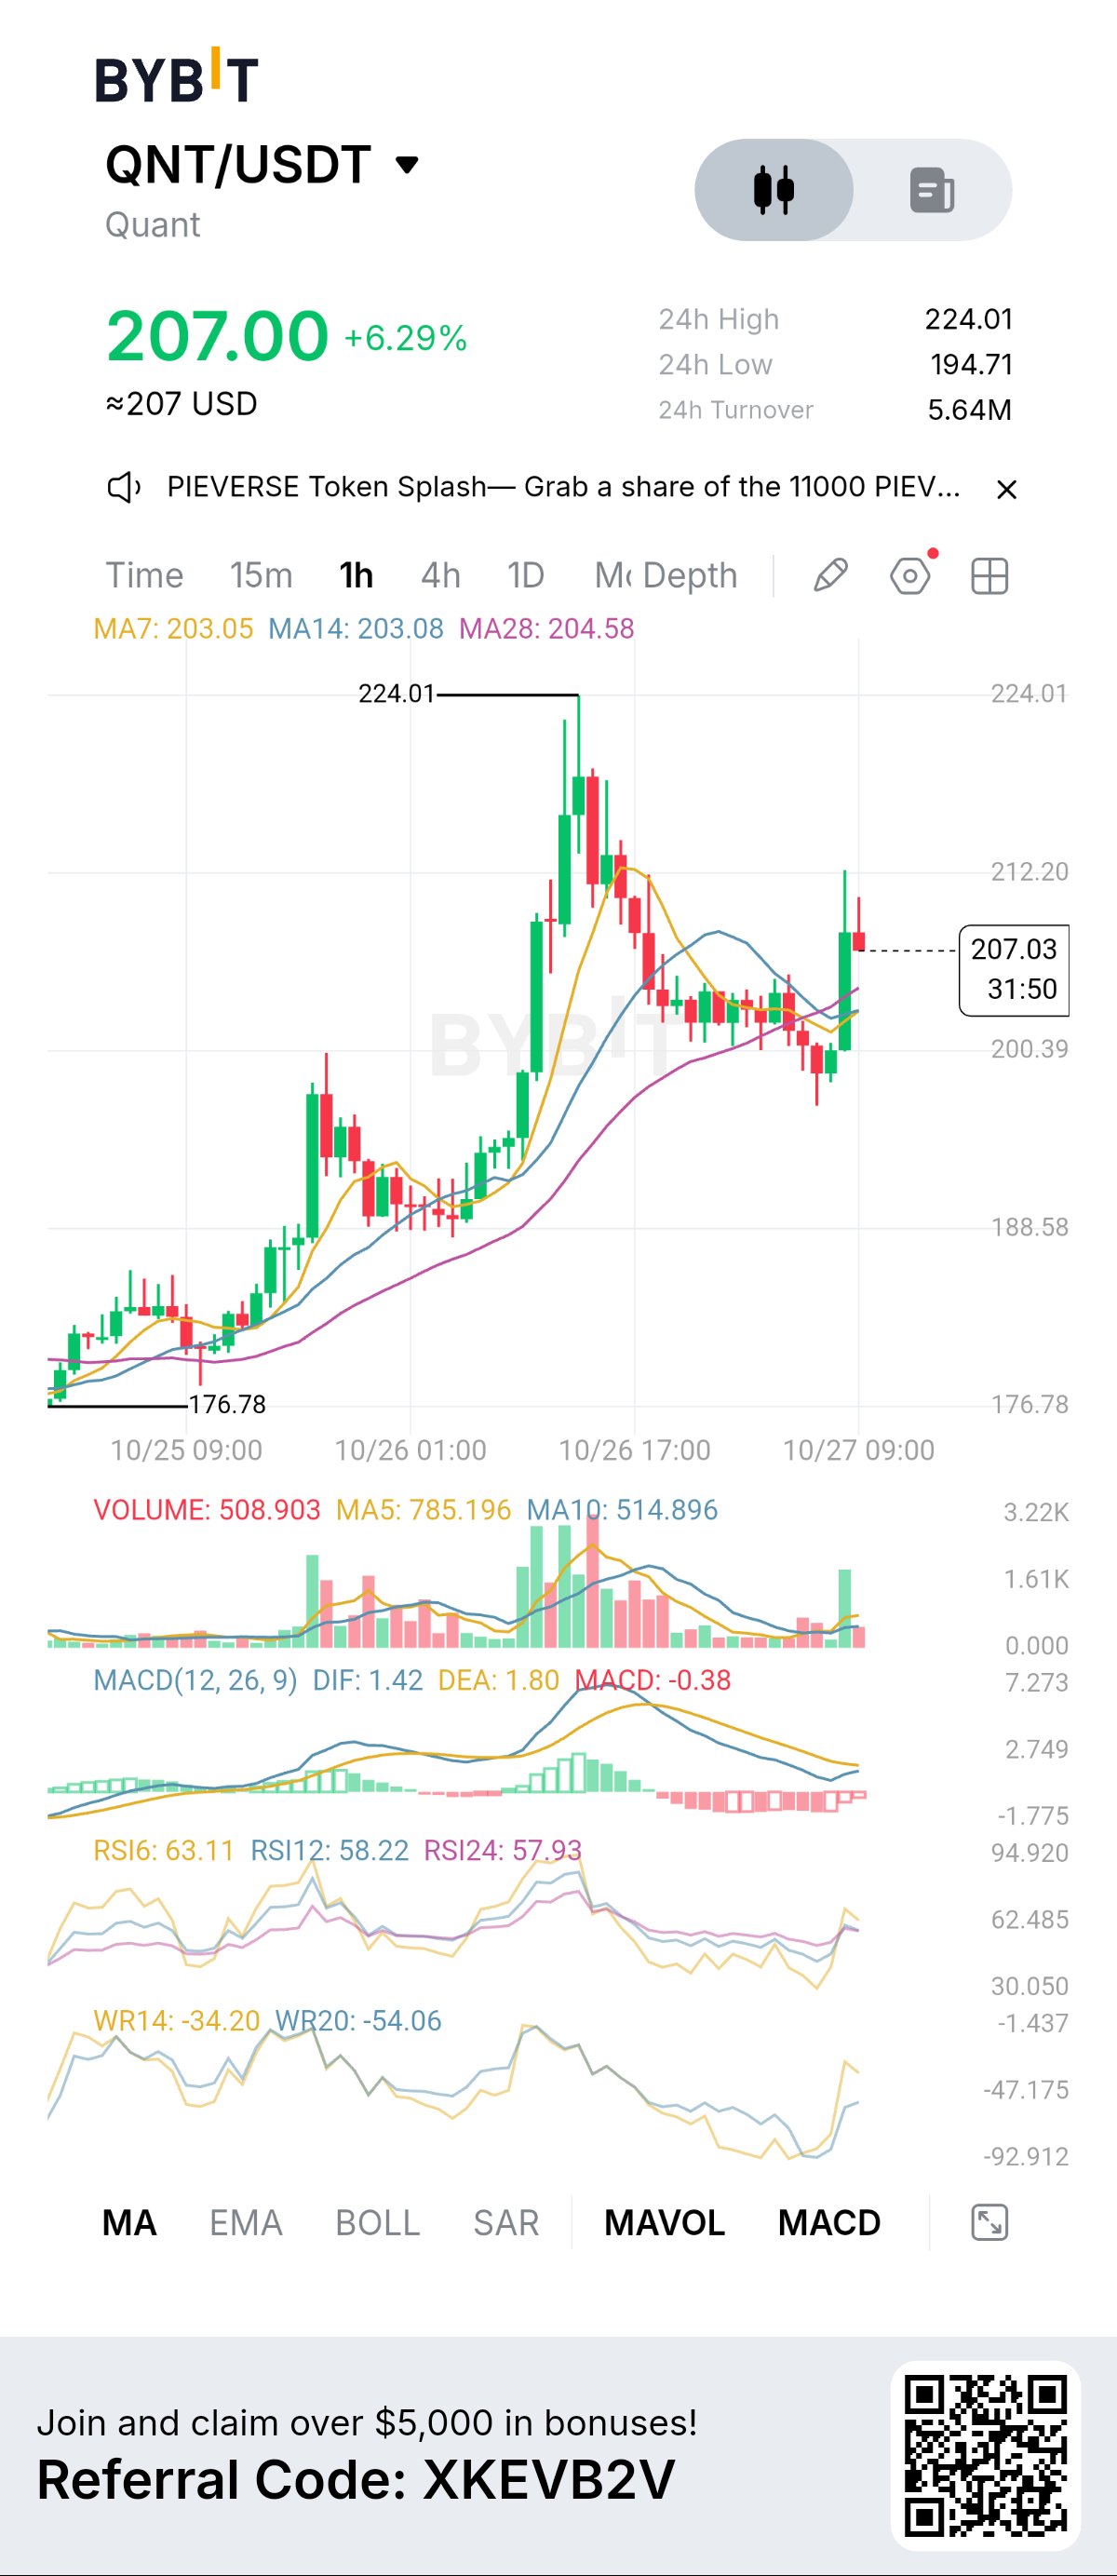
🚨 QUANT (QNT) SURGES 6.29%! 🚀 IS A BIGGER BREAKOUT COMING? 🔥 $QNTUSDT is making a strong move, trading around $207.00 after climbing sharply from its recent lows. Buyers have stepped in following a pullback from $224.01, and traders are watching to see whether QNT can regain its upward momentum. 💰 QNT MARKET UPDATE 🔹 Current Price: $207.00 🔹 24H Change: +6.29% 🔹 24H High: $224.01 🔹 24H Low: $194.71 🔹 Trading Pair: QNT/USDT 🔹 Timeframe: 1 Hour 📊 KEY LEVELS TO WATCH 🚀 Resistance: $212.20 🎯 Major Resistance: $224.01 🛡️ Support: $203.00–$200.39 ⚠️ Lower Support: $194.71 📈 TECHNICAL ANALYSIS 🟢 RSI: The RSI6 is around 63, showing positive short-term momentum, although further confirmation is needed. 🟡 MACD: The MACD remains below its signal line, suggesting the earlier bearish momentum has not fully disappeared. 🟢 Moving Averages: QNT is trading near $207, above the MA7, MA14, and MA28 levels shown on the chart. This is an encouraging short-term signal for buyers. 🔥 WHAT COULD HAPPEN NEXT? 🚀 Bullish Scenario: A sustained move above $212.20 could open the way toward a retest of $224.01. 📉 Bearish Scenario: If QNT falls below $203 and loses the $200.39 support zone, the price could weaken toward $194.71. 👀 FINAL OUTLOOK QNT is showing encouraging short-term strength after its recent pullback. However, traders should watch the $212 resistance closely and look for stronger volume before assuming another major rally is underway. 💬 YOUR PREDICTION: WHERE IS QNT HEADING NEXT? 🚀 $224 — Bulls take control! 📉 $200 — A deeper pullback? 🔥 $230 — A new breakout target? Share your prediction in the comments! This analysis is based on the supplied chart and is for educational purposes only, not financial advice. Always manage your risk. #ByXIMPACT
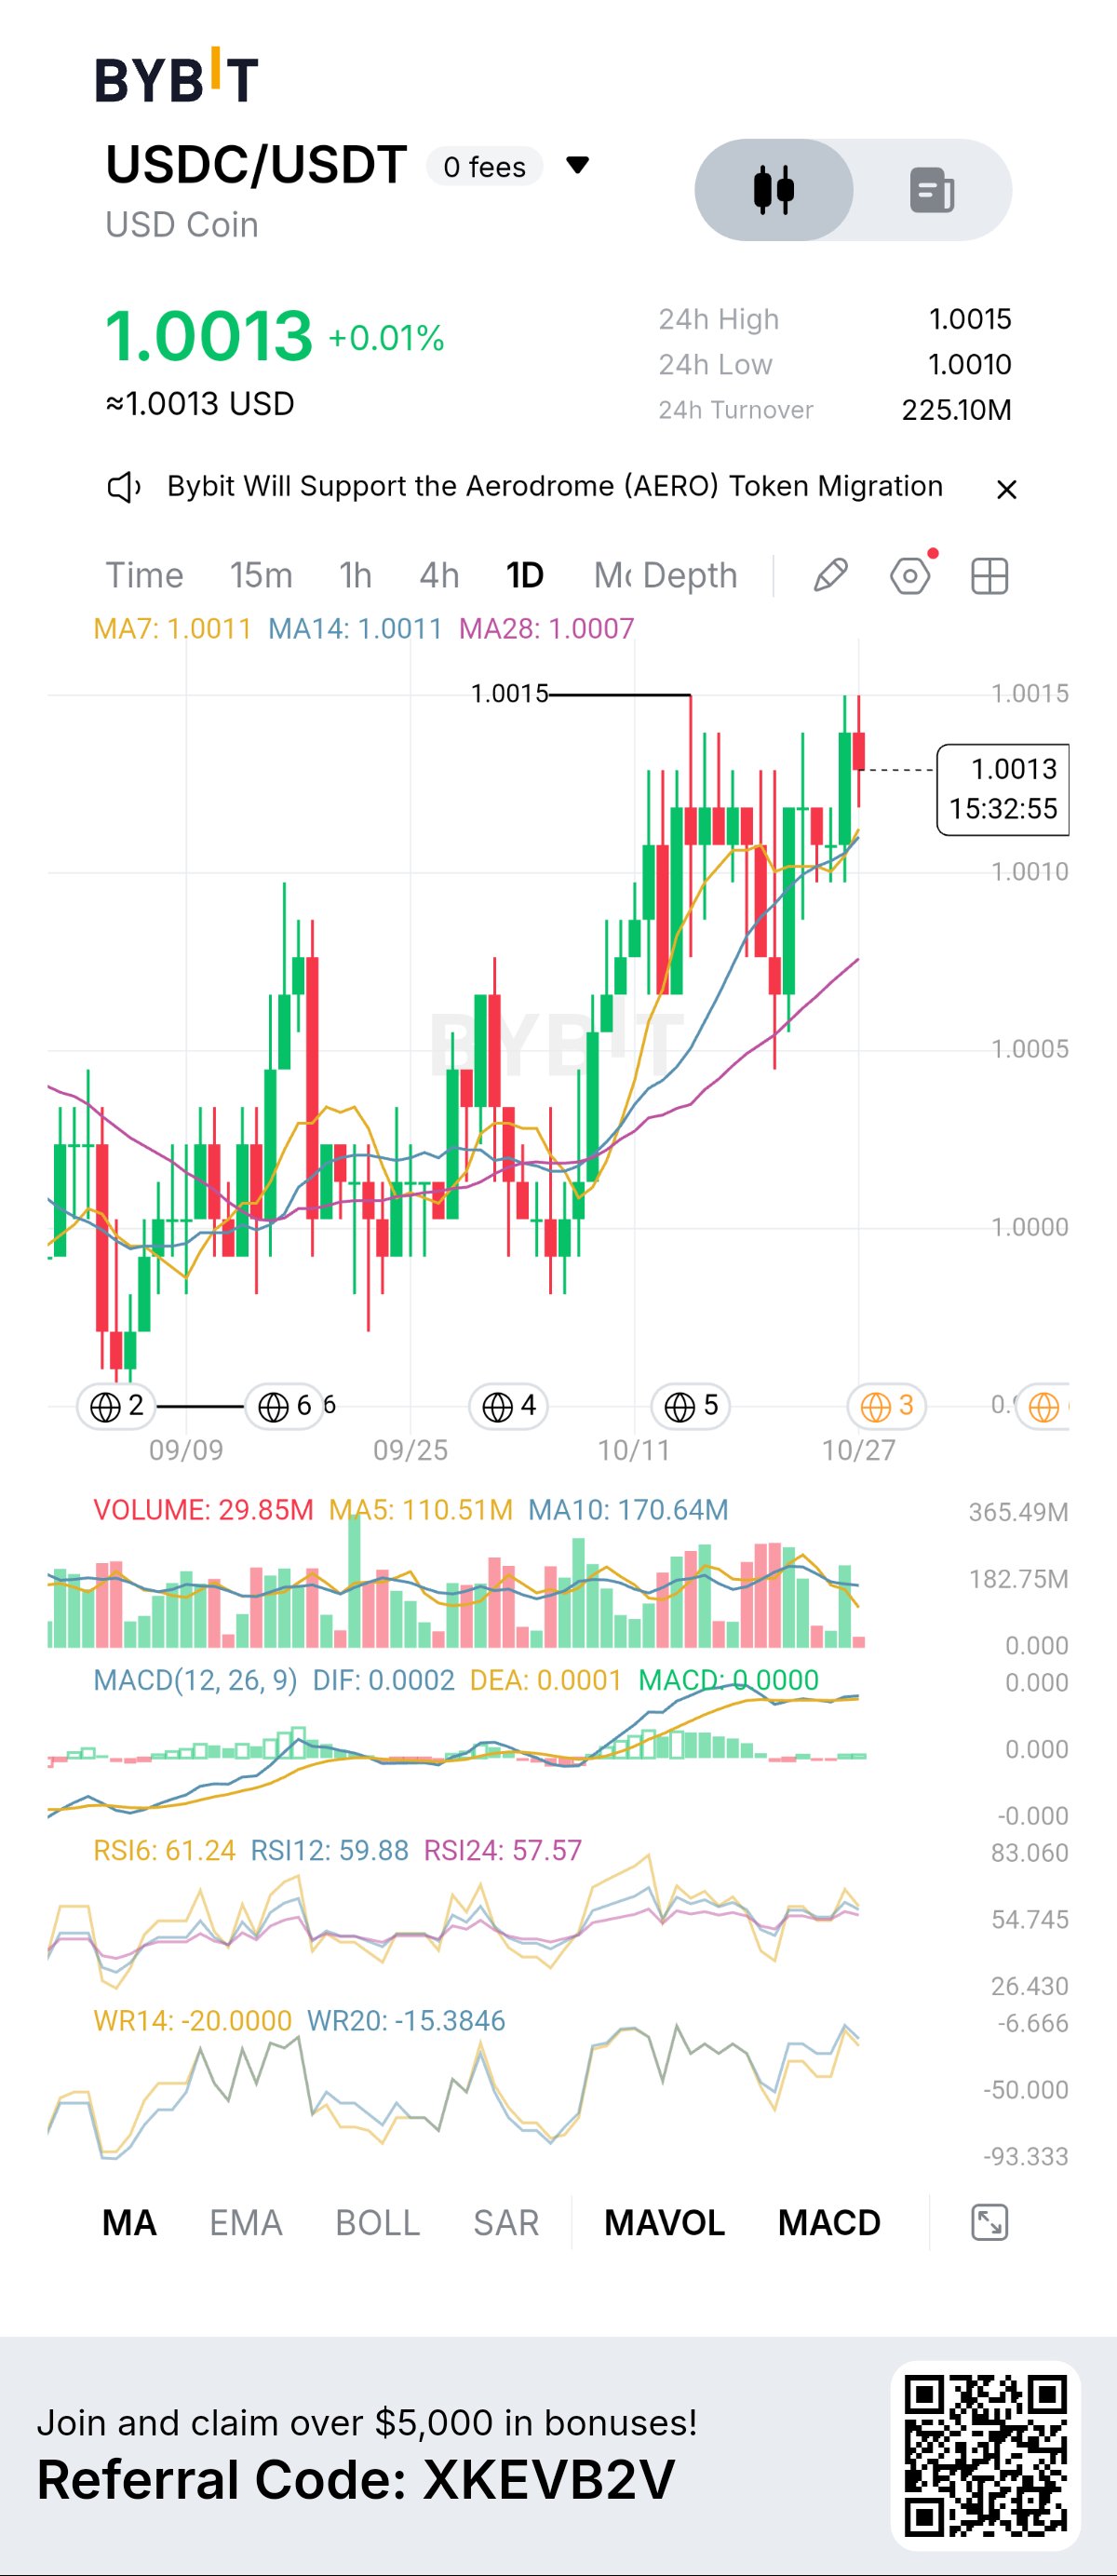
🚨 USDC PRICE ALERT: USD COIN HOLDS ABOVE $1.00 AS BUYING MOMENTUM STRENGTHENS! 📈🔥 $USDCUSDT is trading at $1.0013, maintaining its dollar peg while the latest daily chart shows positive momentum. Traders are watching closely as the price approaches the recent high of $1.0015. 💰 USDC MARKET UPDATE 🔹 Current Price: $1.0013 🔹 24H Change: +0.01% 🔹 24H High: $1.0015 🔹 24H Low: $1.0010 🔹 Trading Pair: USDC/USDT 🔹 Timeframe: 1 Day 📊 TECHNICAL ANALYSIS 🟢 Moving Averages: The price is above the MA7, MA14, and MA28, indicating positive short-term chart momentum. 🟢 RSI: Readings between 57 and 61 show relatively strong momentum without an extreme overbought signal on these indicators. 🟡 MACD: The indicator is near zero, suggesting limited momentum and the possibility of consolidation. 🎯 KEY LEVELS TO WATCH 🚀 Resistance: $1.0015 🛡️ Support: $1.0010 📍 Main Psychological Level: $1.0000 🔥 WHAT COULD HAPPEN NEXT? If buying pressure continues, USDC could test the $1.0015 high again. If momentum weakens, the price may retreat toward $1.0010. However, USDC is a stablecoin designed to track the US dollar, so small price movements against USDT do not necessarily indicate a major bullish breakout. Maintaining the peg is more important than price appreciation. 💎 FINAL THOUGHTS USDC remains close to $1.00, with the chart showing modest positive momentum. Traders should watch for price stability, liquidity, and any deviation from its intended dollar peg. 💬 What do you think? Will USDC remain stable around $1.00, or could volatility increase? Share your thoughts below! Market analysis based on the supplied chart. This is for educational purposes only, not financial advice. #ByXIMPACT
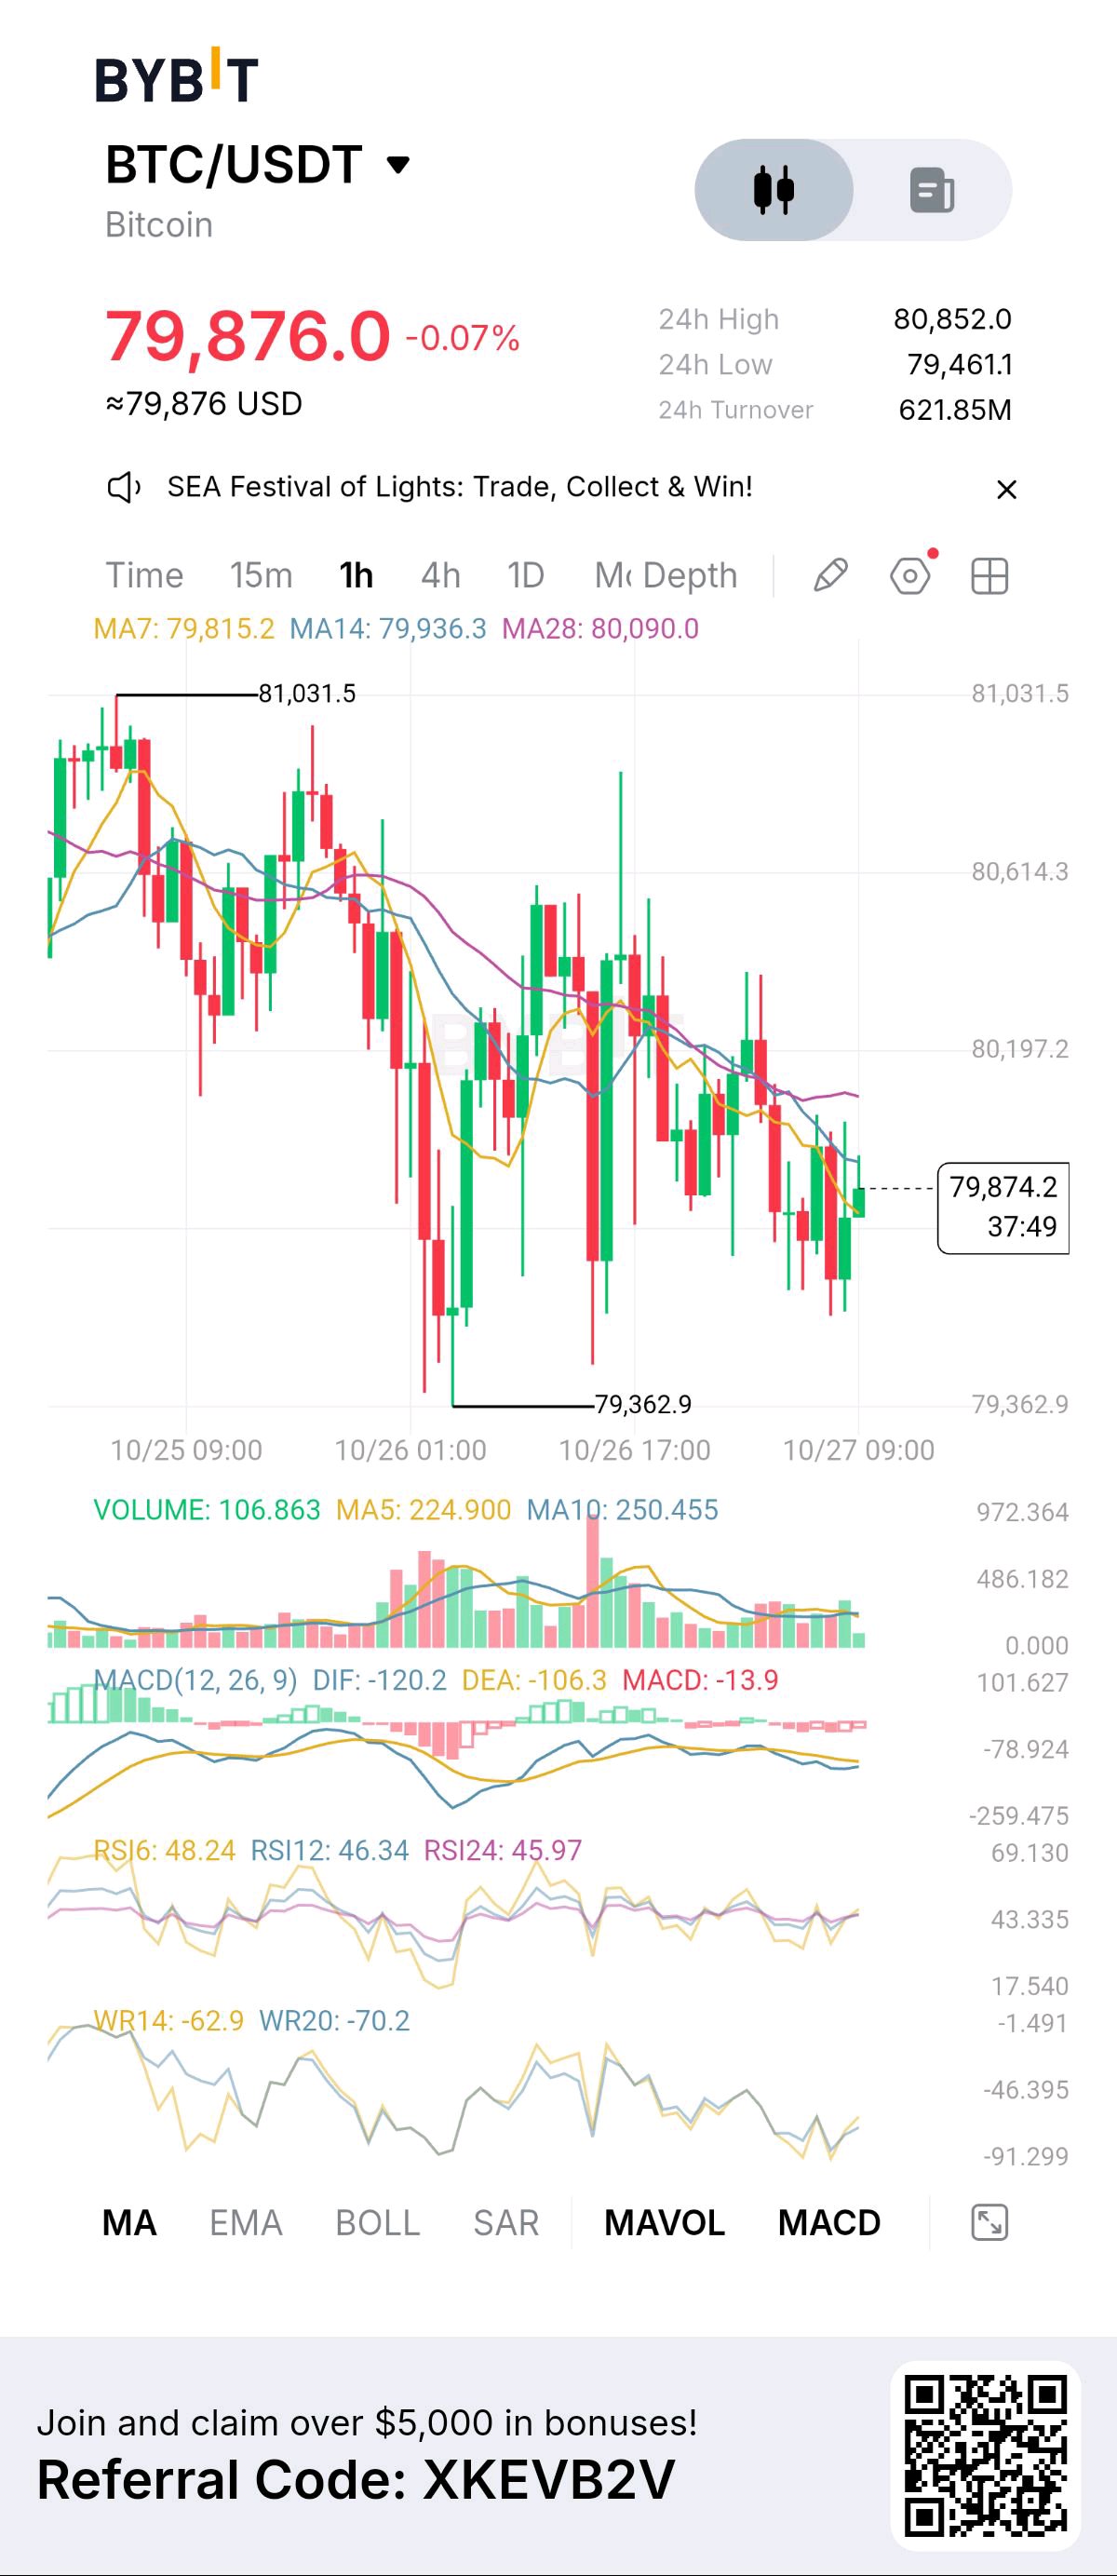
🚨 BITCOIN PRICE ALERT: BTC AT $79,876 — WILL THE BULLS RECLAIM $80,000? 🔥📈 $BTCUSDT is approaching a crucial turning point! BTC is trading around $79,876 after pulling back from its recent high near $81,031. Buyers are attempting to stabilize the price, but bearish momentum remains a concern. 💰 BITCOIN MARKET UPDATE 🔹 Current Price: $79,876 🔹 24H High: $80,852 🔹 24H Low: $79,461 📊 KEY LEVELS TO WATCH 🚀 Resistance: $80,000–$80,197 🎯 Higher Targets: $80,614–$80,852 🛡️ Support: $79,461 ⚠️ Lower Support: $79,363 📉 TECHNICAL ANALYSIS The RSI is below 50, suggesting relatively weak momentum. The MACD remains bearish, while BTC trades below its MA14 and MA28. However, the price is slightly above the MA7, indicating a possible short-term recovery attempt. 🔥 WHAT HAPPENS NEXT? 🟢 Bullish Scenario: A strong breakout above $80,197 could open the door toward $80,600 and potentially $80,850. 🔴 Bearish Scenario: If BTC breaks below $79,461, sellers could push the price toward the recent low near $79,363. 🟡 Sideways Scenario: If neither side takes control, Bitcoin may continue consolidating between support and resistance. 💎 FINAL THOUGHTS Bitcoin is at a critical decision point. Bulls need to reclaim resistance to strengthen the recovery, while bears will be watching for a breakdown below support. The next confirmed move could provide a clearer picture of BTC's short-term direction. Watch price action and trading volume before making a decision. 🔥 BITCOIN COMMUNITY, WHAT'S YOUR PREDICTION? 🚀 $80,600 — Bullish breakout 📉 $79,300 — Bearish continuation 👀 $80,000 — Sideways consolidation Drop your prediction in the comments! Technical analysis based on the supplied chart. This is not financial advice; cryptocurrency trading involves significant risk. #ByXIMPACT
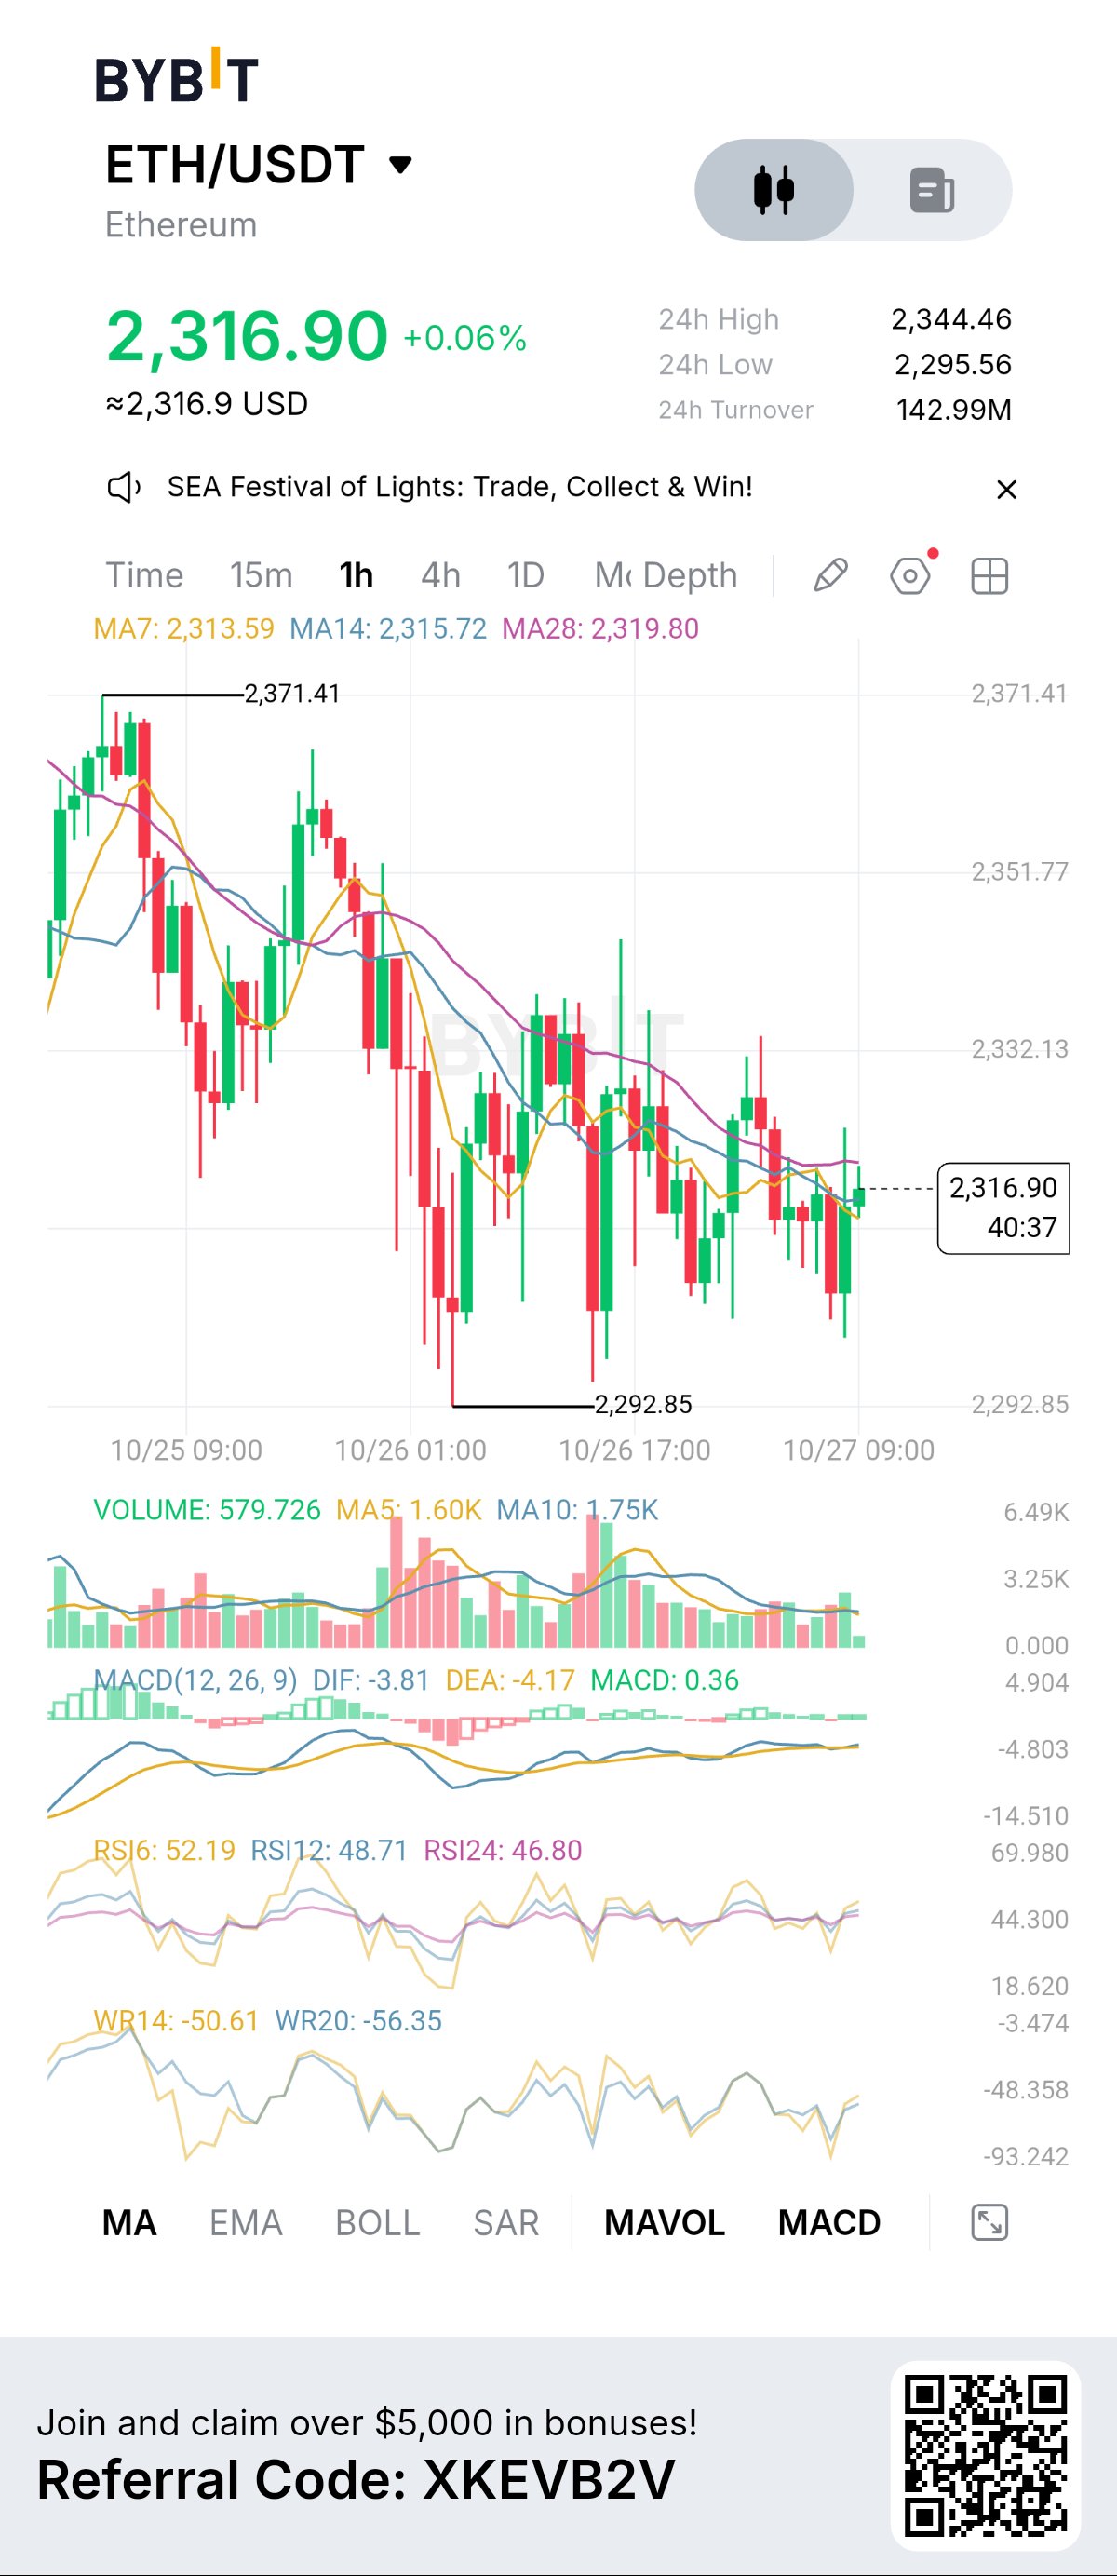
🚨 ETHEREUM ALERT: ETH IS SHOWING SIGNS OF RECOVERY! 🚀🔥 WILL THE NEXT BIG MOVE BE UPWARD? $ETHUSDT is approaching a critical moment, and traders are watching closely! 👀📊 After experiencing selling pressure from higher levels, ETH is now attempting to stabilize around $2,316. The big question is whether buyers can regain control and push the price toward the next resistance zone. 💰 ETHEREUM MARKET UPDATE 🔹 Current Price: $2,316.90 🔹 24-Hour Change: +0.06% 🔹 24-Hour High: $2,344.46 🔹 24-Hour Low: $2,295.56 🔹 Trading Pair: ETH/USDT 🔹 Chart Timeframe: 1 Hour 📊 1. THE BATTLE BETWEEN BULLS AND BEARS Ethereum has experienced a noticeable decline from its recent high near $2,371.41, eventually reaching a low around $2,292.85. Since then, the price has been moving sideways as buyers and sellers battle for control. The current price action suggests that the market is searching for direction. Buyers are attempting to establish a stronger foundation, but they still need to overcome nearby resistance before a convincing bullish reversal can be confirmed. 🚀 2. CAN ETH BREAK ABOVE $2,332? The $2,320–$2,332 area is an important short-term resistance zone to monitor. If Ethereum breaks above this area with strong buying volume, bullish momentum could strengthen and open the door to a potential retest of $2,344. A sustained move above $2,344 would be another encouraging sign for buyers. However, if ETH fails to break through resistance, the price could remain trapped in a sideways range. 🛡️ 3. SUPPORT LEVELS THAT MATTER The $2,295–$2,293 zone is a key support area based on the recent chart low. If buyers defend this region, Ethereum could attempt another recovery toward $2,320 and beyond. But if the support zone breaks decisively, bearish pressure could increase, potentially sending ETH toward lower levels. Remember: support levels can fail, especially when selling volume increases. 📈 4. WHAT THE TECHNICAL INDICATORS SAY 🟢 RSI: The 6-period RSI is around 52.19, indicating slightly positive short-term momentum. The longer RSI readings remain closer to neutral, so the overall bullish signal is not especially strong. 🟢 MACD: The histogram is slightly positive, suggesting that bearish momentum may be easing. However, this alone does not confirm a trend reversal. 🟡 Moving Averages: ETH is trading above the MA7 near $2,313.59 and MA14 near $2,315.72, but below the MA28 near $2,319.80. This points to a short-term recovery attempt within a broader period of weakness. 🟡 Trading Volume: Recent volume appears relatively subdued compared with some earlier candles. A breakout accompanied by stronger volume would provide more convincing evidence of a directional move. 🔥 5. THREE POSSIBLE SCENARIOS FOR ETHEREUM 🚀 BULLISH SCENARIO: If ETH breaks above $2,332 and attracts stronger buying interest, the next area to watch is $2,344. A sustained breakout could improve the short-term outlook. 📉 BEARISH SCENARIO: If ETH loses $2,295 and selling pressure accelerates, traders may watch the recent low near $2,293 for the next reaction. 👀 SIDEWAYS SCENARIO: If neither buyers nor sellers gain control, ETH could continue consolidating between support and resistance until a stronger catalyst appears. 💎 MY FINAL THOUGHTS Ethereum is at a decision point. The recent chart shows an attempt to stabilize after a decline, with short-term momentum displaying some signs of improvement. But traders should not confuse a small recovery with a confirmed bullish breakout. The most important things to watch are the $2,332 resistance, the $2,344 high, the $2,295 support, and whether trading volume increases as price approaches these levels. The market could move in either direction, so patience and risk management remain essential. 🔥 ETHEREUM HOLDERS, IT'S TIME TO WATCH THE CHART! Do you believe ETH will reclaim $2,350, or will sellers push the price back toward $2,290? 🟢 BULLISH — ETH TO $2,350 🔴 BEARISH — ETH TO $2,290 🟡 NEUTRAL — WAITING FOR A BREAKOUT Drop your prediction in the comments and share your market outlook! Technical analysis is for educational purposes only and is not financial advice. Cryptocurrency prices are volatile, and all scenarios are conditional, not guaranteed. #ByXIMPACT
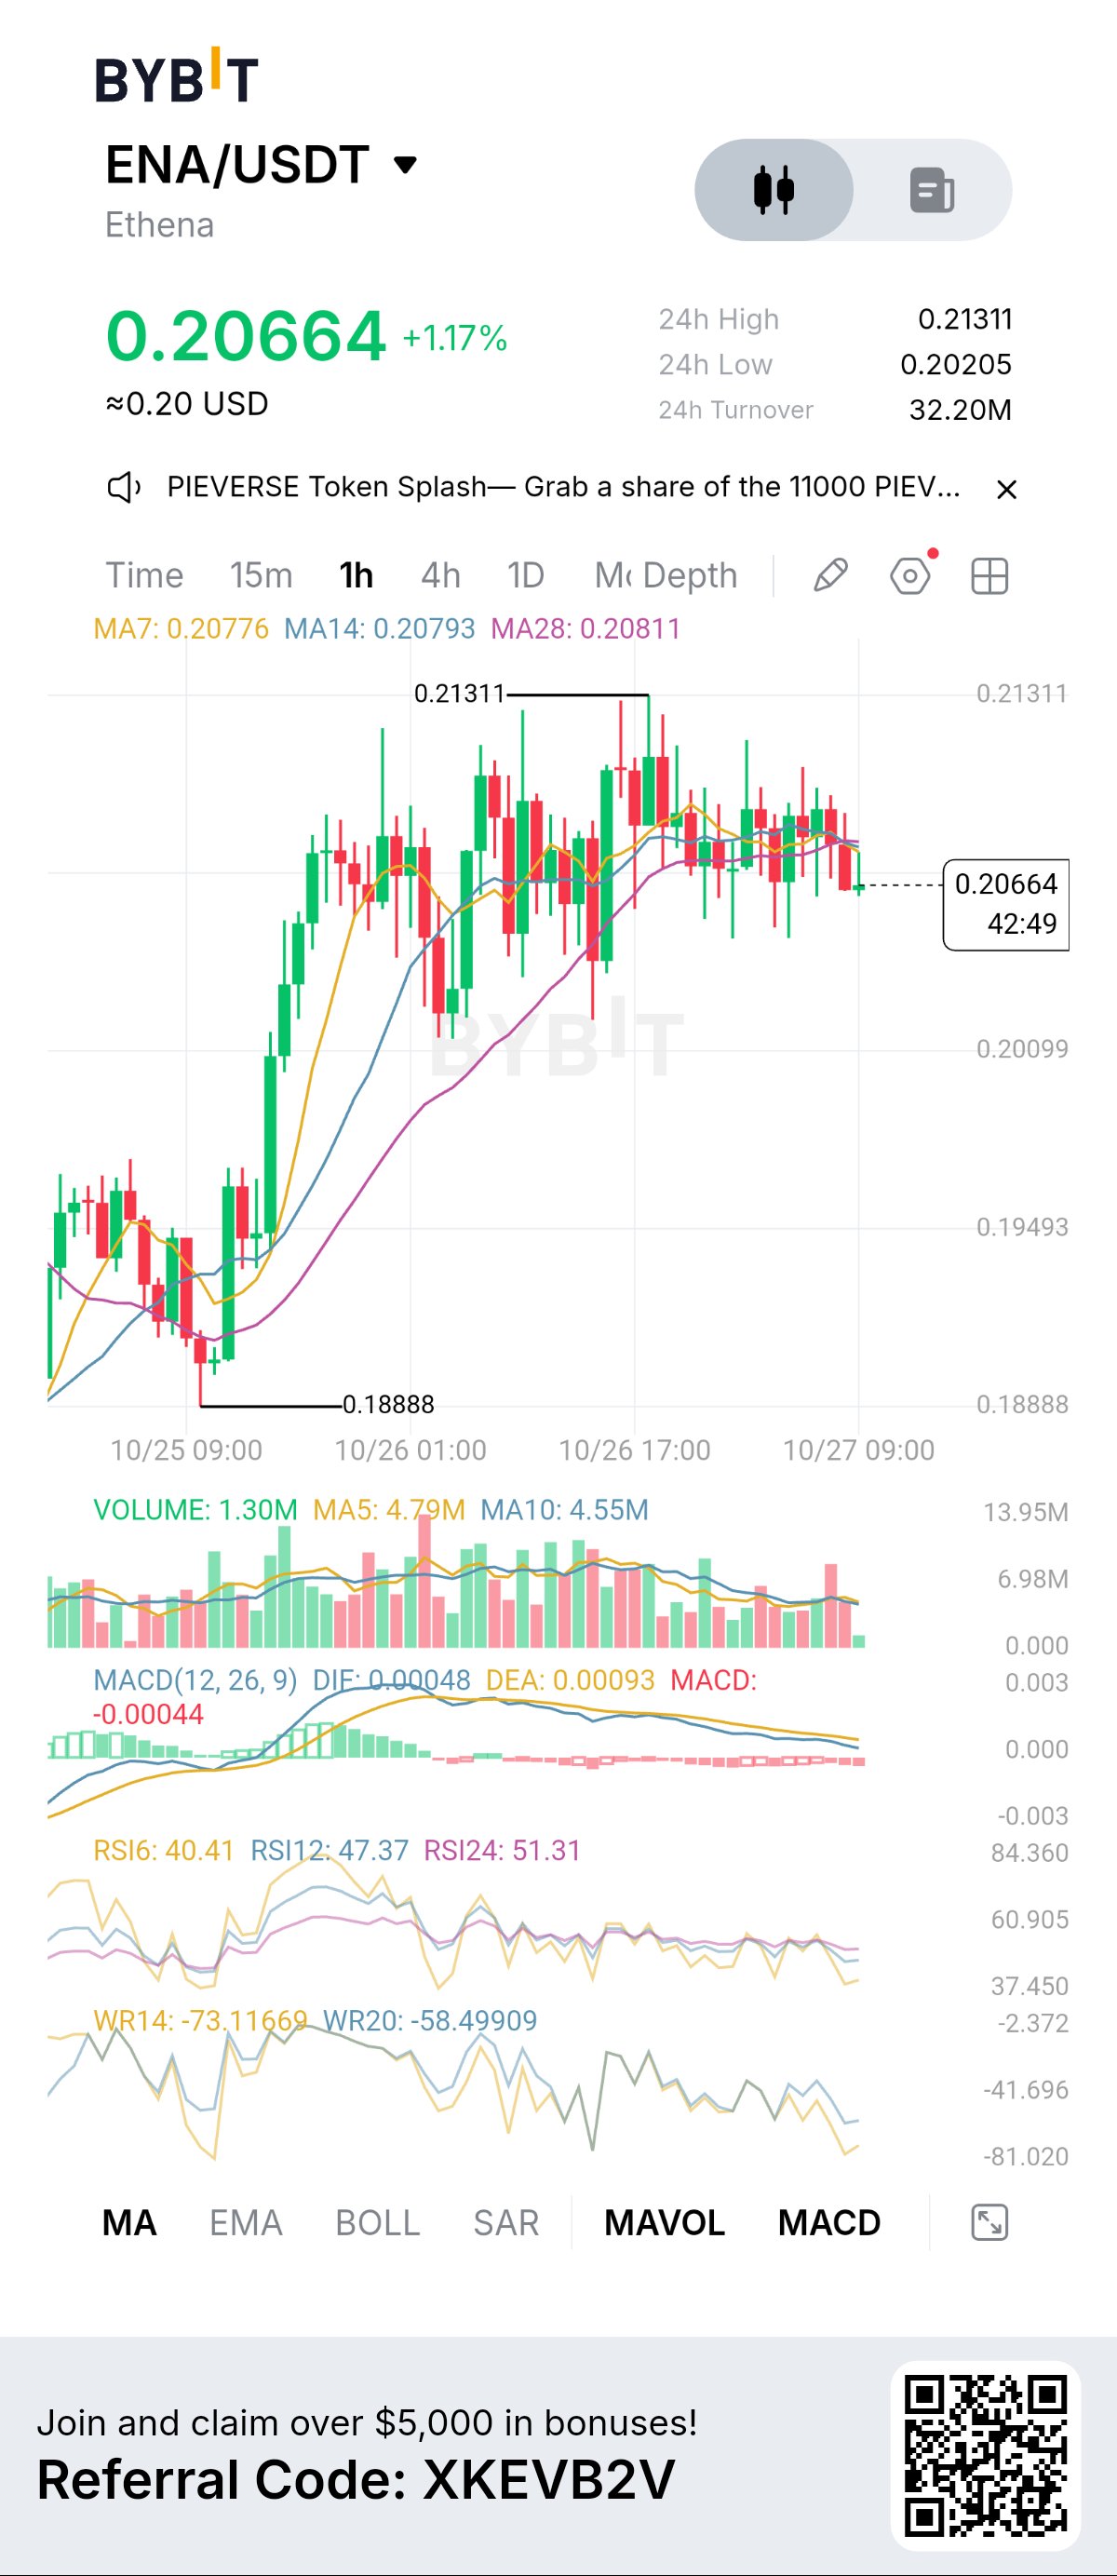
🚨🔥 ENA/USDT: BULLS ARE FIGHTING TO HOLD THE LINE! 🚀💎 👀 Attention, crypto traders! Something interesting is happening with ENA, and this chart deserves a closer look. $ENAUSDT is currently trading around $0.20664, up approximately 1.17%, according to the screenshot. After a strong upward move from the $0.18888 region, the price has entered a consolidation phase, moving sideways around the $0.206–$0.210 area. Now the big question is: Is ENA preparing for another breakout, or are buyers losing momentum? 🤔📊 🔥 LET'S BREAK DOWN THE CHART! 📈 1. The Bulls Have Already Made a Move ENA previously climbed strongly from approximately $0.18888 toward the $0.21311 high. This shows that buyers were able to push the price significantly higher during the period shown. However, the price is now moving sideways, suggesting that the market is searching for its next direction. A sustained move above resistance could attract renewed attention, but confirmation is important. 🎯 2. Important Resistance Levels 🚧 $0.2090–$0.2100: The first zone to watch for a possible recovery. 🔥 $0.21311: The recent high and the key breakout level shown on the chart. If ENA breaks above $0.21311 with strong buying volume, traders may start watching for further upside. However, a temporary move above resistance does not guarantee a sustained rally. 🛡️ 3. Support Levels to Watch The market also has important support areas to monitor. ✅ $0.2050: A nearby level to watch for signs of price stability. ✅ $0.20099: An important chart level below the current price. ⚠️ $0.19493: A lower level to monitor if selling pressure increases. If buyers defend support, ENA could attempt another recovery. If support breaks, the price could move lower. 📊 4. What Are the Indicators Saying? The moving averages are clustered close to the current price, reflecting the recent sideways movement. The MACD is slightly negative in the screenshot, suggesting that short-term momentum has weakened following the earlier upward move. The RSI readings are mixed, with the shorter-period RSI showing weaker momentum than the longer-period reading. This means traders should watch for a clear change in momentum rather than assume that another rally is guaranteed. 💥 5. The Two Scenarios to Watch 🟢 BULLISH SCENARIO If ENA holds its nearby support, buying pressure returns, and the price breaks above $0.2100, the next major challenge could be $0.21311. A confirmed breakout above the recent high could put higher levels on traders' watchlists. 🔴 BEARISH SCENARIO If ENA fails to recover and breaks below the $0.2050 area, traders may watch $0.20099 for the next potential support. Further weakness could bring the lower $0.19493 region into focus. These are possible scenarios, not guaranteed outcomes. 👀 MY MAIN FOCUS RIGHT NOW The key is to watch how ENA behaves around support and resistance. Will buyers return and push the price toward the recent high? Or will sellers take advantage of the slowing momentum and force another pullback? The next move needs confirmation from price action and trading volume. 🚀 NOW IT'S YOUR TURN! If you are watching ENA/USDT, where do you think the price is heading next? 💎 $0.220 🔥 $0.250 🚀 $0.300 Or do you expect another dip before the next upward move? 💬 Drop your price prediction in the comments and explain why you think ENA will move in that direction! Let's see how the community reads this chart. ⚠️ DISCLAIMER: This post is for educational and informational purposes only, not financial advice. The analysis is based on the supplied screenshot, not live market data. Cryptocurrency prices are volatile, so always do your own research and manage your risk before making a trading decision. #ByXIMPACT
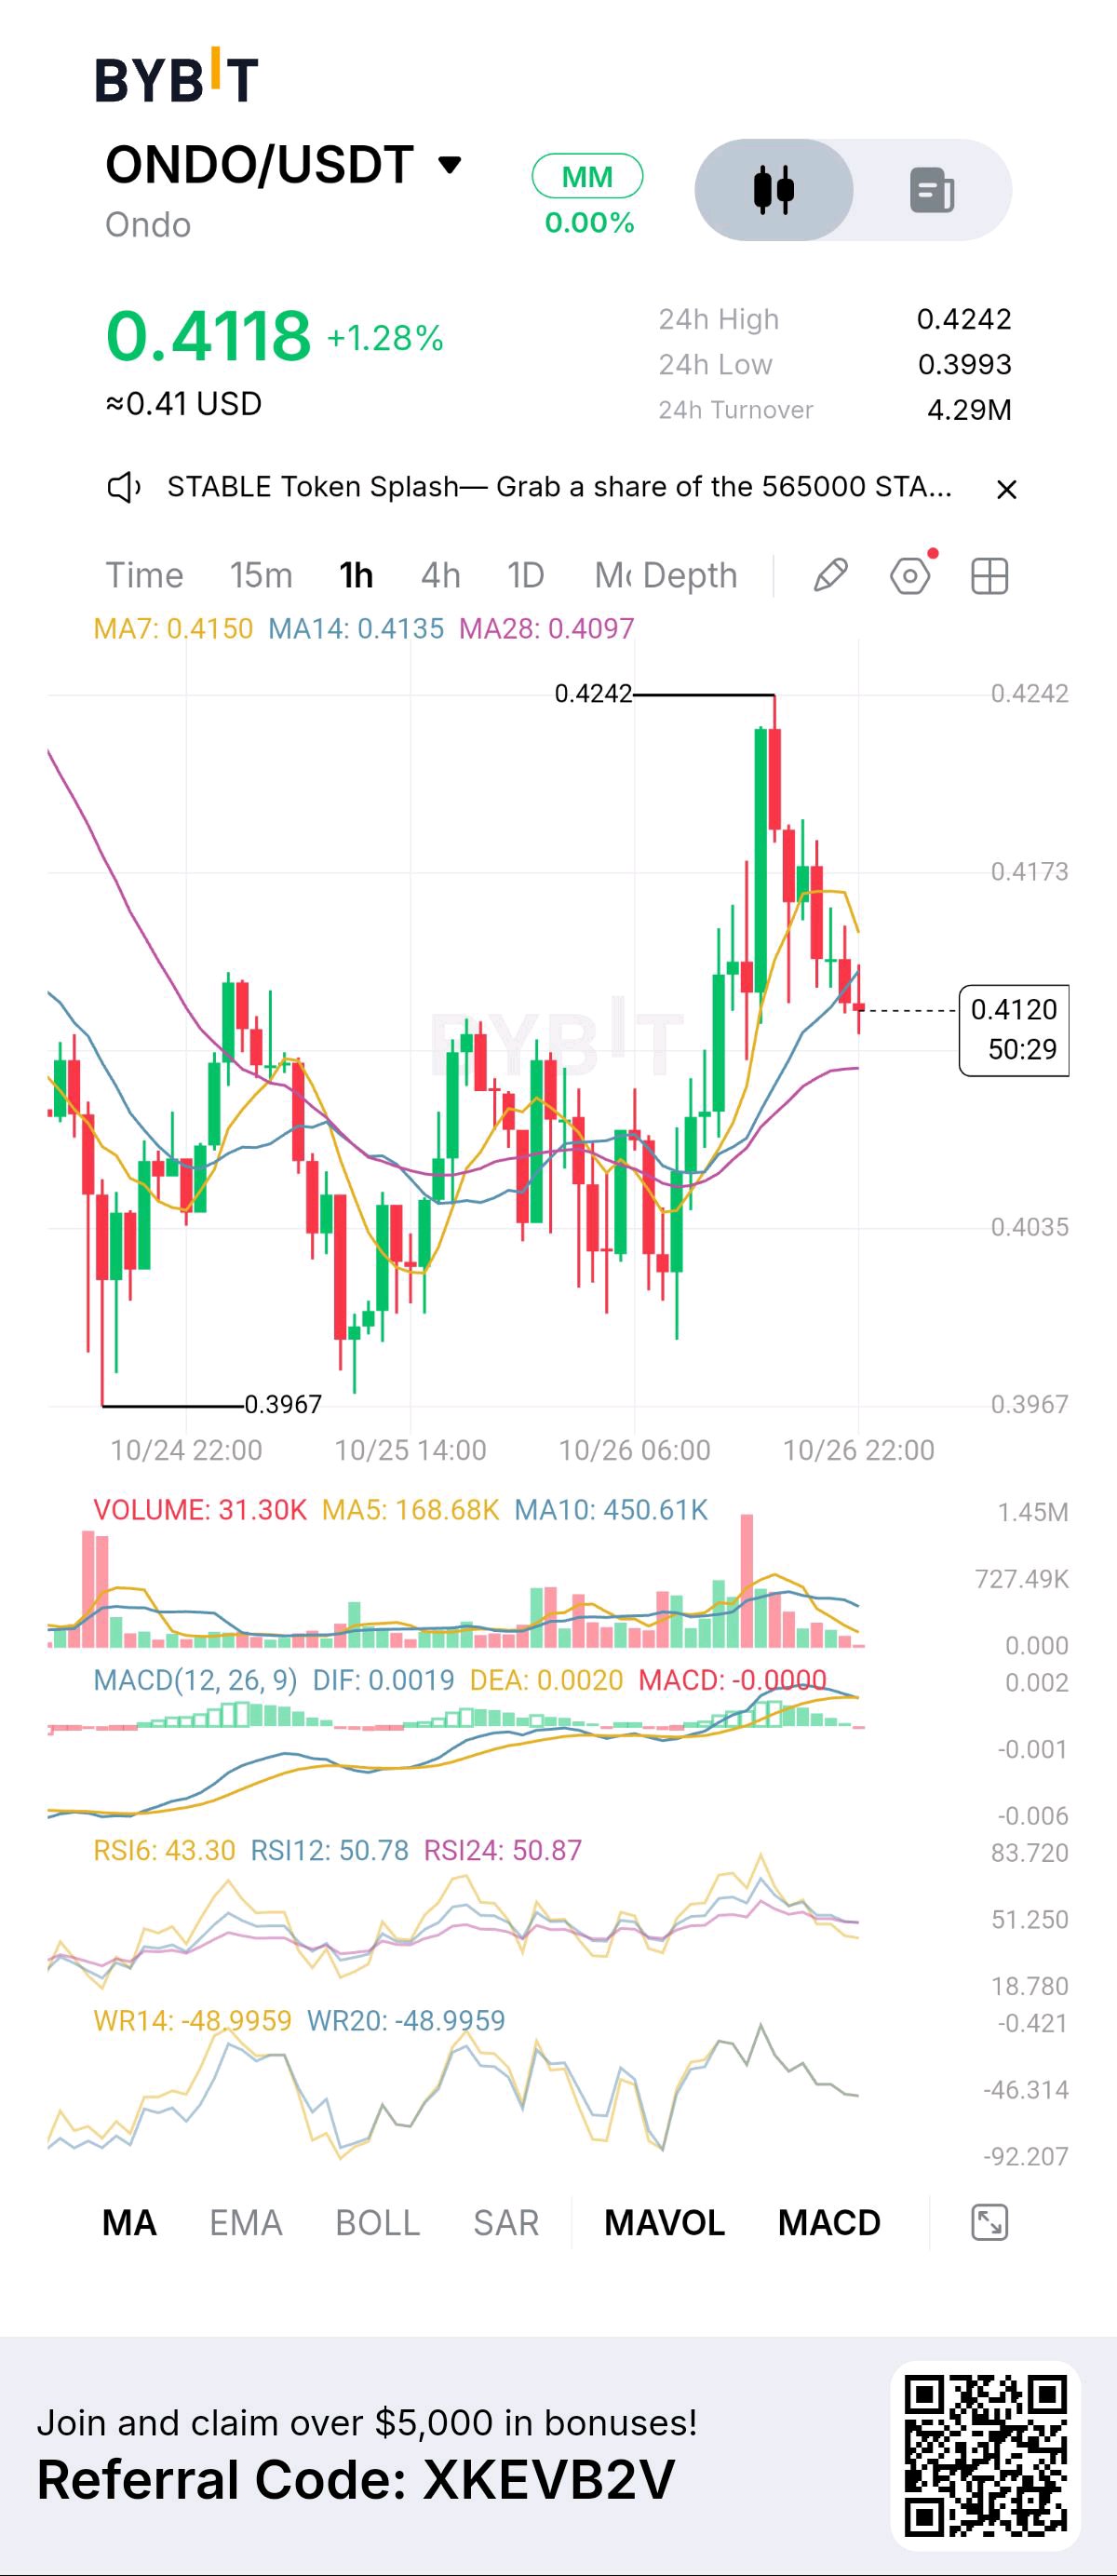
🚨🔥 ONDO/USDT: THE BATTLE IS NOT OVER! 🚀💎 Something interesting is happening on the ONDO chart, and traders should pay close attention! 👀📊 $ONDOUSDT is currently trading around $0.4118, showing a gain of approximately 1.28% in the screenshot. After making a strong upward move toward $0.4242, the price has started pulling back. But the big question is: Is this just a temporary correction before another rally, or are sellers beginning to take control? 🤔 📊 LET'S BREAK DOWN THE CHART! 🟢 1. The Recent Price Action ONDO climbed from the lower price region and made a strong push toward $0.4242. This upward movement attracted attention, but the rejection near the recent high suggests that some selling pressure has appeared. The next move will be important in determining whether buyers can regain control. 🔍 2. Resistance Levels to Watch The first important resistance zone is around $0.4173. Above that, the major level to watch is $0.4242, the recent high shown on the chart. If buyers manage to push the price above this level and sustain the breakout, it could open the door to further upside. However, a breakout is not confirmed until price action supports it. 🔴 3. Support Levels to Watch The $0.4090 area is an important zone to monitor, followed by approximately $0.4035. If the price holds above support and buyers return, ONDO could attempt another upward move. However, if the price breaks below these areas, further downside may follow. 📉 4. What the Indicators Are Telling Us The RSI readings show mixed momentum, while the MACD is close to the neutral zone after the recent upward move. This suggests that the market needs confirmation before traders can confidently determine the next direction. Remember: no single indicator can predict the market with certainty. 🎯 MY KEY WATCHLIST ✅ $0.4173 — First resistance to watch. 🔥 $0.4242 — The major breakout level. 🛡️ $0.4090 — Nearby support to monitor. ⚠️ $0.4035 — Another important support zone. 🚀 THE BIG QUESTION Will ONDO recover from this pullback and challenge $0.4242 again? Or will sellers push the price toward lower support levels before buyers step back in? The next few candles could provide useful clues, but patience and risk management remain essential. 💬 LET'S HEAR YOUR OPINION! If you are watching ONDO right now, what is your target price? 📈 $0.43 🚀 $0.45 💎 $0.50 Or do you think ONDO will fall first before making another move upward? Drop your prediction in the comments. Let's discuss the chart and see what everyone is expecting! ⚠️ Remember: this is technical analysis, not a guarantee of future performance. Always do your own research and manage your risk carefully. #ByXIMPACT
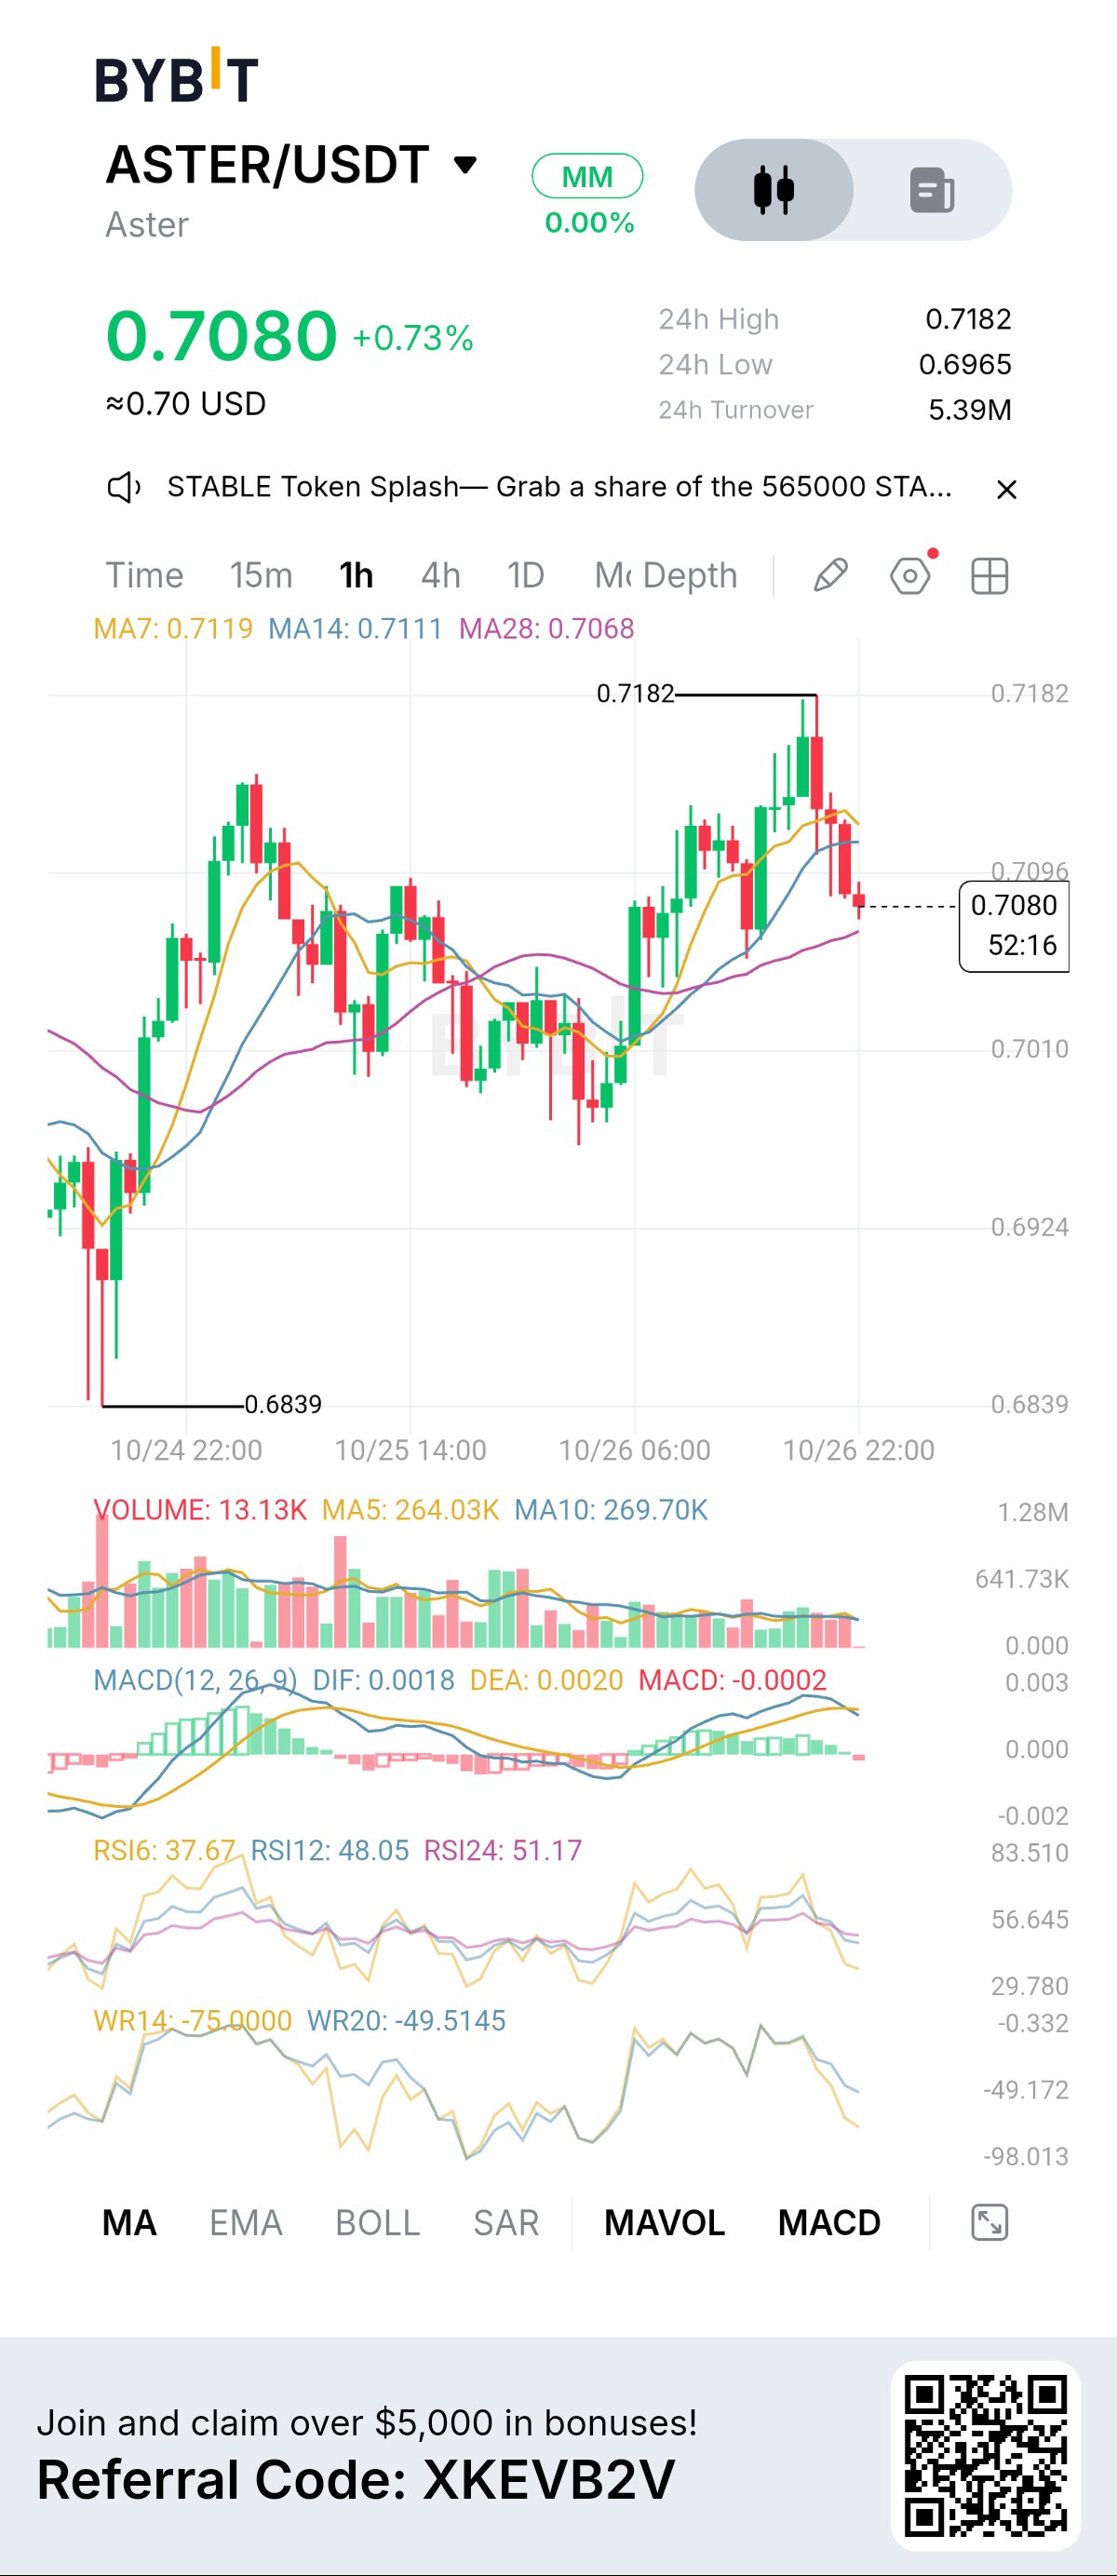
🚨 ASTER/USDT ALERT! 🔥 ASTER BULLS FACE A CRITICAL TEST! $ASTERUSDT is trading at $0.7080, up 0.73%, after climbing to a 24-hour high of $0.7182. However, the latest candles show a pullback from the recent peak, leaving traders watching for the next move. 🐂 Can buyers regain control and push ASTER toward a new high, or will sellers extend the correction? 📊 KEY LEVELS TO WATCH 💰 Current Price: $0.7080 📈 24H High: $0.7182 📉 24H Low: $0.6965 🟢 Immediate Resistance: $0.7111–$0.7119 🚀 Major Resistance: $0.7182 🛡️ First Support: $0.7068 ⚠️ Lower Support: $0.7010 🔻 Major Support: $0.6965 🐂 BULLISH SCENARIO If buyers reclaim $0.7119 and sustain upward momentum, ASTER could retest $0.7182. A confirmed breakout above that level could signal further upside. 🐻 BEARISH SCENARIO The RSI6 is around 37.67, and the MACD histogram is slightly negative, suggesting that short-term momentum has weakened. If ASTER loses $0.7068, the next levels to watch are $0.7010 and $0.6965. 📊 WHAT THE CHART IS TELLING US ASTER recently rallied toward resistance but has since pulled back. The price remains near its longer moving average, making the $0.7068 area important to watch for signs of support. 🔥 WHAT'S YOUR ASTER PRICE TARGET? 🚀 $0.72 — Breakout incoming? 💎 $0.75 — Strong bullish continuation? 📉 $0.70 — Another support test? 💬 Drop your prediction in the comments and join the discussion! ⚠️ These are possible scenarios based on the chart provided, not guaranteed outcomes. Always manage your risk and wait for confirmation before trading. #ByXIMPACT
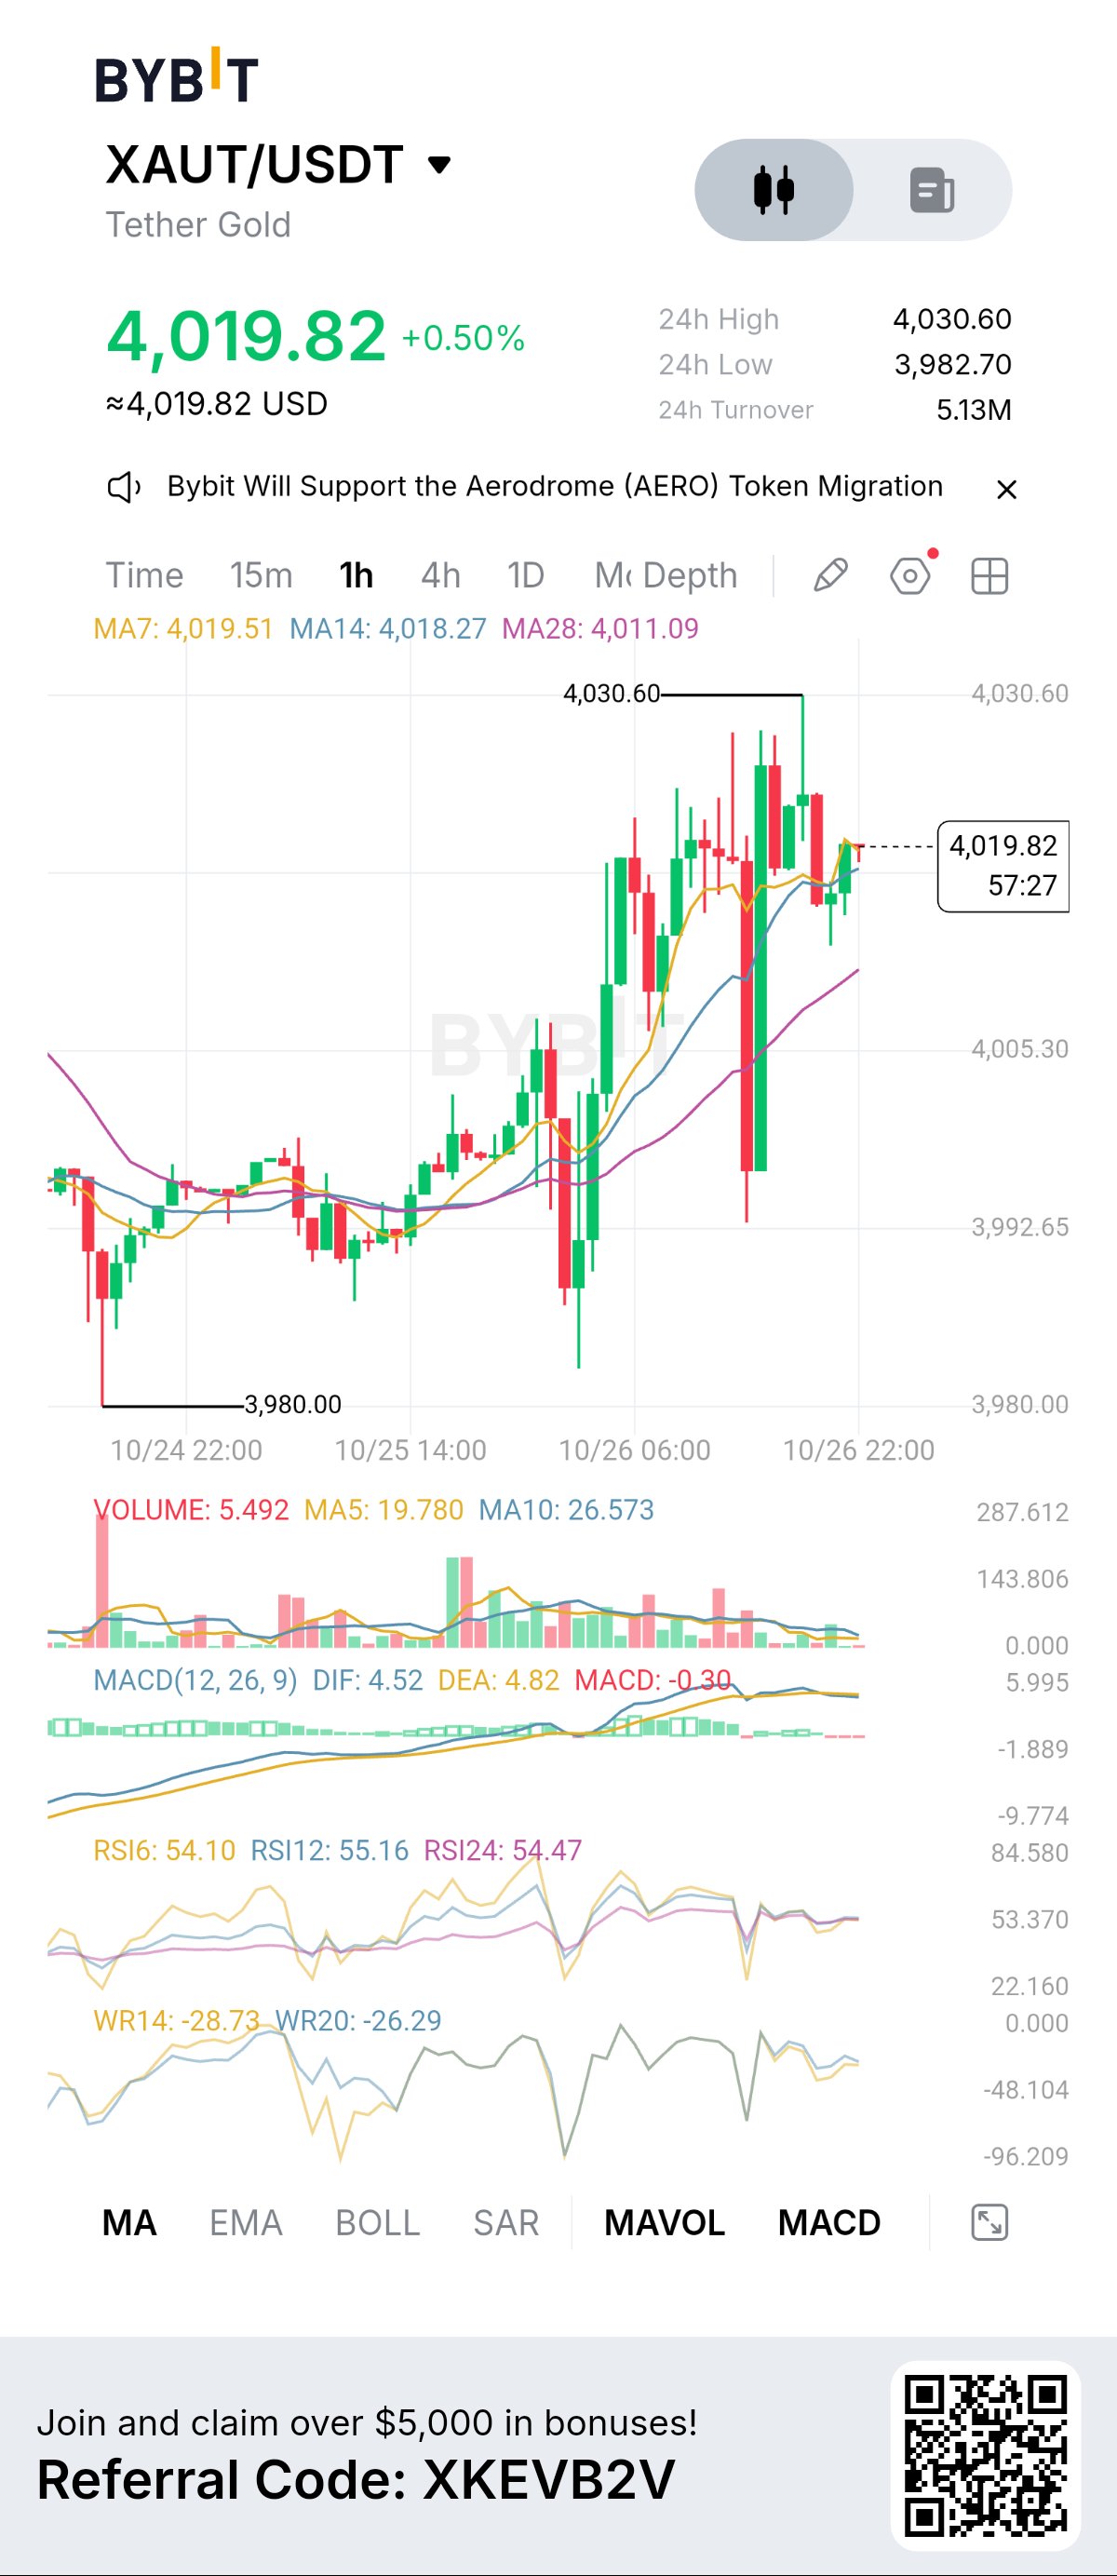
🚨 XAUT/USDT GOLD ALERT! 🥇🔥 TETHER GOLD IS PUSHING HIGHER! $XAUTUSDT is trading at $4,019.82, up 0.50%, as buyers maintain a positive short-term trend. After reaching a high of $4,030.60, the price is consolidating near the $4,020 level. Could gold-backed XAUT be preparing for another breakout, or will resistance trigger a pullback? 📊 KEY LEVELS TO WATCH 💰 Current Price: $4,019.82 📈 24H High: $4,030.60 📉 24H Low: $3,982.70 🟢 Immediate Resistance: $4,025–$4,030.60 🛡️ First Support: $4,018 ⚡ Next Support: $4,005.30 🔻 Major Support: $3,992.65 🐂 BULLISH SCENARIO XAUT is trading above its MA14 and MA28, while RSI readings around 54–55 suggest mildly positive momentum. If buyers break above $4,030.60 with sustained volume, the market could attempt another upward move. 🐻 BEARISH SCENARIO The MACD histogram is slightly negative, indicating that short-term momentum may be cooling. If XAUT fails to break resistance, a pullback toward $4,005.30 or $3,992.65 could develop. 📊 WHAT TRADERS SHOULD WATCH The $4,030.60 level is the immediate breakout point. A confirmed move above it could strengthen the bullish case, while a rejection may keep XAUT consolidating around $4,020. 🔥 WHAT'S YOUR NEXT PRICE TARGET? 🥇 $4,050 — Bullish continuation 🚀 $4,100 — Strong breakout 📉 $4,000 — Support retest 💬 Share your prediction in the comments! ⚠️ XAUT is a gold-backed token, and its price can be affected by gold prices, market liquidity, and trading conditions. These are chart-based scenarios, not guaranteed outcomes. Always manage your risk. #ByXIMPACT
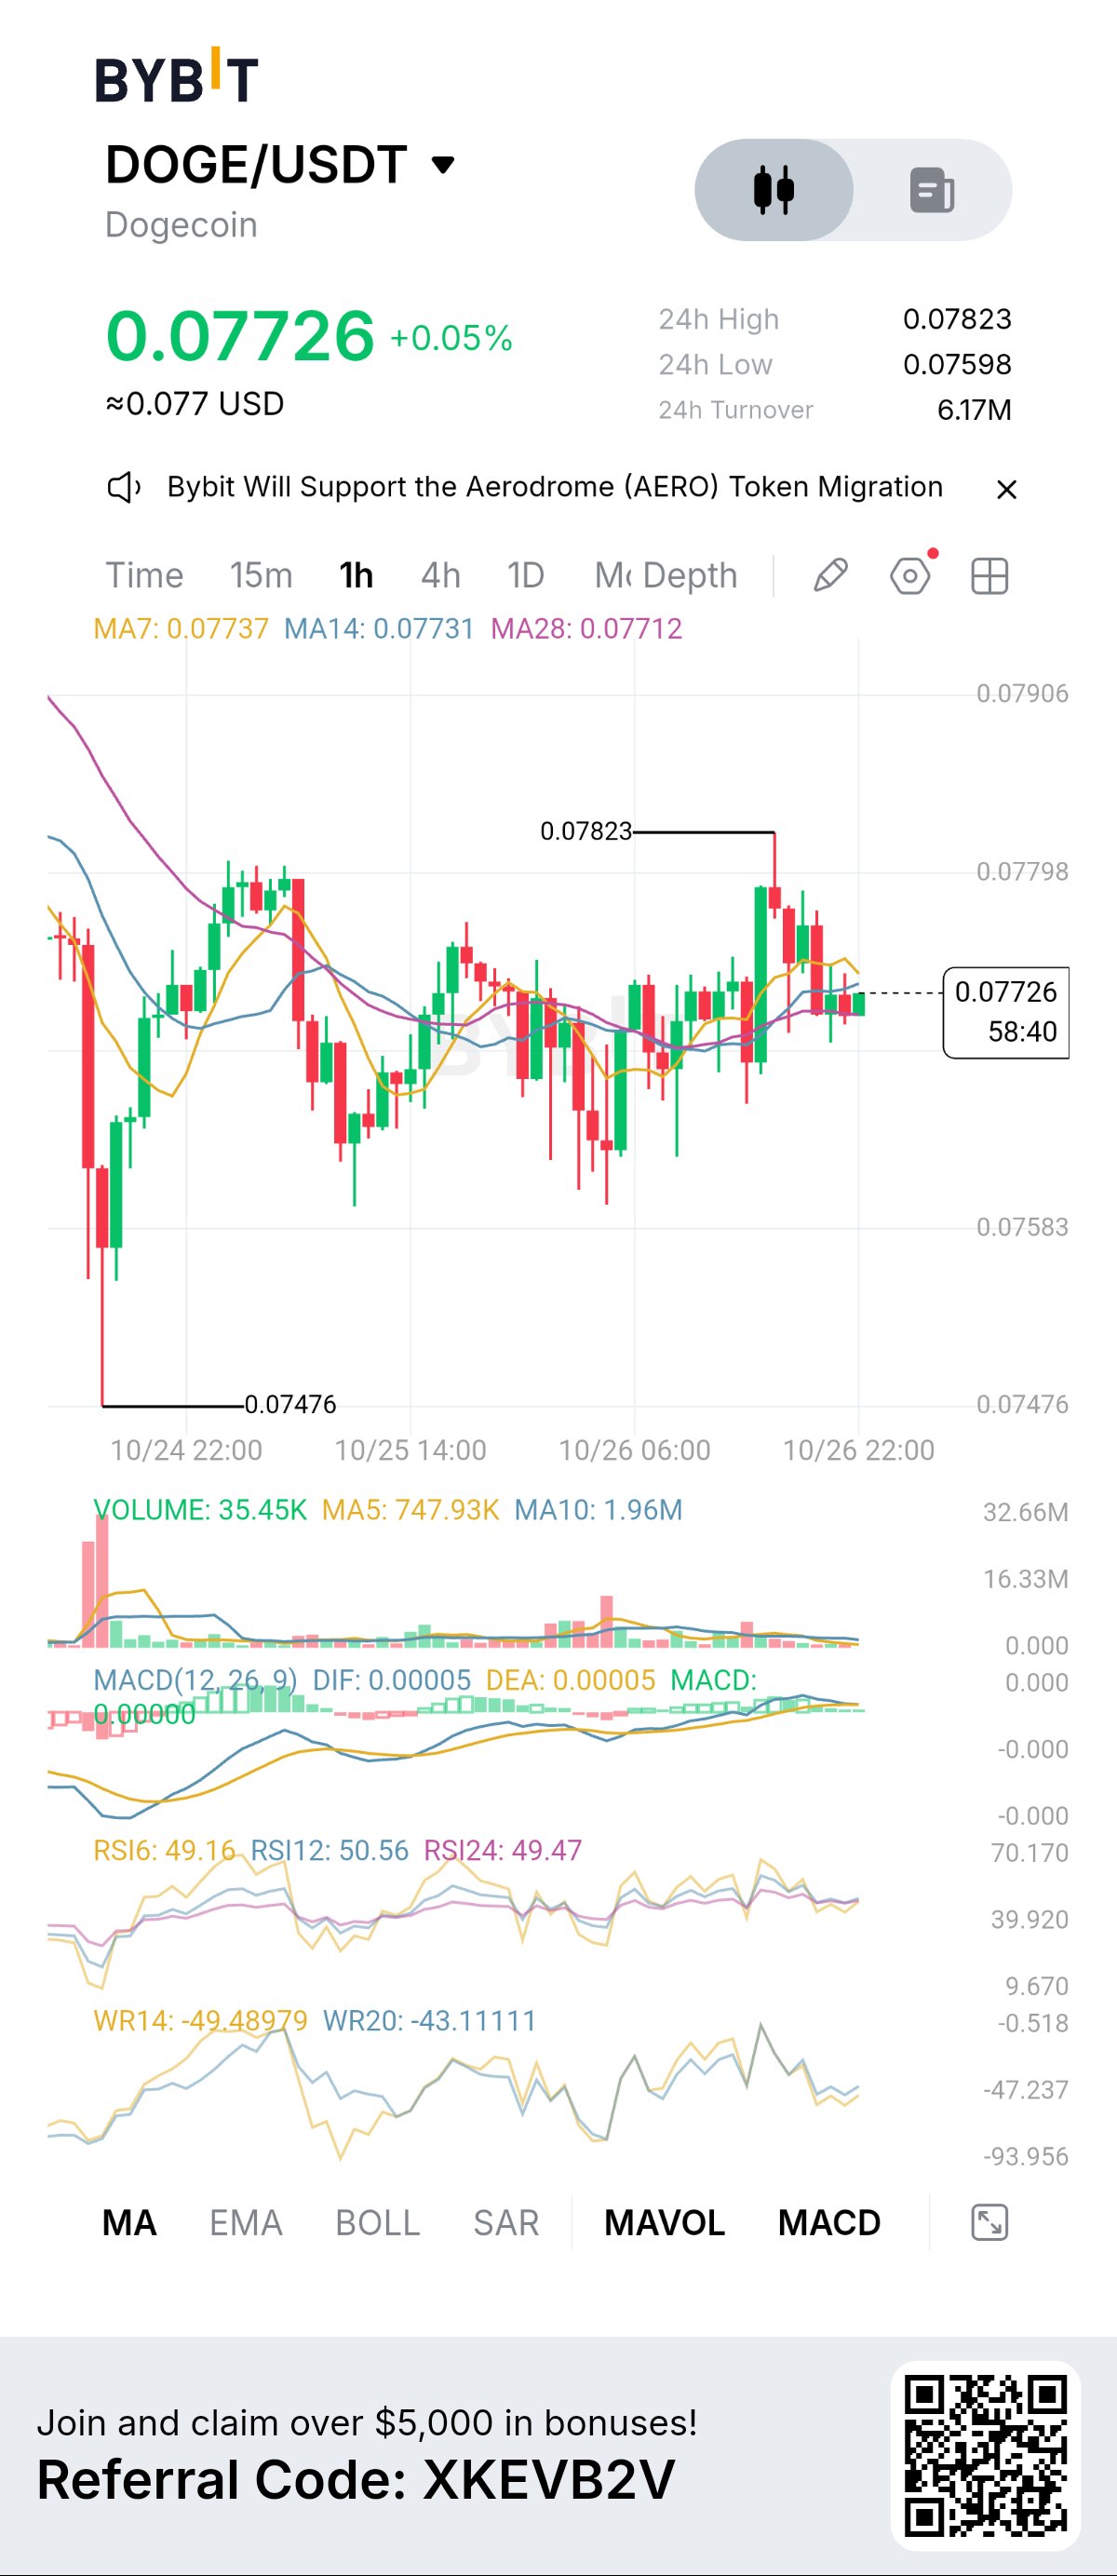
🚨 DOGE/USDT MARKET ALERT! 🐕🔥 IS DOGE PREPARING FOR ITS NEXT BIG MOVE? $DOGEUSDT is holding around $0.07726, with a slight gain of 0.05% as the market continues to move sideways. After testing a high of $0.07823, DOGE has pulled back and is now consolidating near its moving averages. 🐂 Could the bulls push for another breakout, or are sellers preparing to take control? 📊 KEY LEVELS TO WATCH 💰 Current Price: $0.07726 📈 24H High: $0.07823 📉 24H Low: $0.07598 🟢 Immediate Resistance: $0.07798 🚀 Major Resistance: $0.07823 🛡️ Immediate Support: $0.07600 ⚠️ Lower Support: $0.07476 🐂 BULLISH SCENARIO If buyers build momentum and push DOGE above $0.07798, the next challenge will be the $0.07823 high. A confirmed breakout with stronger volume could signal another upward move. 🐻 BEARISH SCENARIO If DOGE fails to break resistance, the price could revisit $0.07600. A breakdown below that zone may expose the $0.07476 support level. 📉 WHAT THE INDICATORS SAY The RSI readings are close to 50, while the MACD is nearly flat. This suggests relatively neutral momentum, with neither buyers nor sellers showing a clear advantage. A rise in trading volume may help confirm the next direction. 🔥 THE BIG QUESTION Will Dogecoin break above $0.07823, or will it dip toward $0.075 before making another move? 💬 WHAT'S YOUR DOGE PRICE TARGET? 🚀 $0.080 — Bullish breakout 🐕 $0.085 — Stronger rally 📉 $0.075 — Support retest Drop your prediction in the comments! Let's see who gets the next move right. ⚠️ This analysis is based on the chart provided. These levels are possible scenarios, not guaranteed outcomes. Always manage your risk before trading. #ByXIMPACT
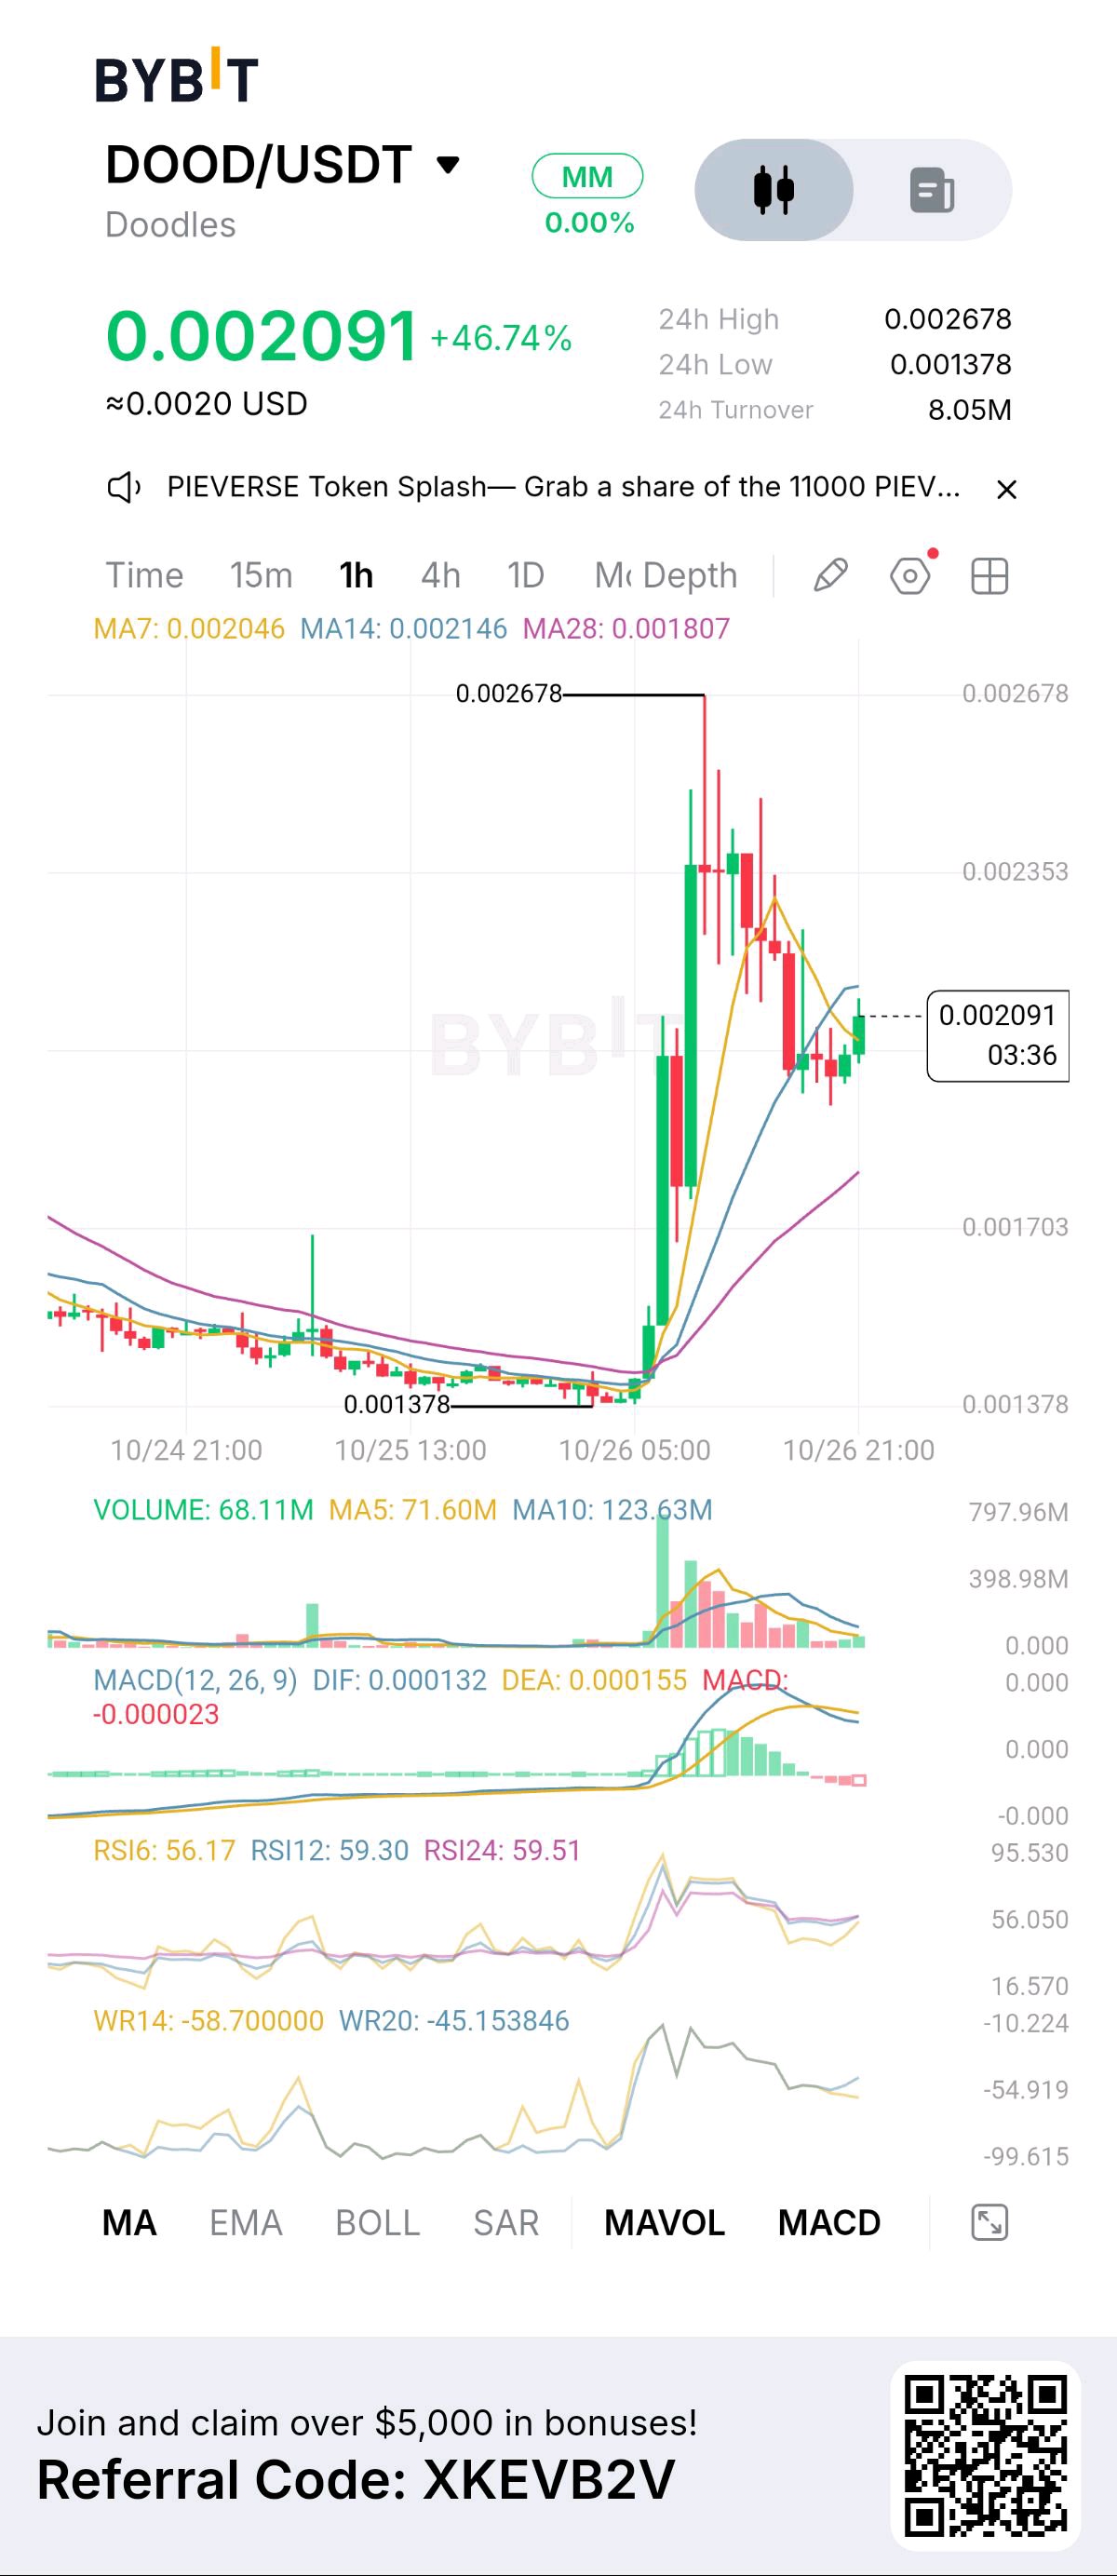
🚨 DOOD/USDT EXPLODES +46.74%! 🔥🚀 IS ANOTHER MASSIVE MOVE COMING? $DOODUSDT is making serious waves in the market! The token is trading at $0.002091, up an incredible 46.74%, following a powerful breakout accompanied by a massive surge in trading volume. After climbing from the $0.001378 low to a high of $0.002678, DOOD has pulled back and is now attempting to stabilize. The big question is whether buyers can regain control for another leg up. 📊 KEY LEVELS TO WATCH 💰 Current Price: $0.002091 🚀 24H High: $0.002678 🛡️ 24H Low: $0.001378 🟢 Immediate Resistance: $0.002146 🔥 Major Resistance: $0.002353 🎯 Breakout Target: $0.002678 🔻 Support Zone: $0.002000 ⚠️ Lower Support: $0.001807 🐂 BULLISH SCENARIO DOOD remains above its MA28 at $0.001807, while the RSI readings are above 56, suggesting that positive momentum remains in place. If buyers push the price above $0.002146 and maintain strong volume, the next levels to watch are $0.002353 and the previous high of $0.002678. 🐻 BEARISH SCENARIO After such a sharp rally, profit-taking could trigger further volatility. The MACD histogram has turned slightly negative, suggesting that short-term momentum has cooled. If DOOD loses the $0.002000 area, traders may watch $0.001807 as a potential support level. 🔥 THE BIG QUESTION Is DOOD preparing for another breakout, or will traders take profits after this explosive rally? 💬 WHAT'S YOUR NEXT PRICE TARGET? 🚀 $0.00235 — Another bullish move 💎 $0.00268 — Previous high retest 📉 $0.00180 — Deeper pullback Drop your prediction in the comments! Let's see who gets the next move right. ⚠️ After a 46%+ surge, volatility and sudden reversals are possible. These are chart-based scenarios, not guaranteed outcomes. Always manage your risk. #ByXIMPACT
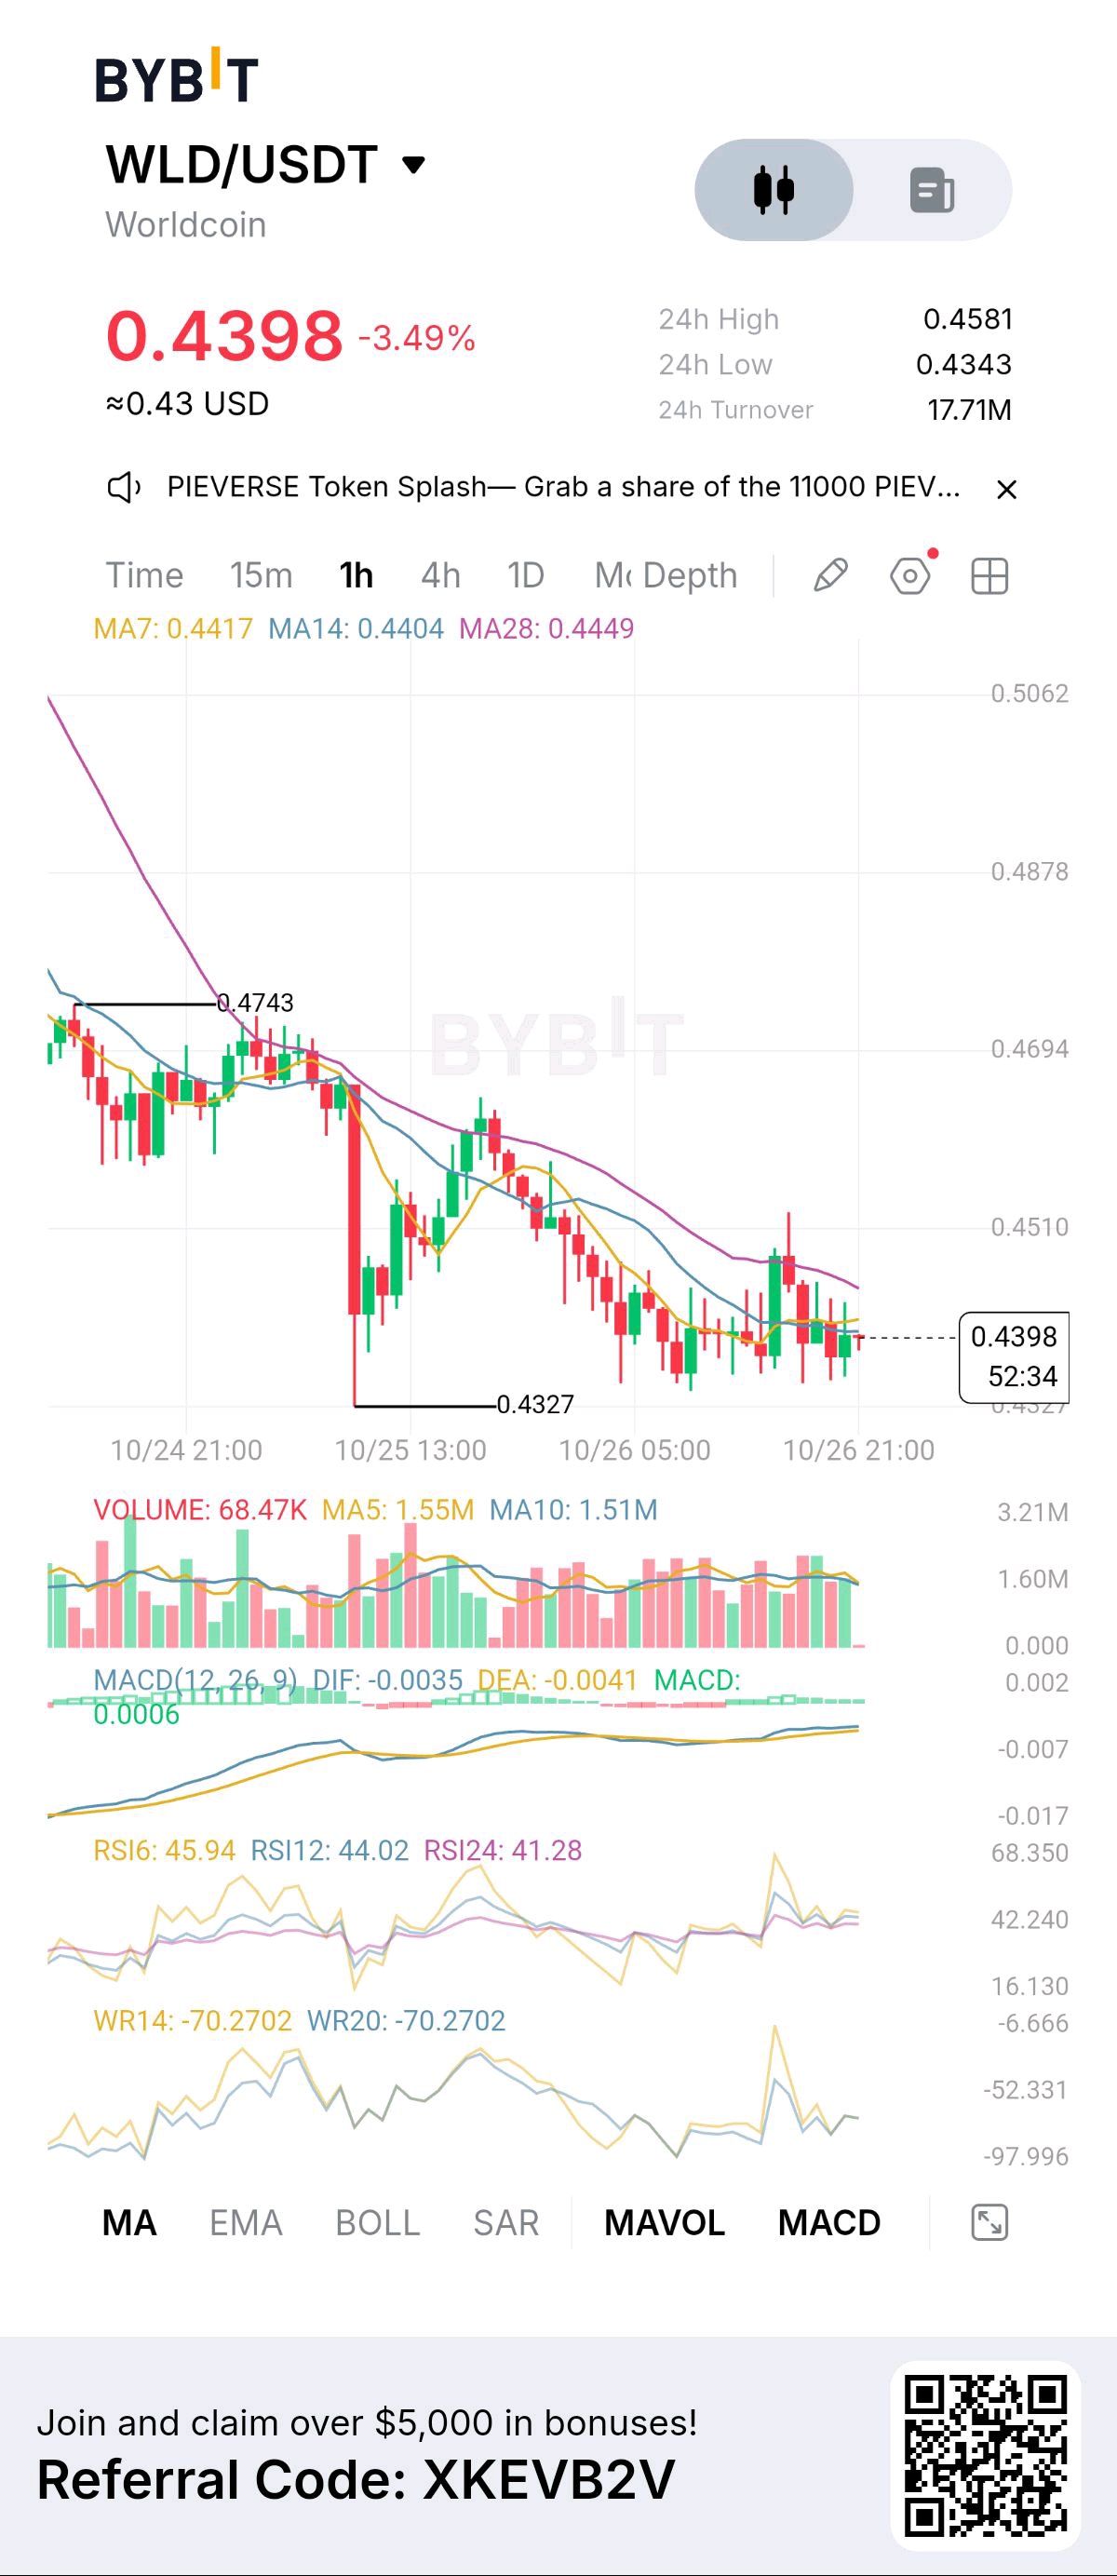
🚨 WLD/USDT ALERT! 🔥 WORLDCOIN IS TESTING A CRITICAL SUPPORT ZONE! $WLDUSDT is trading at $0.4398, down 3.49%, as bearish pressure continues to weigh on the market. After falling from the $0.4743 area and reaching a low of $0.4327, WLD is attempting to stabilize around $0.44. Will buyers step in to trigger a recovery, or will sellers push the price lower? 📊 KEY LEVELS TO WATCH 💰 Current Price: $0.4398 📈 24H High: $0.4581 📉 24H Low: $0.4343 🛡️ Immediate Support: $0.4343–$0.4327 🟢 First Resistance: $0.4417–$0.4449 🚧 Major Resistance: $0.4510 🎯 Higher Resistance: $0.4581 🐻 BEARISH SCENARIO WLD is trading below its MA7, MA14, and MA28, indicating that the short-term trend remains weak. RSI readings below 50 also suggest that sellers still have a slight advantage. If the $0.4327 support breaks, further downside pressure could develop. 🐂 BULLISH SCENARIO The MACD histogram is slightly positive, hinting at a possible improvement in short-term momentum. If buyers defend support and reclaim $0.4449, the next level to watch is $0.4510. A stronger move above that resistance could bring $0.4581 into focus. 🔥 THE BIG QUESTION Is WLD preparing for a rebound, or is another dip coming before recovery? 💬 WHAT'S YOUR PRICE TARGET? 🚀 $0.45 — Short-term recovery 🔥 $0.46 — Bullish breakout 📉 $0.43 — Support breakdown Drop your prediction in the comments! ⚠️ This analysis is based on the chart provided, not a guaranteed forecast. Always manage risk and wait for confirmation before entering a trade. #ByXIMPACT
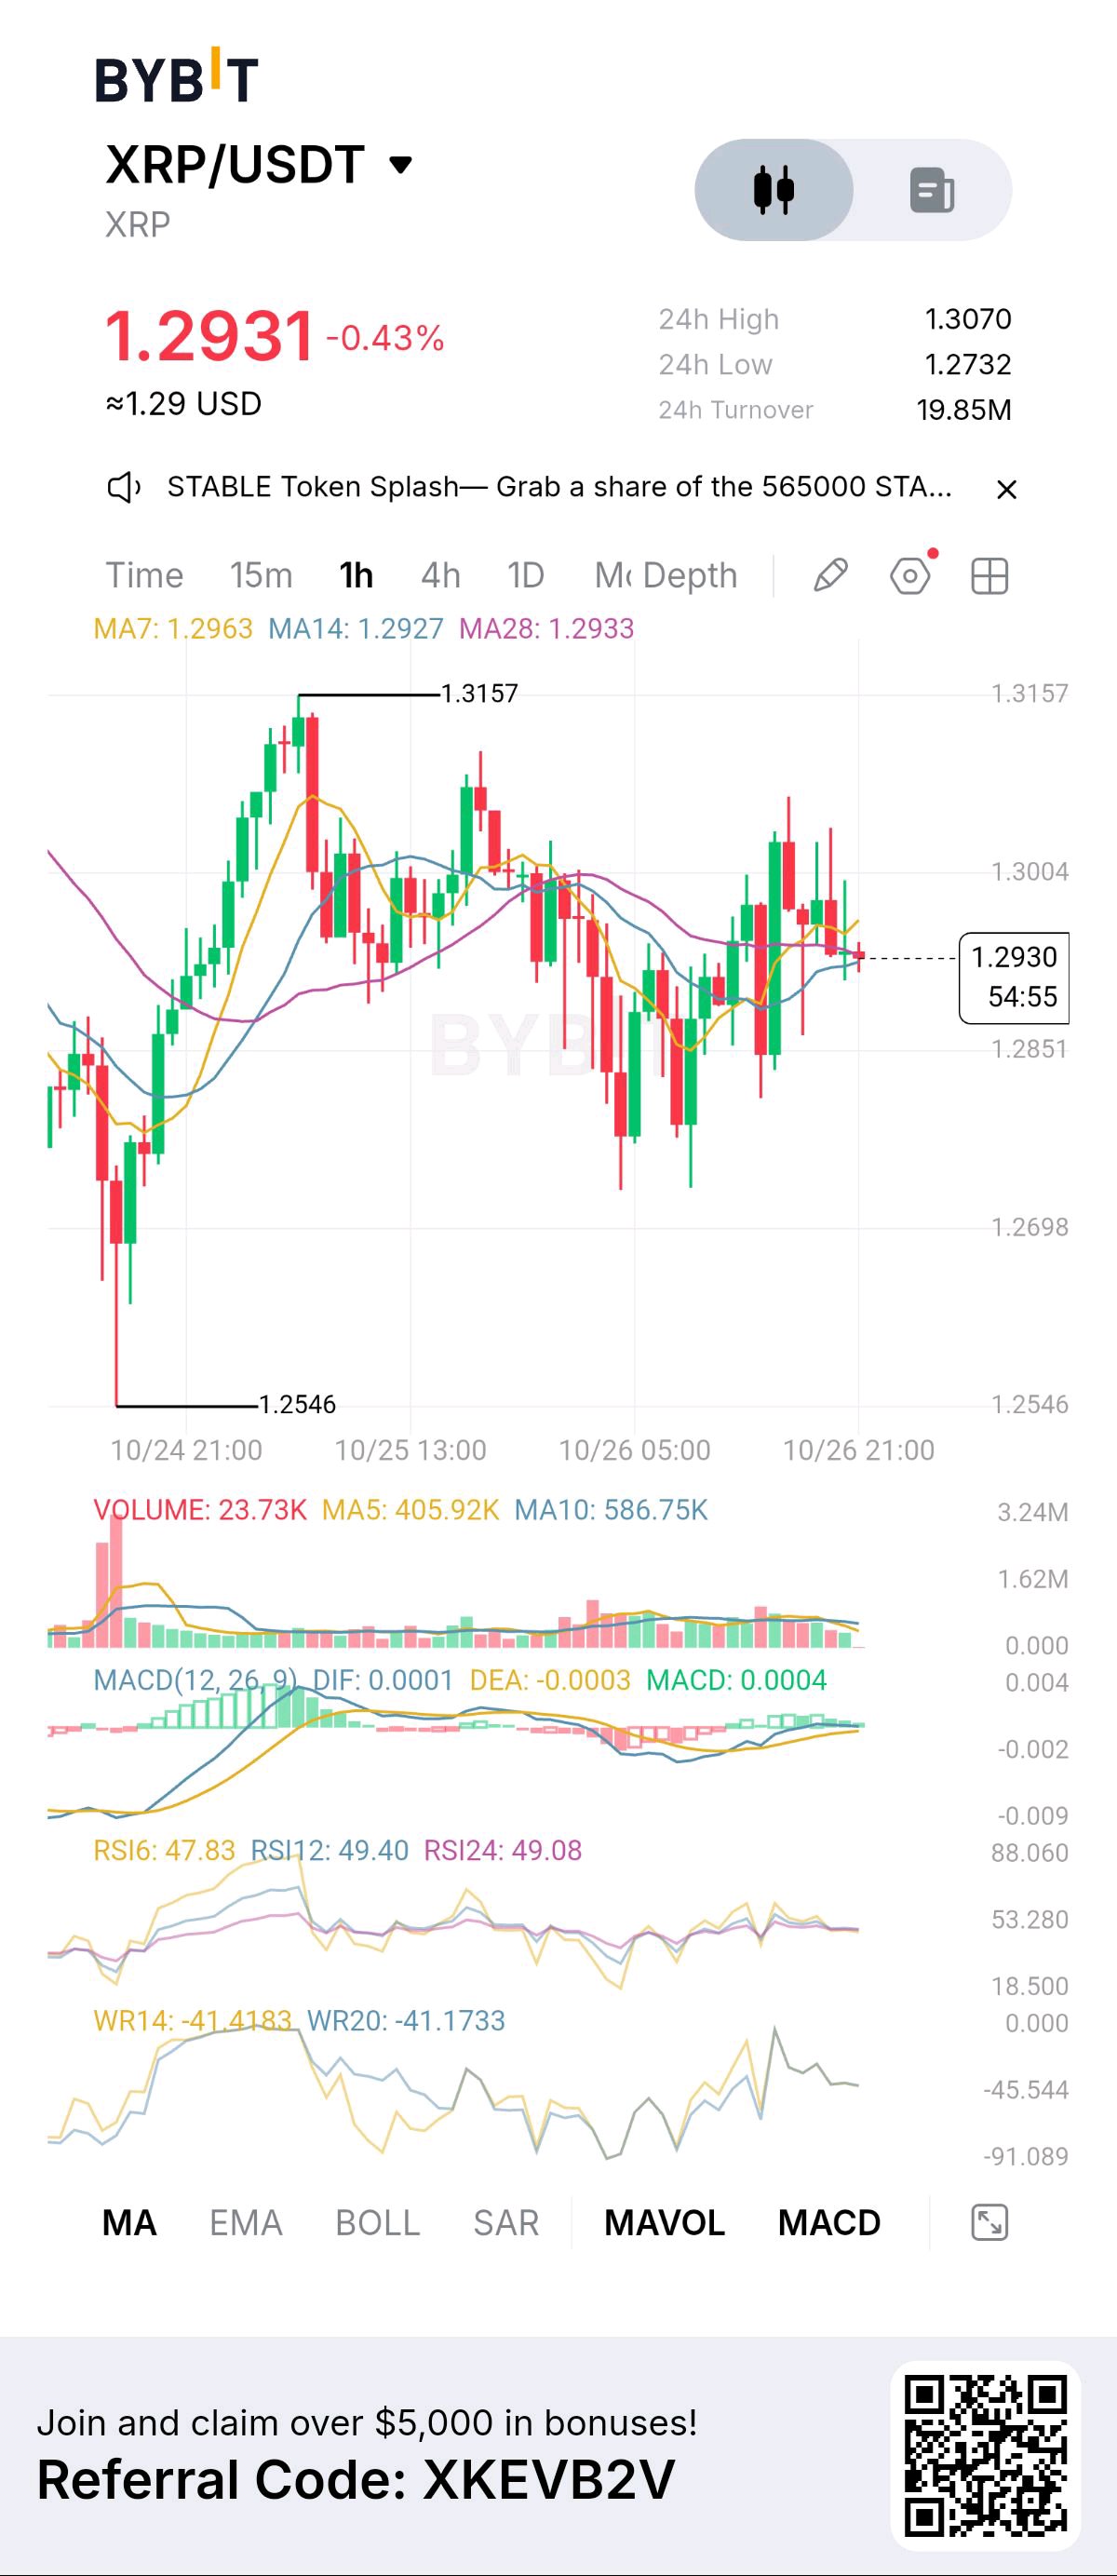
🚨 XRP/USDT MARKET ALERT! 🔥 RIPPLE IS AT A CRITICAL TURNING POINT! $XRPUSDT is trading around $1.2931, down 0.43%, as buyers and sellers battle for control. After reaching a high of $1.3157, the price has pulled back and is now consolidating around $1.29. Could XRP be preparing for another breakout, or will sellers push it toward lower support levels? 📊 KEY LEVELS TO WATCH 💰 Current Price: $1.2931 📈 24H High: $1.3070 📉 24H Low: $1.2732 🟢 Immediate Resistance: $1.3004 🚀 Major Resistance: $1.3070–$1.3157 🛡️ Immediate Support: $1.2851 ⚠️ Major Support: $1.2732 🐂 BULLISH SCENARIO If buyers regain momentum and XRP breaks above $1.3004 with strong volume, the next levels to watch are $1.3070 and $1.3157. A confirmed breakout could signal renewed buying interest. 🐻 BEARISH SCENARIO If XRP fails to reclaim $1.3004, selling pressure could push the price toward $1.2851. A breakdown below that level could bring $1.2732 into focus. 📊 WHAT THE INDICATORS REVEAL The RSI readings are near 48–49, suggesting relatively neutral momentum with a slight bearish bias. The MACD histogram is marginally positive, hinting at a possible short-term recovery, but the signal remains weak. 🔥 THE BIG QUESTION Will XRP break above $1.30 and continue higher, or will the bears take control again? 💬 WHAT'S YOUR XRP PRICE TARGET? 🚀 $1.32 — Bullish breakout 📈 $1.35 — Strong recovery 📉 $1.27 — Support retest Drop your prediction in the comments and let's discuss the next possible move! ⚠️ This analysis is based on the chart provided, not a guaranteed forecast. Always manage your risk and wait for confirmation before making trading decisions. #ByXIMPACT
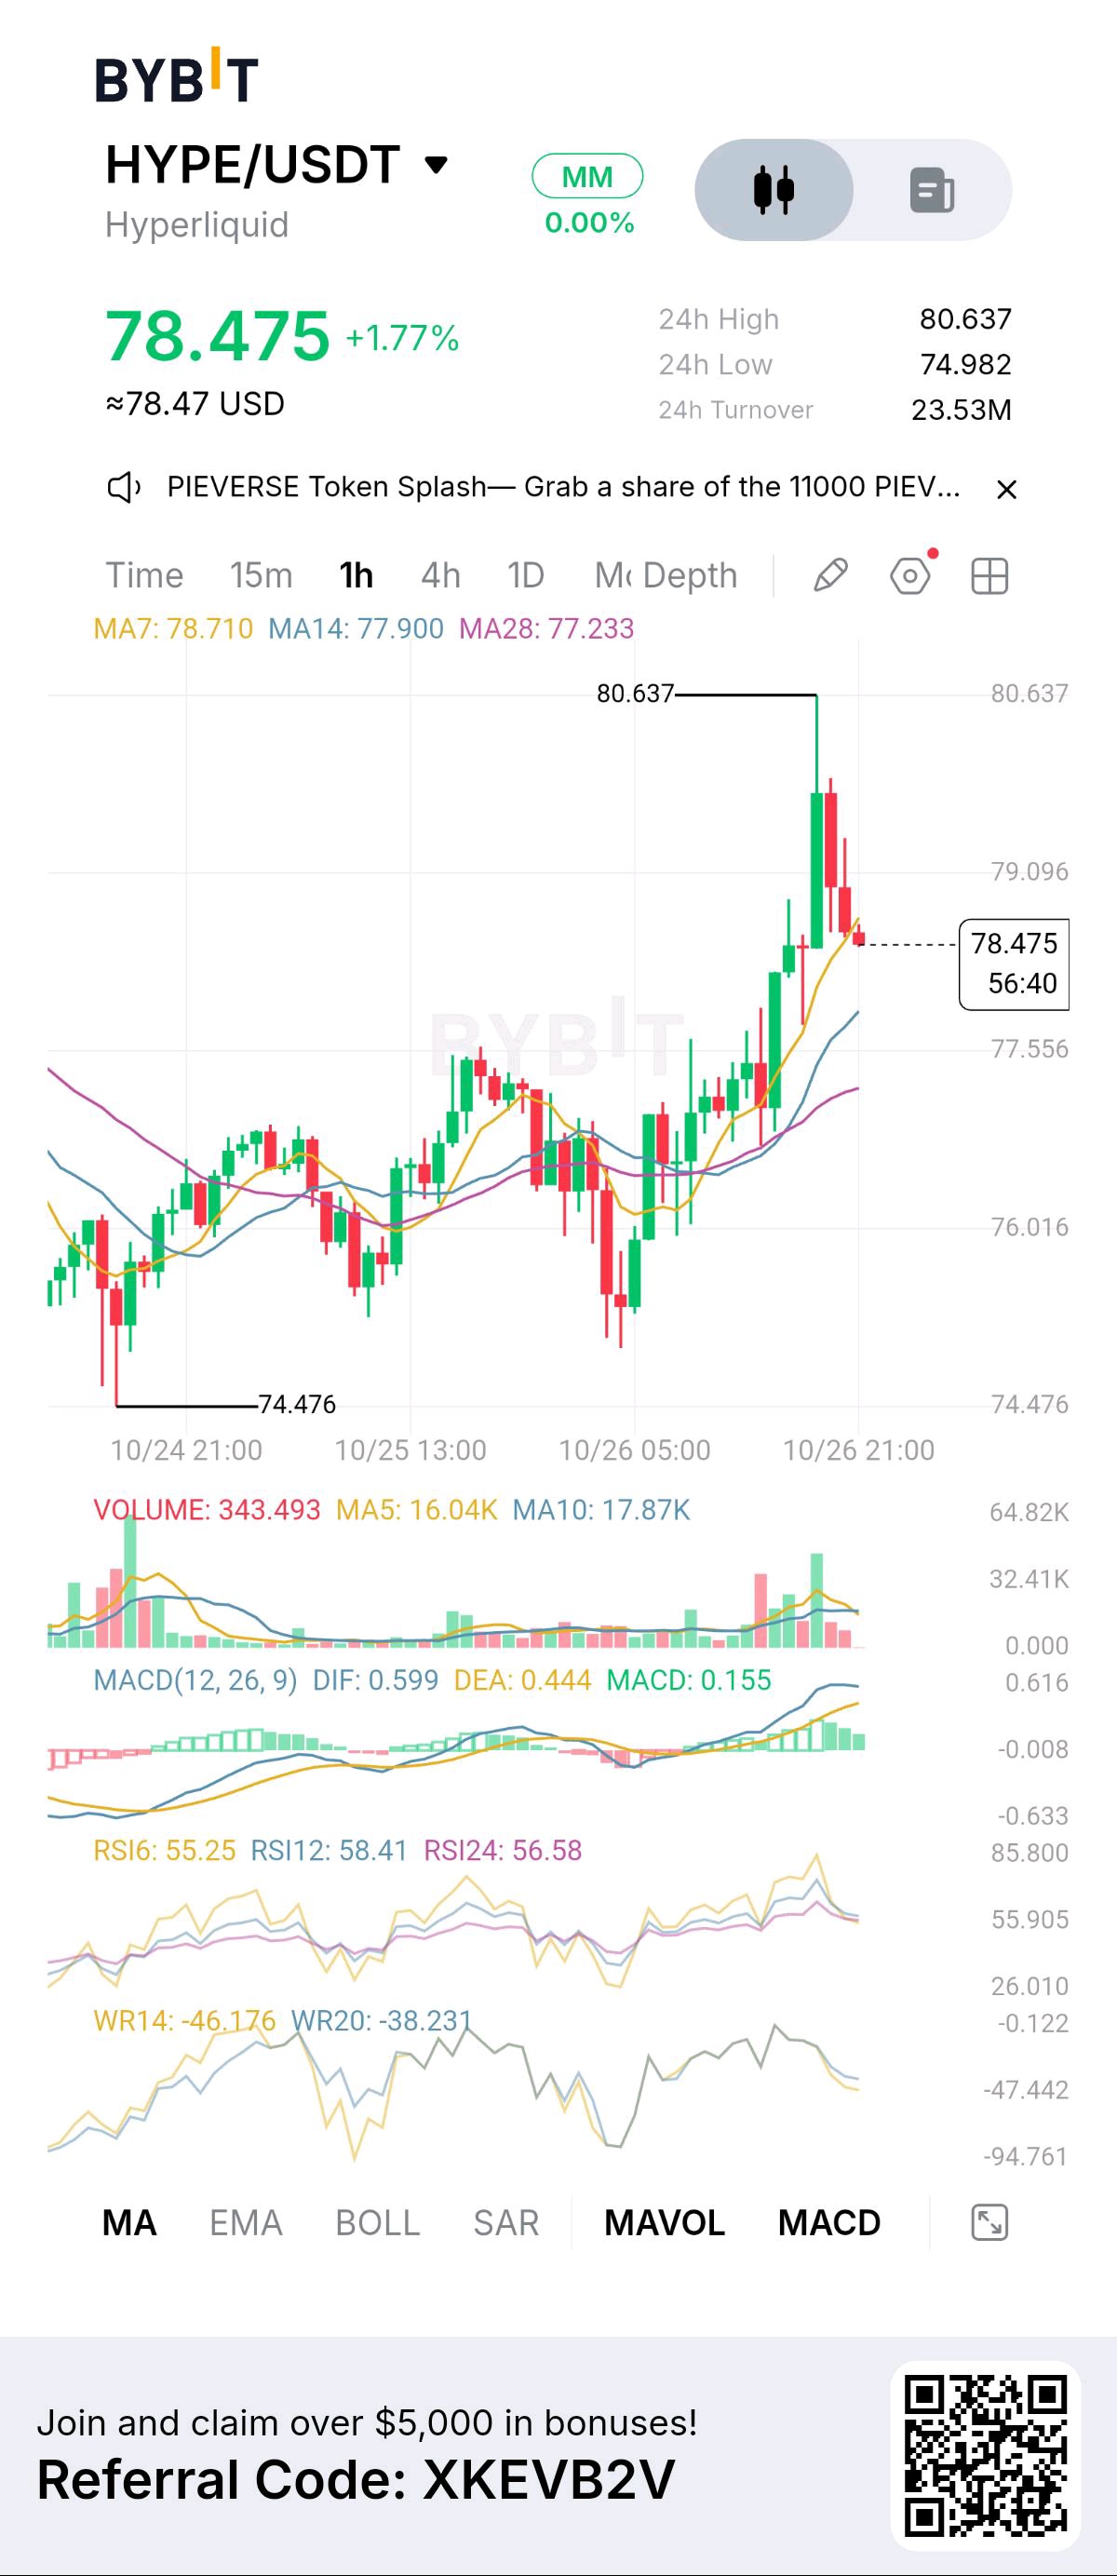
🚨 HYPE/USDT BREAKOUT ALERT! 🚀 HYPERLIQUID BULLS ARE MAKING A MOVE! $HYPEUSDT is trading at $78.475, up 1.77%, after a strong upward move that pushed the price to a 24-hour high of $80.637. The bulls have shown impressive strength, but after this sharp rally, traders are watching closely to see whether HYPE can break higher or needs a short-term pullback. 📊 KEY LEVELS TO WATCH 💰 Current Price: $78.475 📈 24H High: $80.637 📉 24H Low: $74.982 🟢 Immediate Resistance: $79.10 🚀 Major Resistance: $80.637 🛡️ First Support: $77.90 ⚡ Stronger Support: $77.23 🔻 Lower Support: $76.02 🐂 BULLISH SCENARIO HYPE is trading above its MA14 and MA28, while the MACD remains positive and RSI readings are above 55. These signals suggest that bullish momentum is still present. If buyers regain control and push through $79.10, the next major test could be $80.637. A confirmed breakout above that high could open the door to further upside. 🐻 BEARISH SCENARIO After reaching $80.637, the price pulled back toward $78.475. If selling pressure continues, HYPE could retest $77.90 or $77.23. A deeper correction could bring $76.02 into focus. 📈 WHAT MAKES THIS MOMENT IMPORTANT? The recent rally came with increased trading activity, but momentum has eased from its peak. The next move will depend on whether buyers can sustain demand and defend the recent breakout area. 🔥 YOUR NEXT HYPE PRICE TARGET? 🚀 $82 — Bulls continue the rally 💎 $85 — Strong breakout 📉 $77 — Pullback before the next move 💬 Drop your prediction in the comments! Are you bullish or bearish on HYPE right now? ⚠️ This analysis is based on the chart provided and is not a guaranteed forecast. Always manage risk and avoid chasing sudden price movements. #ByXIMPACT
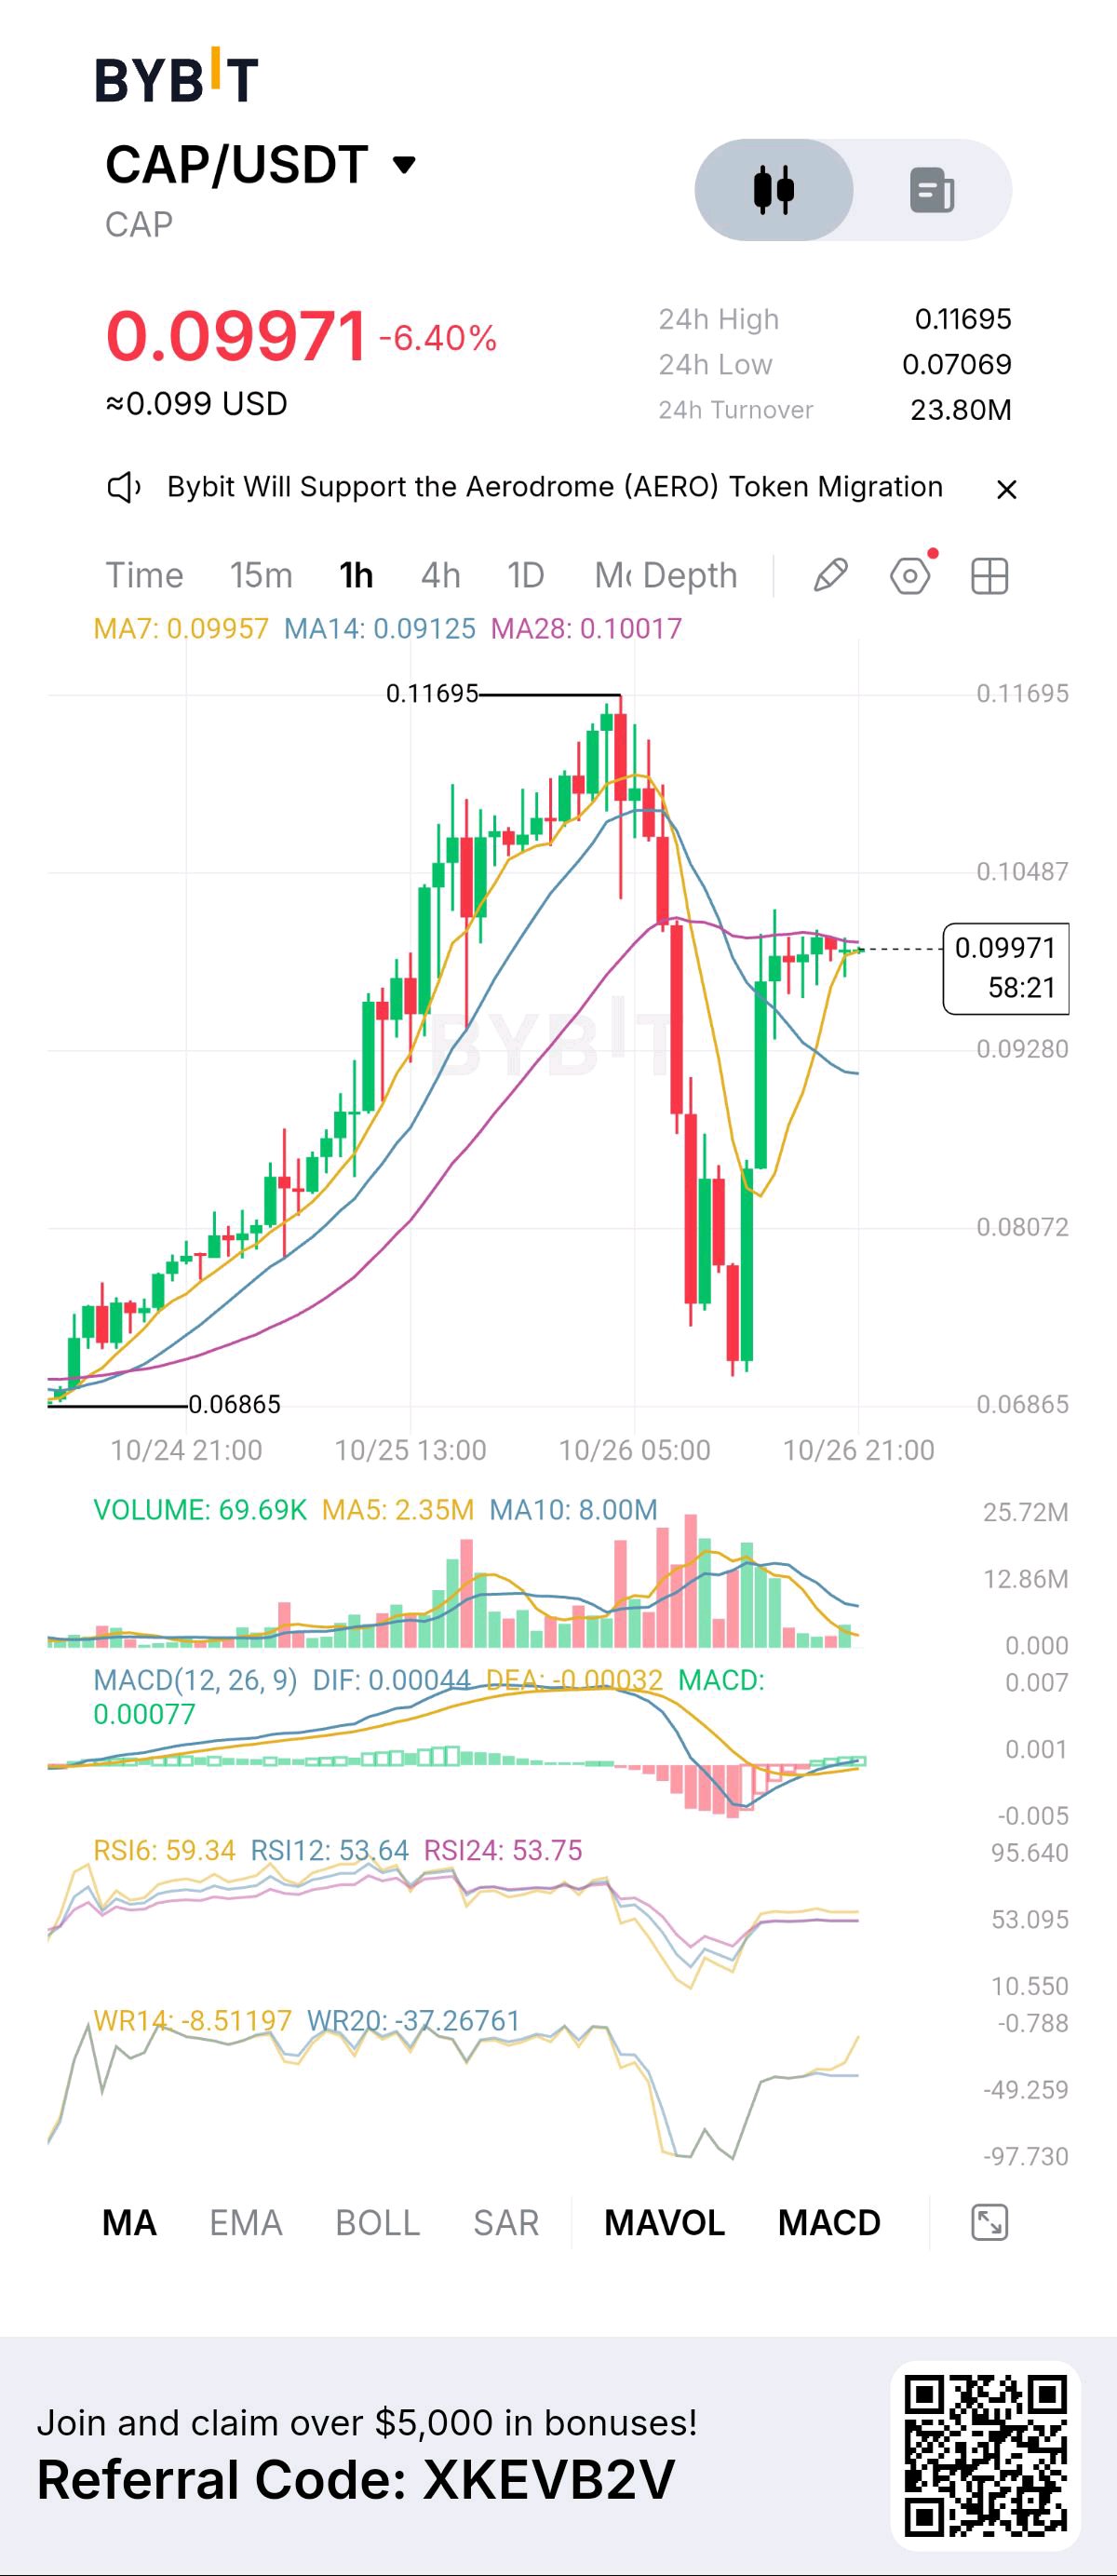
🚨 CAP/USDT UPDATE: THE BOUNCE IS HERE, BUT CAN THE BULLS TAKE CONTROL? 🔥📈 $CAPUSDT is trading around $0.09971, down 6.40%, after a dramatic sell-off from the $0.11695 high. The price has now rebounded sharply from the $0.07069–$0.074 area and is attempting to stabilize near $0.10. 🐂 Could this recovery lead to another rally, or is the market preparing for another pullback? 📊 KEY LEVELS TO WATCH 💰 Current Price: $0.09971 📈 24H High: $0.11695 📉 24H Low: $0.07069 🟢 Immediate Resistance: $0.10017 🚧 Next Resistance: $0.10487 🎯 Major Resistance: $0.11695 🛡️ Support Zone: $0.09280 ⚠️ Lower Support: $0.08072 🔥 BULLISH SCENARIO The RSI readings are above 50, while the MACD has turned positive on the displayed chart. These signals suggest that short-term recovery momentum may be improving. If CAP breaks above $0.10017 and holds, traders may watch for a move toward $0.10487. A stronger breakout could bring the previous high of $0.11695 back into focus. 🐻 BEARISH SCENARIO CAP is still down 6.40% over 24 hours, and the price remains below the MA28 at $0.10017. If the recovery loses strength, a move toward $0.09280 could follow. Further weakness could expose the $0.08072 support area. 👀 WHAT TRADERS SHOULD WATCH The $0.10 level is an important short-term test. A confirmed breakout with stronger volume could support further recovery, while rejection could signal renewed selling pressure. 💬 WHAT'S YOUR CAP PRICE TARGET? 🚀 $0.105 — Recovery continues 🔥 $0.117 — Previous high retest 📉 $0.093 — Support retest Share your prediction in the comments! ⚠️ Remember: A sharp rebound does not guarantee a trend reversal. Crypto prices can move quickly in either direction, so manage your risk carefully. #ByXIMPACT
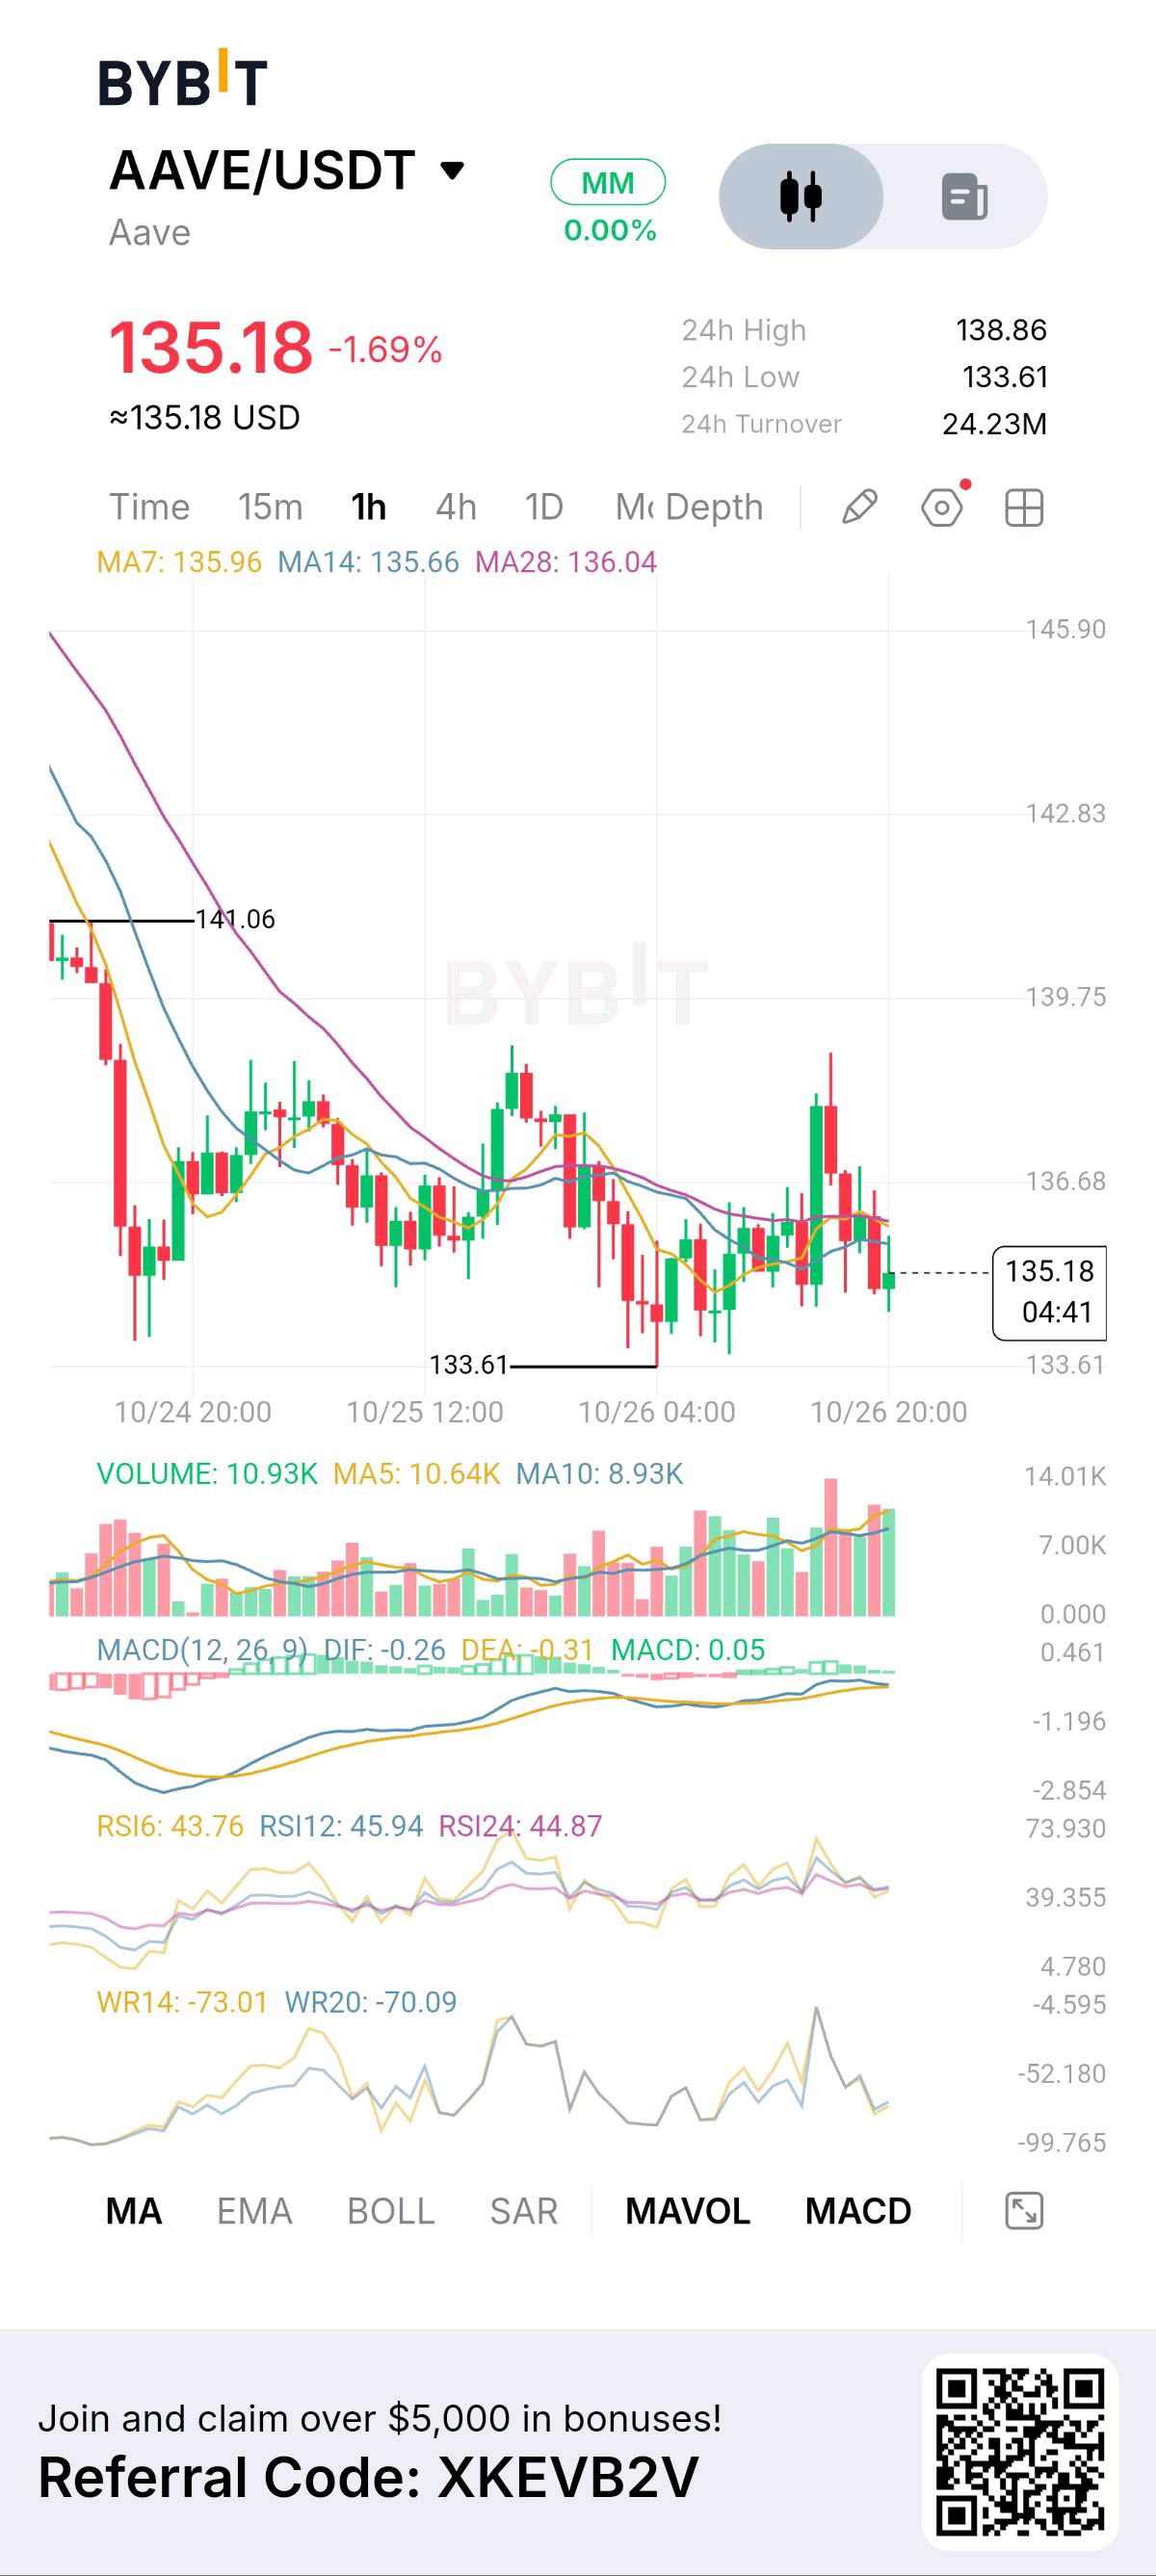
🚨 AAVE/USDT MARKET ALERT! 🔥 WILL AAVE BOUNCE BACK OR DROP FURTHER? $AAVEUSDT is trading at $135.18, down 1.69%, as sellers continue to put pressure on the market. After falling from the $141.06 area, AAVE is struggling to establish a strong upward trend. But could the current consolidation be setting the stage for a recovery? 📊 KEY LEVELS TO WATCH 💰 Current Price: $135.18 📈 24H High: $138.86 📉 24H Low: $133.61 🛡️ Major Support: $133.61 🚧 Immediate Resistance: $135.66–$136.04 ⚡ Next Resistance: $136.68 🎯 Higher Resistance: $138.86 🐻 BEARISH SCENARIO AAVE is trading below its MA7, MA14, and MA28, indicating short-term weakness. If sellers push the price below $133.61, further downside pressure could develop. 🐂 BULLISH SCENARIO If buyers defend the $133.61 support zone and reclaim the $136.04–$136.68 area, AAVE could attempt a recovery toward $138.86. 📉 WHAT THE INDICATORS SAY The RSI readings are below 50, suggesting that momentum remains somewhat weak. The MACD histogram is slightly positive, hinting at a possible improvement in short-term momentum, but a confirmed reversal has not yet appeared. 🔥 THE BIG QUESTION Will AAVE hold support and recover, or will bears push it to new short-term lows? 💬 WHAT'S YOUR PRICE TARGET? 🚀 $140 — Bullish recovery 📉 $133 — Support retest 🔥 $130 — Further downside Drop your prediction in the comments and let's discuss the next possible move! ⚠️ These levels are based on the chart provided, not guaranteed outcomes. Always manage risk and avoid trading based on predictions alone. #ByXIMPACT
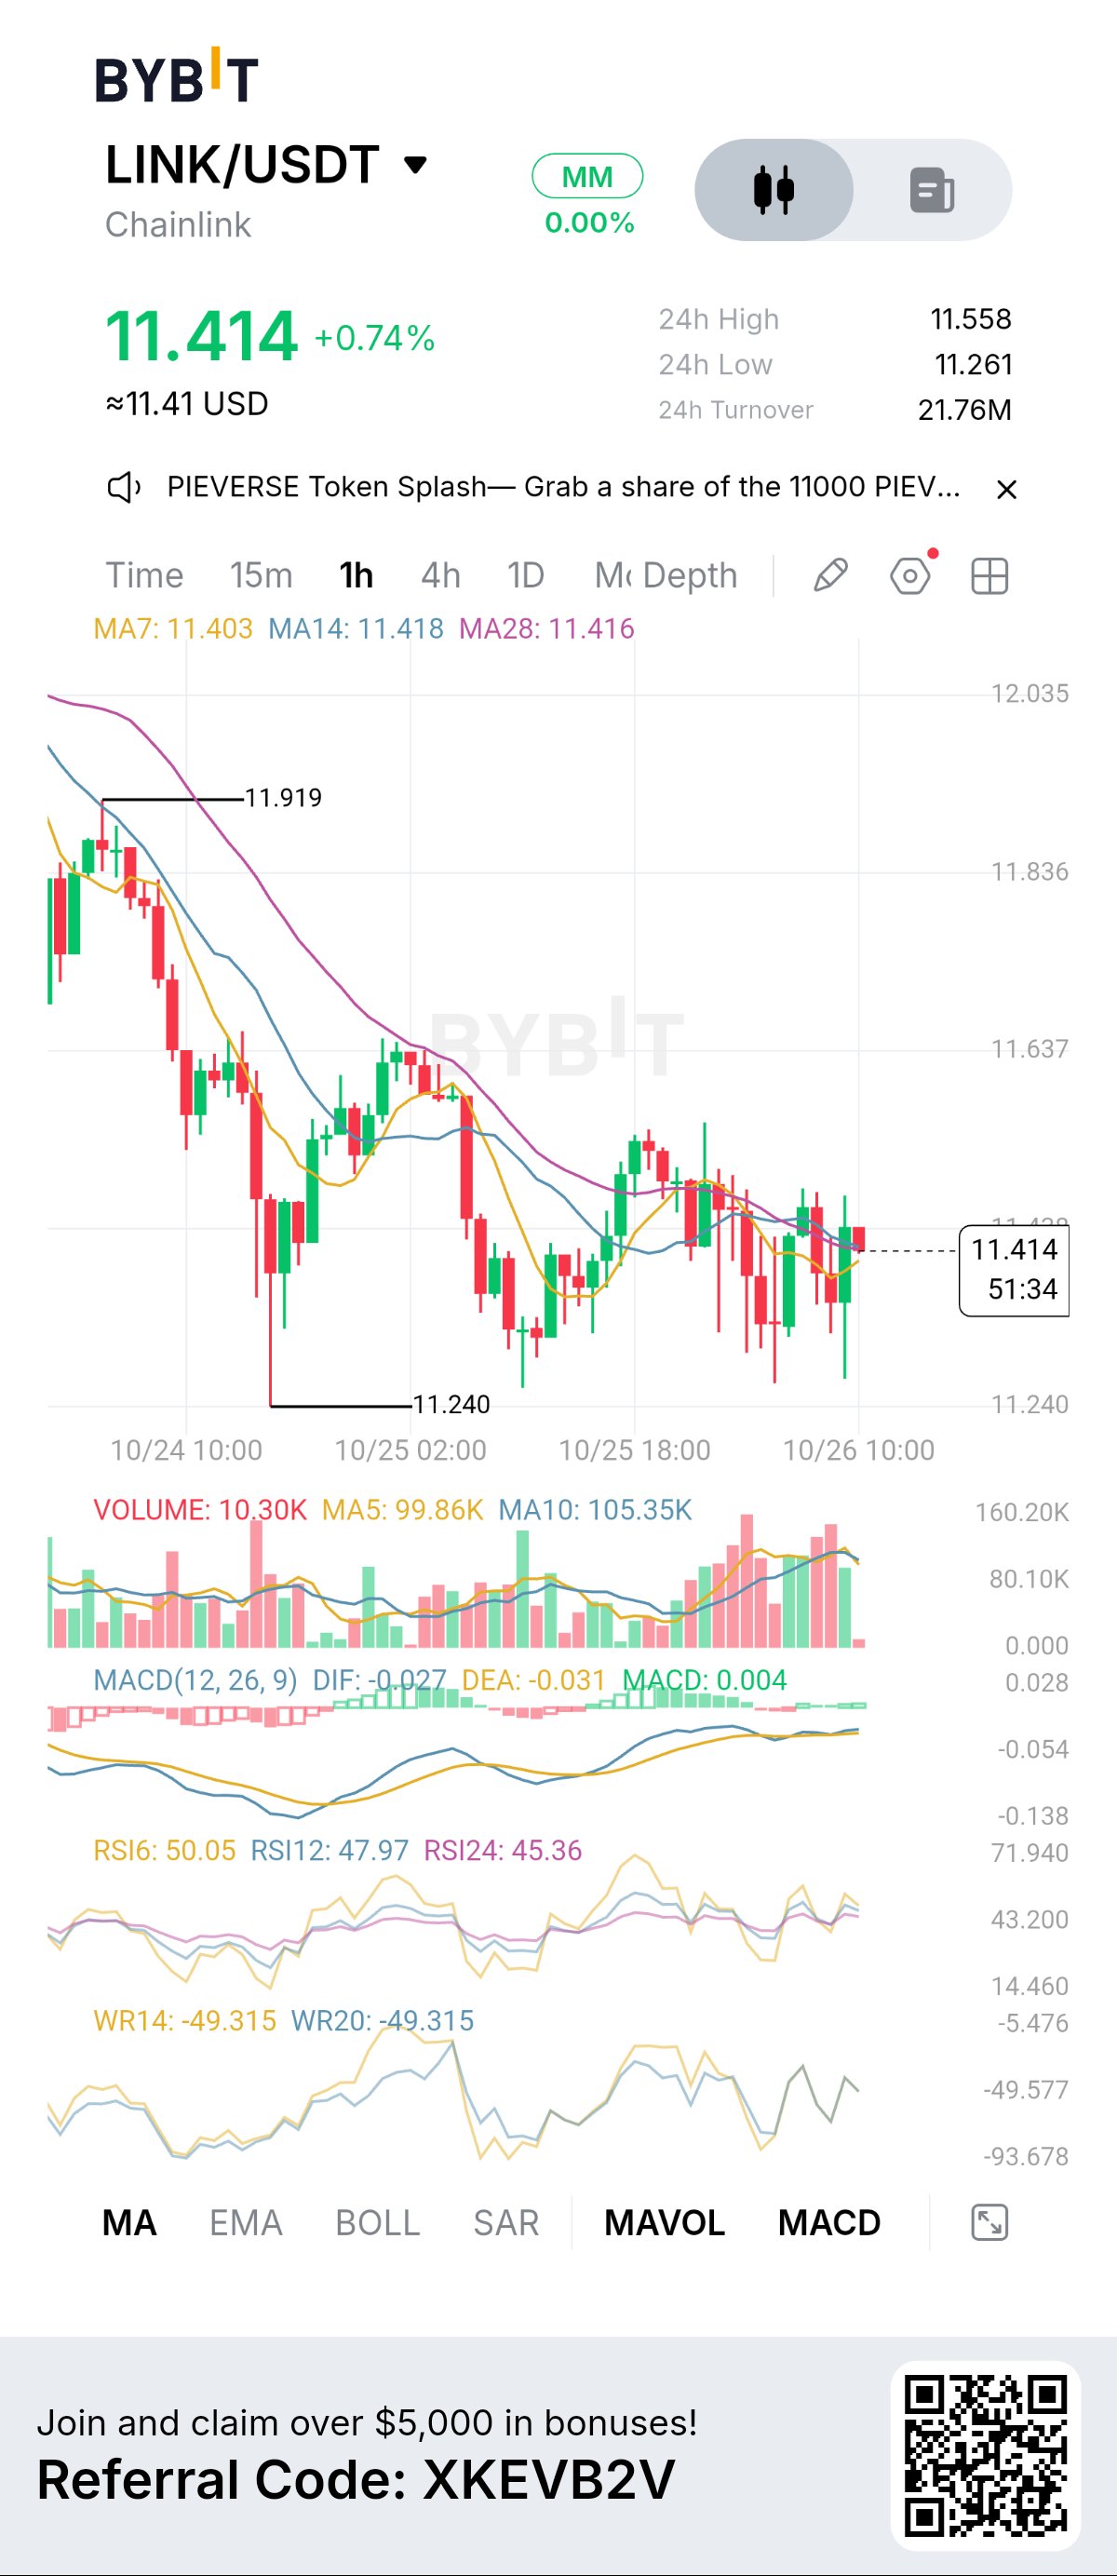
🚨 LINK/USDT ALERT! 🔥 CHAINLINK IS FIGHTING FOR A BREAKOUT! $LINKUSDT is trading at $11.414, up 0.74%, as buyers attempt to regain control after a recent downward move. The chart shows LINK consolidating near $11.41, with price action caught around its short-term moving averages. The big question is whether buyers can build enough momentum for a stronger recovery. 📊 KEY LEVELS TO WATCH 💰 Current Price: $11.414 🟢 24H High: $11.558 🔴 24H Low: $11.261 🛡️ Key Support: $11.261–$11.240 🚧 Immediate Resistance: $11.429 ⚡ Next Resistance Zone: $11.637 🎯 Major Resistance: $11.919 🐂 BULLISH SCENARIO If LINK breaks above the $11.429 area and sustains buying pressure, traders may watch for a move toward $11.558 and then $11.637. A stronger breakout could open the door to a retest of $11.919. 🐻 BEARISH SCENARIO If buyers fail to maintain momentum, LINK could revisit $11.261. A breakdown below the $11.240 support zone may signal further weakness. 📉 WHAT THE INDICATORS SHOW The RSI readings are close to neutral, suggesting a balance between buying and selling pressure. The MACD histogram is slightly positive, hinting at a possible short-term improvement in momentum, but confirmation is still needed. 🔥 THE NEXT MOVE COULD BE IMPORTANT! Will Chainlink break upward, or will sellers push the price back toward support? 💬 DROP YOUR PREDICTION BELOW! 🚀 LINK to $12.00 📉 LINK back to $11.20 ⏳ More sideways movement? Let's hear your market analysis! ⚠️ Crypto markets are volatile. These are technical levels from the chart, not guaranteed outcomes. Always manage risk before trading. #ByXIMPACT
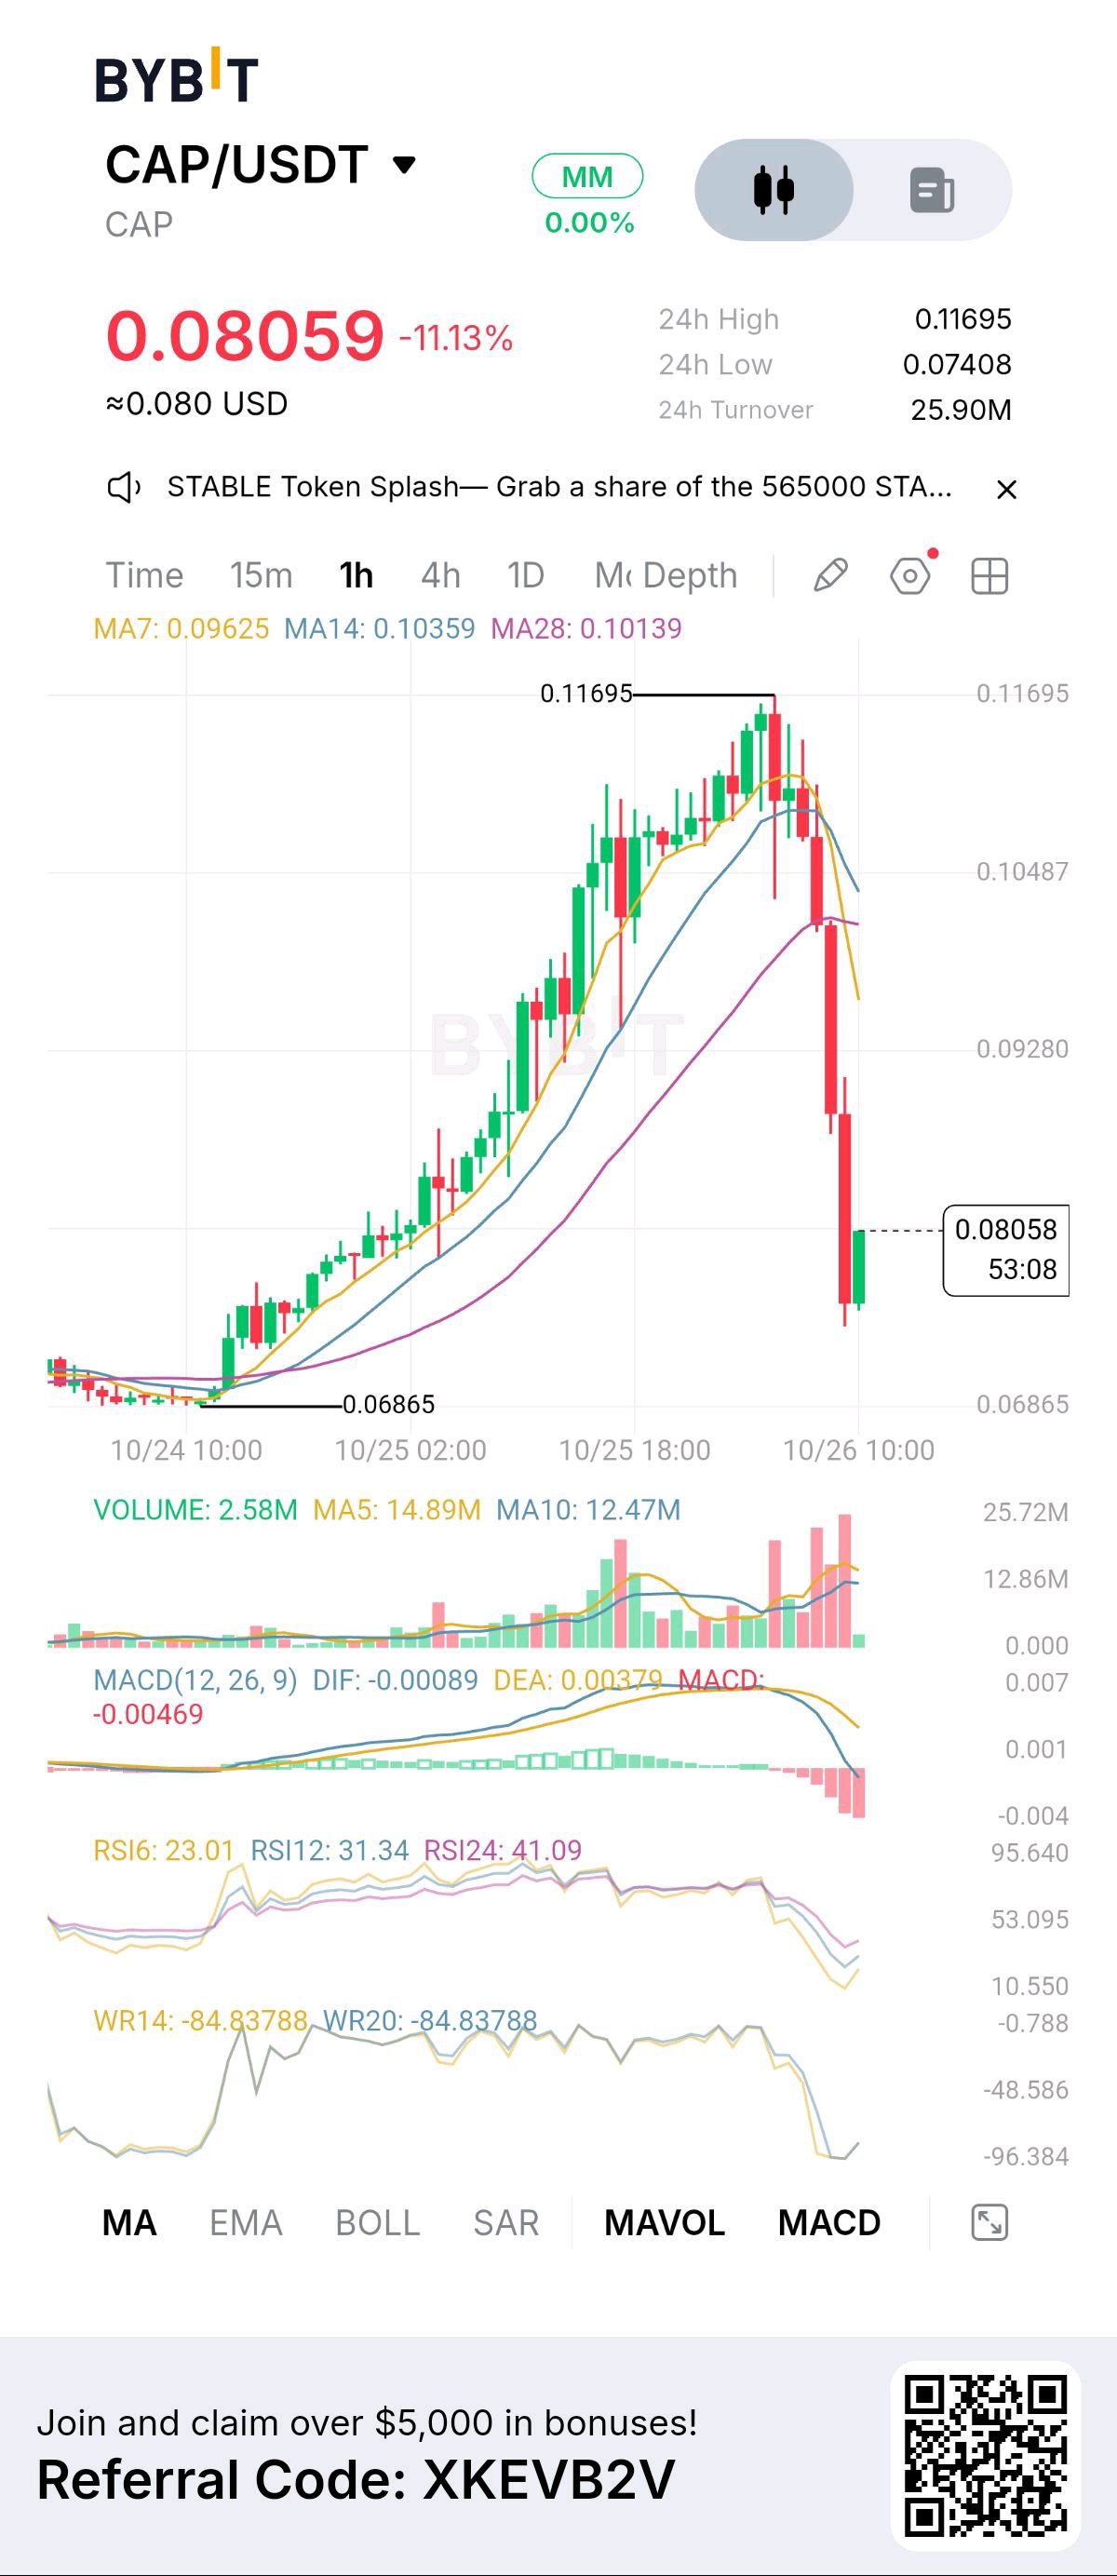
🚨 CAP/USDT CRASH ALERT! 📉🔥 WILL CAP RECOVER OR DROP EVEN FURTHER? $CAPUSDT is facing intense selling pressure! The price is currently around $0.08059, down 11.13%, after a sharp rejection from the $0.11695 high. The latest chart shows a dramatic sell-off, rising trading volume during the decline, and weak momentum. Traders are now watching closely for signs of stabilization or another move lower. 📊 KEY MARKET LEVELS 💰 Current Price: $0.08059 🔺 24H High: $0.11695 🔻 24H Low: $0.07408 🛡️ Immediate Support: $0.07408 ⚡ Resistance Zone: $0.09280 🚧 Major Resistance: $0.10487 🐻 BEARISH SCENARIO CAP is trading below its MA7, MA14, and MA28, indicating strong short-term weakness. The MACD is negative, while the RSI readings show oversold conditions on shorter periods. If selling pressure continues and the $0.07408 low breaks, further downside may follow. 🐂 BULLISH RECOVERY SCENARIO The RSI suggests that a short-term rebound is possible after the steep decline. If buyers defend the recent low and push the price higher, $0.09280 becomes an important resistance level to watch. However, an oversold reading does not guarantee a recovery. Buyers need to demonstrate sustained strength before a reversal can be confirmed. 🔥 THE BIG QUESTION Is this a temporary shakeout before a recovery, or the beginning of a deeper correction? 💬 What's your prediction for CAP? 🚀 Recovery toward $0.10 📉 Another drop below $0.074 ⏳ Sideways consolidation before the next move Share your analysis in the comments! ⚠️ Remember: High volatility creates significant risk. Avoid chasing falling prices, use proper risk management, and never assume a rebound is guaranteed. #ByXIMPACT
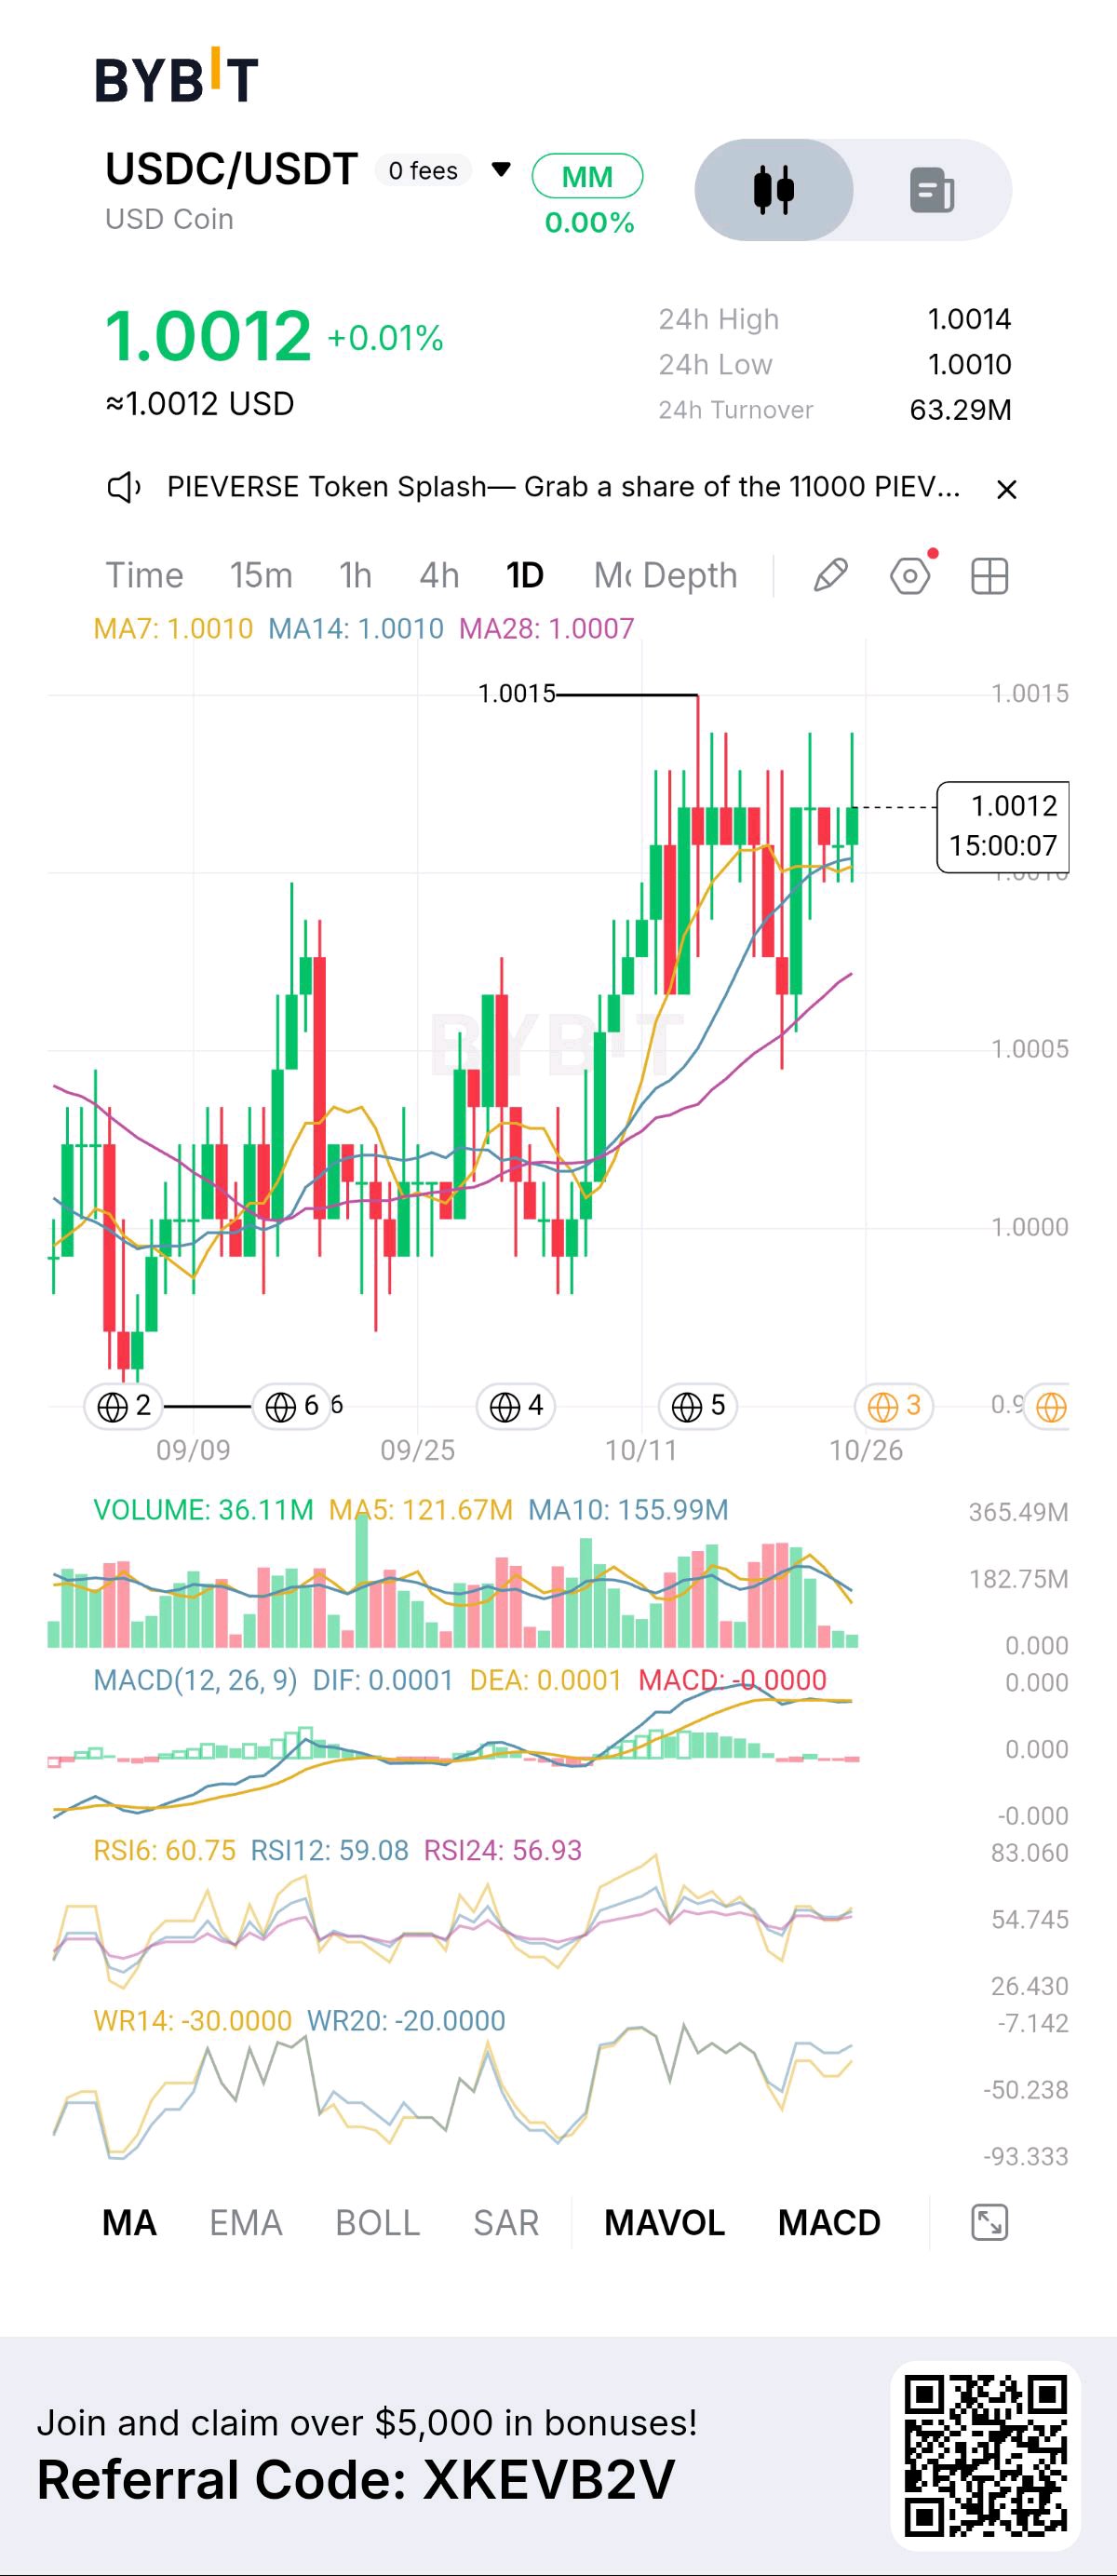
🚨 USDC/USDT MARKET WATCH! 🔥 THE STABLECOIN BATTLE CONTINUES! $USDCUSDT is trading at $1.0012, up 0.01%, as the pair continues to trade close to the $1.00 peg. 📊 KEY MARKET DETAILS 💰 Current Price: $1.0012 📈 24H High: $1.0014 📉 24H Low: $1.0010 🟢 MA7: $1.0010 🔵 MA14: $1.0010 🟣 MA28: $1.0007 🔥 WHAT DOES THE CHART TELL US? USDC/USDT is holding slightly above $1.00, with the moving averages suggesting a mild upward bias on the daily chart. RSI readings around 57–61 indicate positive momentum without showing an overbought condition. However, the MACD is nearly flat, suggesting limited momentum and the possibility of continued sideways trading. 🟢 BULLISH SCENARIO If buying pressure continues, the price could test the $1.0014 resistance and potentially approach $1.0015. 🔴 BEARISH SCENARIO If the price loses momentum, it could return toward $1.0010, with $1.0007 as another level to watch. 💡 IMPORTANT: USDC is a stablecoin designed to track the US dollar, so these small price movements generally reflect minor differences between USDC and USDT rather than a typical high-volatility crypto rally. 💬 WHAT'S YOUR TAKE? Will USDC/USDT remain above $1.0010, or will it move closer to $1.0000? Share your thoughts below and join the discussion! Trade responsibly. Small price differences can disappear quickly, and fees may outweigh potential gains. #ByXIMPACT
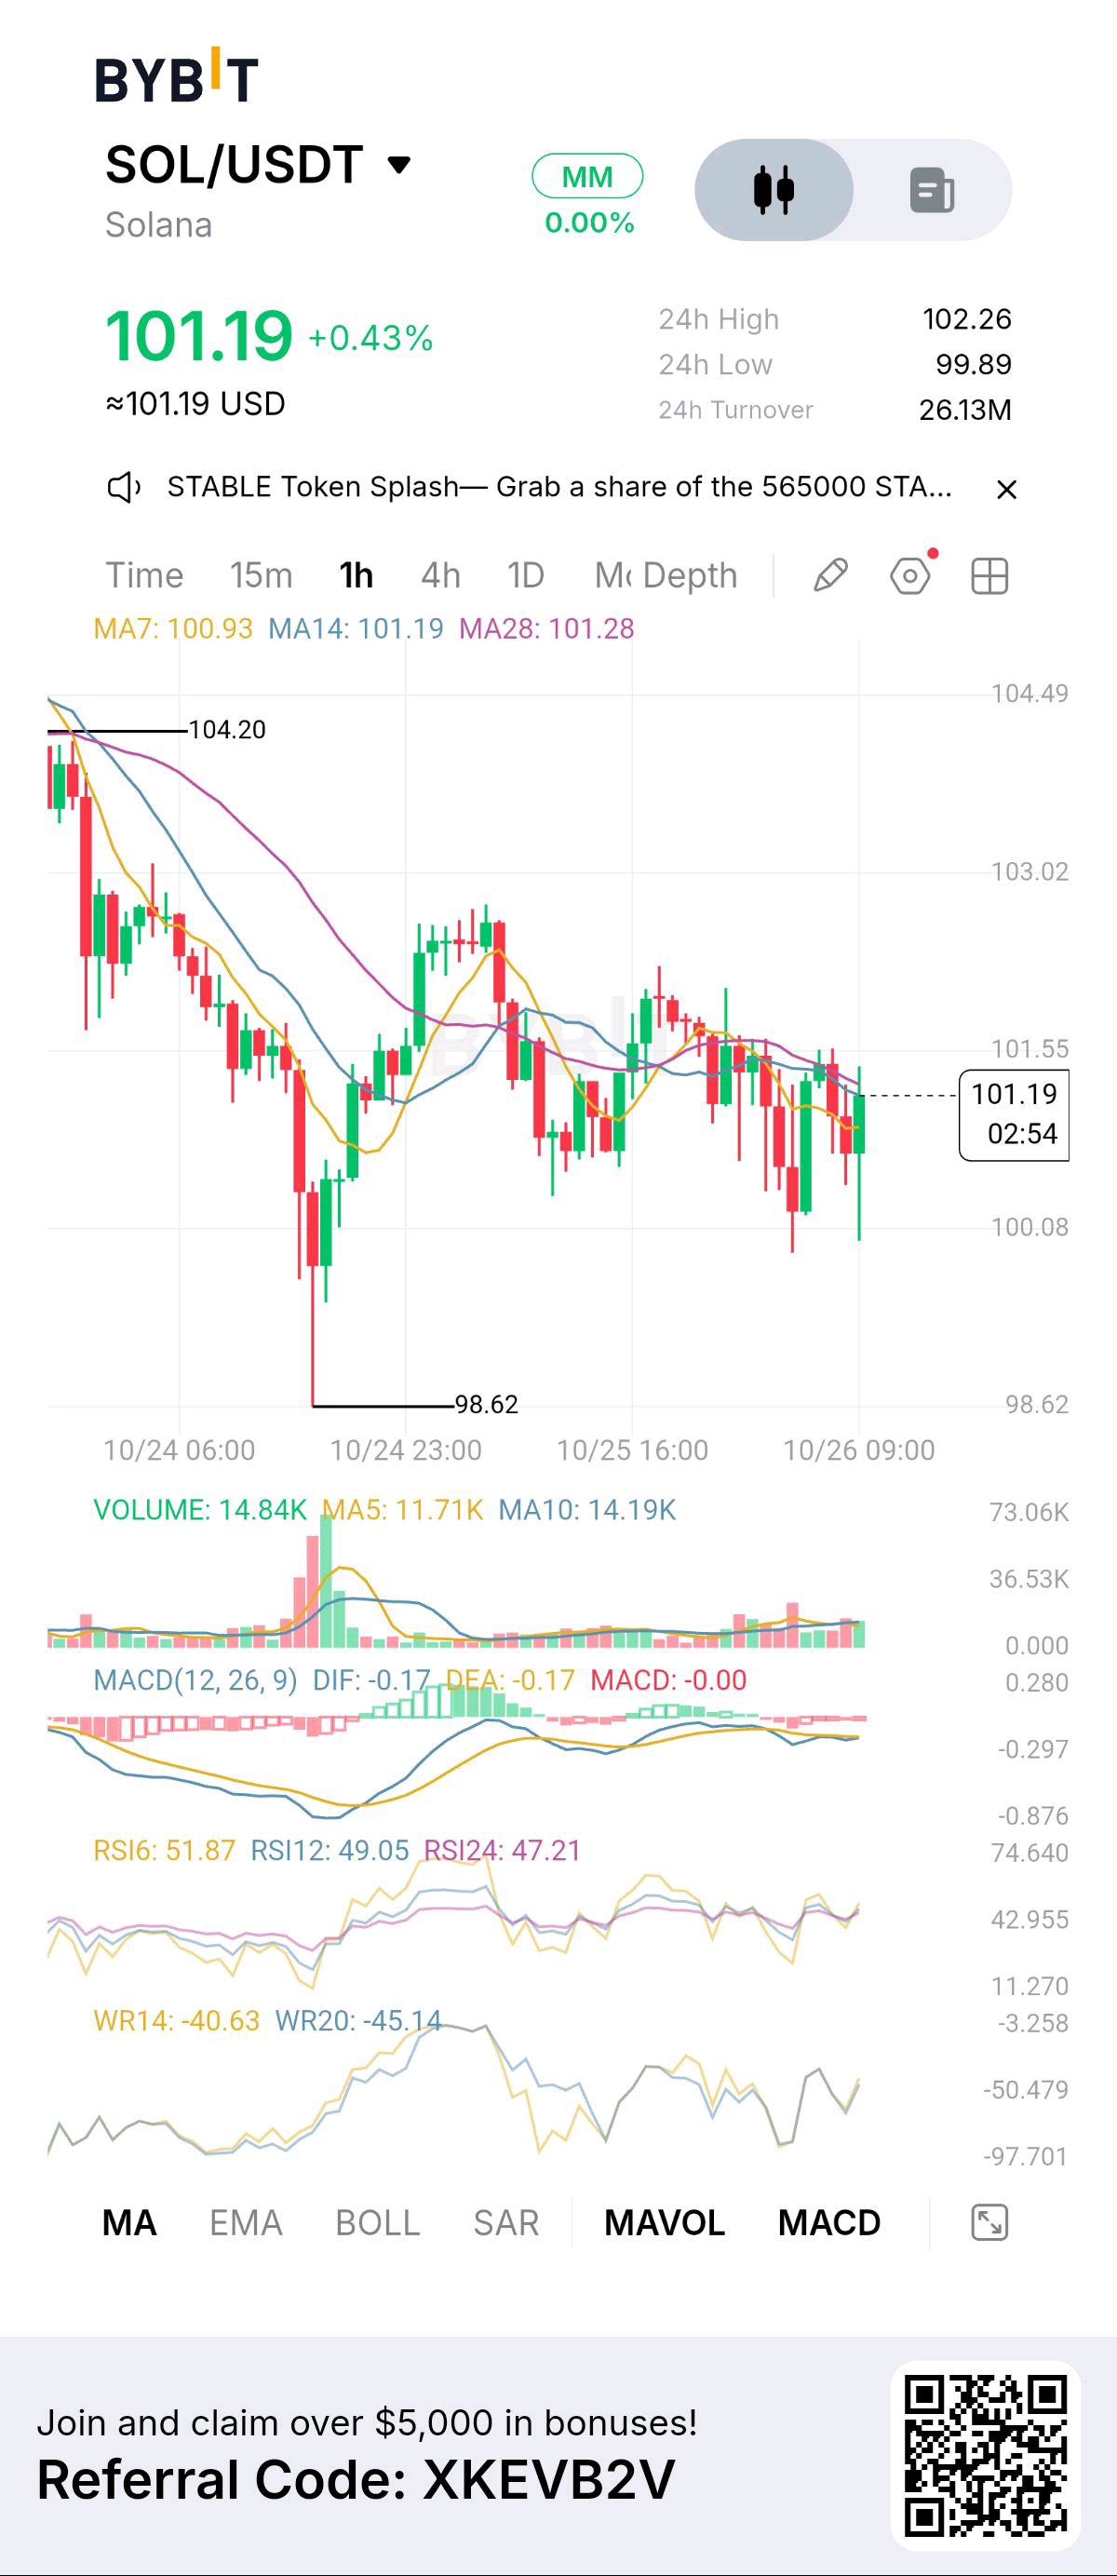
🚨 SOLANA ALERT! SOL/USDT IS AT A CRITICAL TURNING POINT! 🔥🚀 $SOLUSDT is trading around $101.19, showing a 0.43% gain as the market watches closely for its next major move. Bulls are attempting to regain control, but will they have enough strength to push SOL toward higher resistance levels? 📊 SOL/USDT MARKET BREAKDOWN 💰 Current Price: $101.19 📈 24H High: $102.26 📉 24H Low: $99.89 💎 Key Resistance: $101.55 – $102.26 🛡️ Immediate Support: $100.08 ⚠️ Major Support: $98.62 🐂 BULLISH SCENARIO If buyers build momentum and SOL breaks above $102.26 with strong trading volume, the price could attempt a move toward $103 and potentially $105. However, confirmation is important before assuming the rally will continue. 🐻 BEARISH SCENARIO If SOL fails to break resistance and selling pressure increases, the price could revisit $100.08. A breakdown below that area may expose the $99–$98.62 support zone. 📉 WHAT THE INDICATORS ARE SAYING The RSI readings are near the neutral zone, suggesting that neither buyers nor sellers have overwhelming control. The MACD is close to flat, indicating limited momentum and the possibility of further sideways movement before a clearer trend develops. 🔥 MY WATCHLIST LEVELS Above $102.26: Watch for a possible bullish breakout. Around $100.08: Watch for buyers defending support. Below $98.62: Watch for additional downside pressure. 💬 LET'S TALK, TRADERS! Where do you think Solana is heading next? 🚀 $105 — Bullish breakout? 📉 $98 — Another dip? ⏳ $101 — More sideways action? Drop your prediction in the comments and let's see who reads the market correctly! Trade carefully, manage your risk, and remember that technical levels are possibilities, not guarantees. #ByXIMPACT
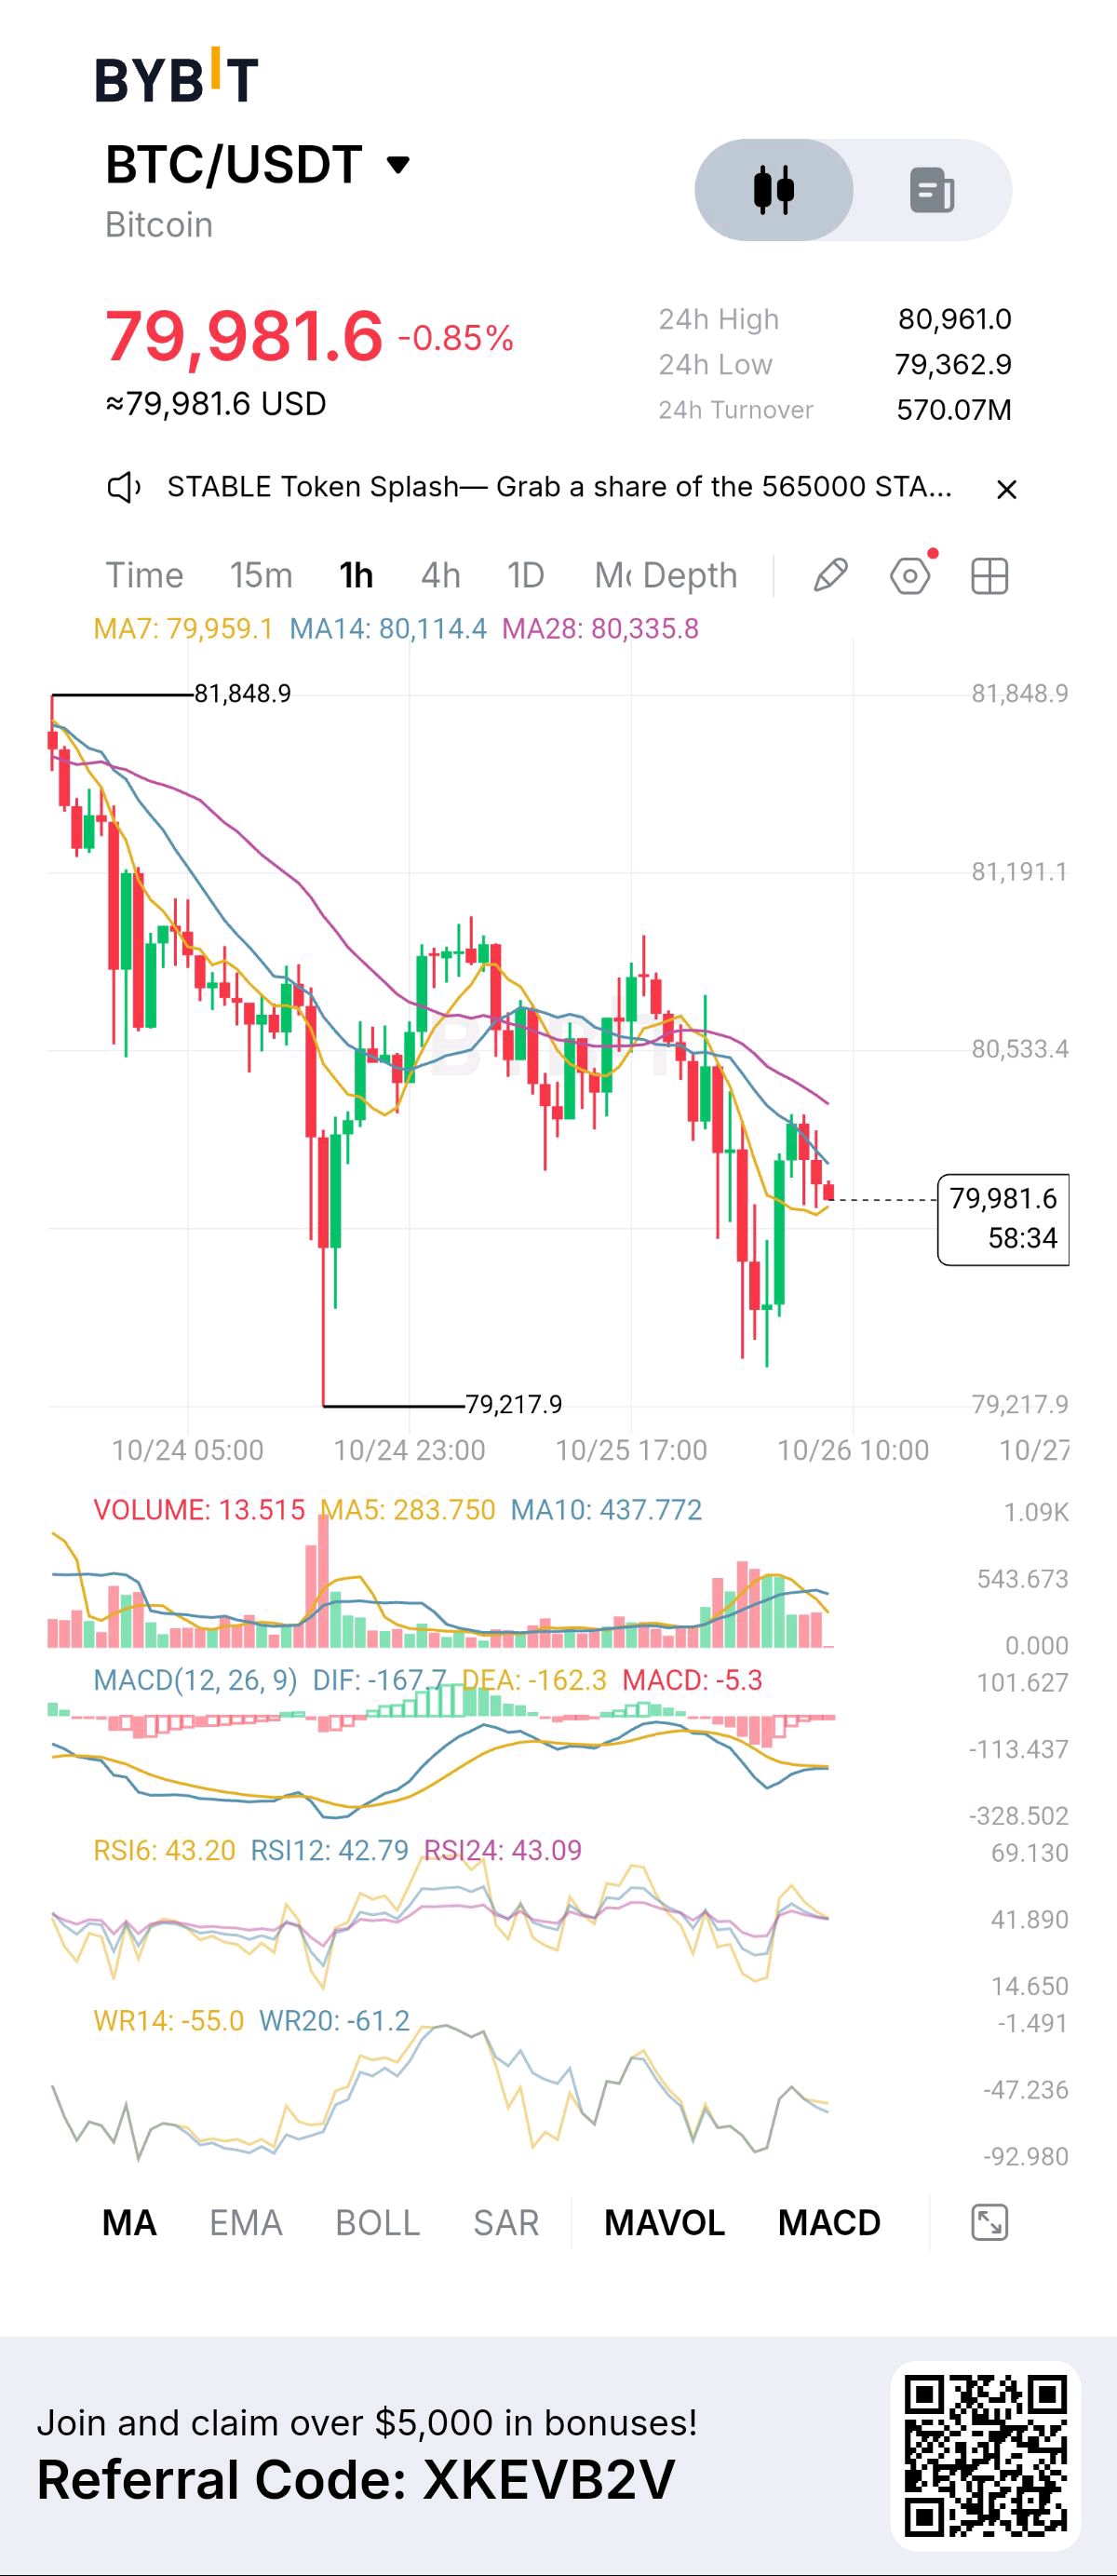
🚨 BITCOIN MARKET UPDATE: BTC FACES SELLING PRESSURE — WHAT HAPPENS NEXT? ₿📉 $BTCUSDT is trading around $79,981.60, down 0.85%, as sellers continue to put pressure on the market. 📊 KEY MARKET DATA 💰 Current price: $79,981.60 📉 24H change: -0.85% 🔺 24H high: $80,961.00 🔻 24H low: $79,362.90 📍 Recent chart low: $79,217.90 📊 24H turnover: $570.07M 📉 WHAT IS THE CHART SHOWING? On the 1-hour chart, BTC has been trending downward from the $81,800 area. Although buyers attempted a recovery from the recent low, the price is still struggling to regain its moving-average levels. The moving averages currently stand at: - MA7: $79,959.10 - MA14: $80,114.40 - MA28: $80,335.80 BTC is trading below the MA14 and MA28, suggesting that short-term selling pressure remains present. 🔥 MOMENTUM CHECK The MACD remains negative, while RSI readings are around 42–43. This suggests that bearish momentum is still present, although the market is not yet showing an extreme oversold reading. 👀 IMPORTANT LEVELS TO WATCH 🟢 Support: $79,362–$79,218 🔴 Resistance: $80,114–$80,336 🚀 Next upside level: $80,961 If buyers regain control and push BTC above the resistance zone, a recovery toward $80,961 could come into focus. However, if Bitcoin breaks below the recent support area, further downside pressure may develop. ⚡ THE BIG QUESTION: Will Bitcoin recover above $80,300, or will sellers push the price lower? Traders should watch price action and volume closely before making any decisions. The next few hourly candles may help clarify the market's direction. ⚠️ Risk reminder: This analysis is based on the chart provided, not a guarantee of future price movements. Always manage risk carefully when trading cryptocurrency. ₿ BITCOIN IS AT A CRITICAL SHORT-TERM DECISION ZONE. KEEP WATCHING! 🔥📊 #ByXIMPACT