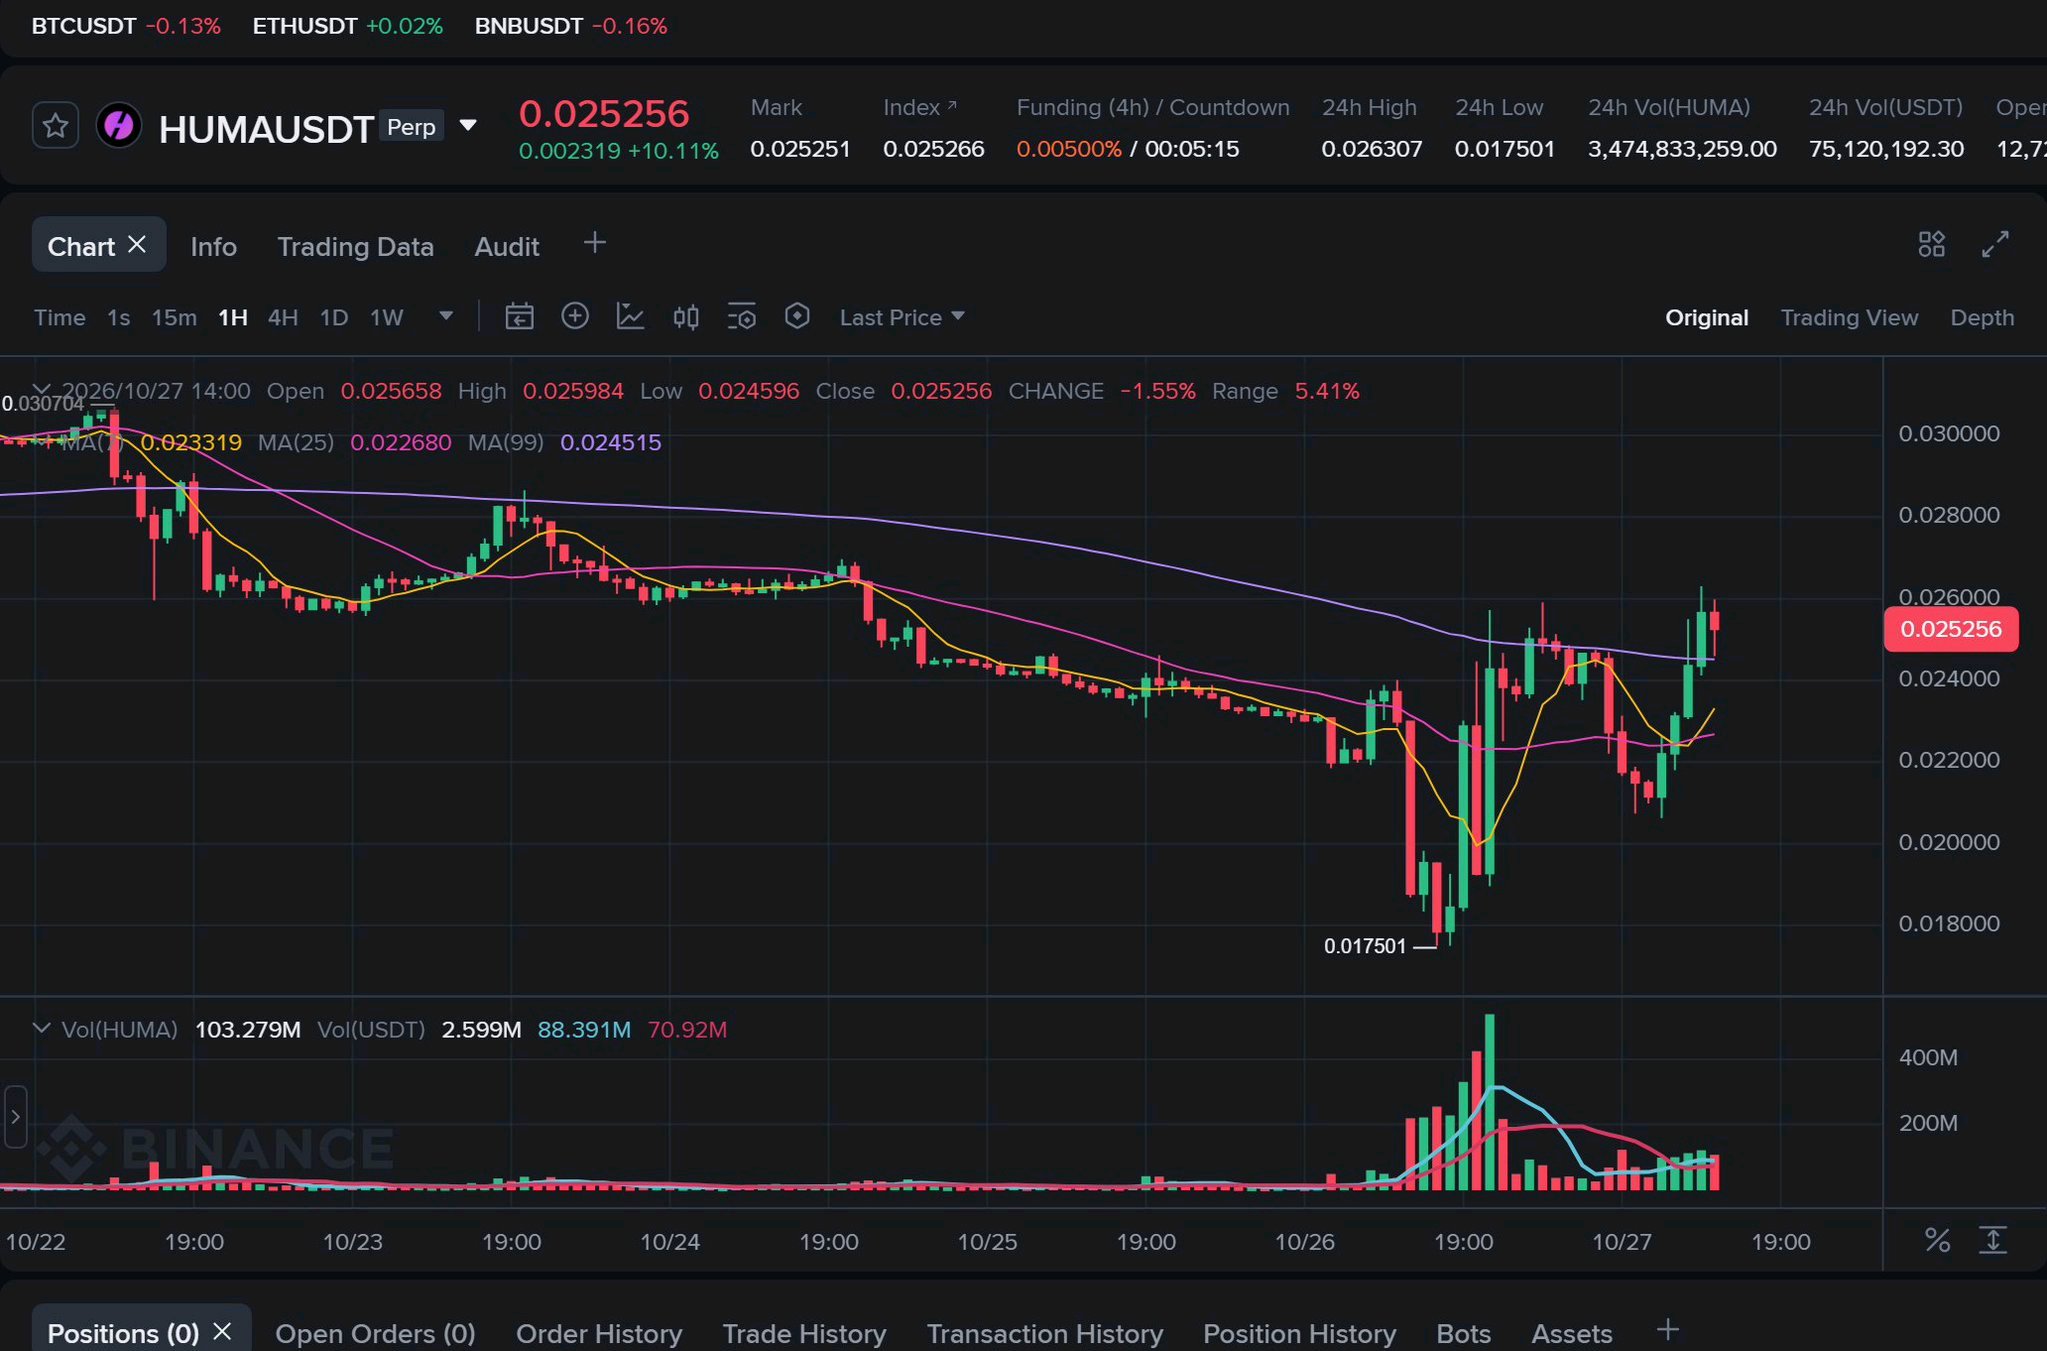
$HUMA (Huma Finance) — Perpetual Trade Plan
📊 Snapshot Current Price $0.02569 24h Change 🚀 +26.86% Market $HUMAUSDT Linear Perpetual Overall Sentiment: 48/100—Neutral --- 🚨 Key Warning — Token Unlock Pressure Headline Signal Significant HUMA token unlocks scheduled—large supply hitting market. 🔴 Bearish—sell pressure HUMA among 16 altcoins with large upcoming unlocks 🔴 Bearish—dilution risk Trillion-dollar consumer loan market article (Huma Finance's core thesis) 🟢 Bullish—narrative support Token unlocks are a direct supply-side headwind—newly unlocked tokens often get sold immediately by early investors/team. A +26.86% pump into a scheduled unlock is a classic pump-before-dump pattern worth watching carefully. --- 🐋 Capital Flow — Slightly Bearish Smart Money Metric Value Whale Long Value: $351K Whale Short Value: $387K Long/Short Ratio 0.9:1 — Slightly Short Smart Money Bias 🟡 Slightly Bullish (fund side) Top Trader Position Rate 102%—near neutral Funding Rate (latest) -0.0075%—shorts paying longs (mild squeeze) Open Interest: $69.5M (↓ from $70M, essentially flat) Whale positioning is slightly short (0.9:1), while the funding rate is mildly negative—a modest squeeze is in play but nothing dramatic. Flat OI alongside a 26.86% price pump is a divergence warning—the move isn't attracting new capital, suggesting it may be thinly supported. --- 🗝️ Key Levels Short-term (5m)—price at the top of Bollinger Bands: Level Price Resistance R1: $0.02535–$0.02558 Resistance R2 ~ $0.02572–$0.02617 Current Price $0.02569 Support S1: ~$0.02482–$0.02467 Support S2 ~$0.02437–$0.02241 Medium-term (4H): Level Price Resistance ~$0.02637–$0.02722 Key Support ~$0.02128–$0.02043 Daily: Level Price Resistance ~$0.03465–$0.03657 Support ~$0.02313–$0.02121 > Price has broken above 4H resistance and is pushing into the $0.02637–$0.02722 zone. Daily resistance is much higher at $0.03465 — significant upside room exists if momentum holds. --- 🧭 Trade Scenarios 🅐 Short—Fade the Pump Into Unlock ⭐ Highest Conviction Token unlock + whales slightly short + flat OI on a 27% pump = classic distribution setup. - Entry: $0.02572–$0.02637 (current area / slight push to 4H resistance) - Target 1: $0.02437 | Target 2: $0.02313–$0.02128 - Stop Loss: Above $0.02722 - Leverage: 3–5x - R:R: ~1:2 → ✅ Favorable 🅑 Long—Squeeze Continuation (Momentum Play) If negative funding persists and shorts continue getting squeezed past $0.02637: - Entry: Clean 4H close above $0.02637 with volume - Target 1: $0.02722 | Target 2: $0.02892–$0.03300 - Stop Loss: Below $0.02467 - Leverage: 3–5x - R:R: ~1:2 → ✅ Acceptable if confirmed - ⚠️ Only enter on breakout confirmation—do not chase current price. 🅒 Pullback Long—Best Risk/Reward Bull Entry Wait for the pump to exhaust and enter at the 4H support zone: - Entry zone: $0.02128–$0.02313 - Target: $0.02569–$0.02722 - Stop Loss: Below $0.02043 - Leverage: 7x - R:R: ~1:3 → ✅ Strong—requires patience --- 💡 Bottom Line > $HUMA has pumped 26.86% into known token unlock headwinds with flat OI and slightly short whale positioning — the hallmarks of a distribution pump. The highest conviction trade is Scenario A (Short at current resistance $0.02572–$0.02637) — fading the pump before unlock-driven sell pressure kicks in. If you're bullish on HUMA's consumer lending narrative longer term, Scenario C (Pullback Long) after the unlock sell-off resolves offers a much cleaner entry. Avoid chasing a long here at the top. --- 🎯 My Concrete Recommendation Parameter Value Direction 🔴 Short Entry Limit at $0.02620 (4H resistance zone) Take Profit 1 $0.02437 Take Profit 2 $0.02313 Stop Loss $0.02730 Leverage 4x Position Size $20–$50 USDT R:R ~1:2 --- Want me to go ahead and place this order for you? #IMPACTbyTrade #MyByXTake

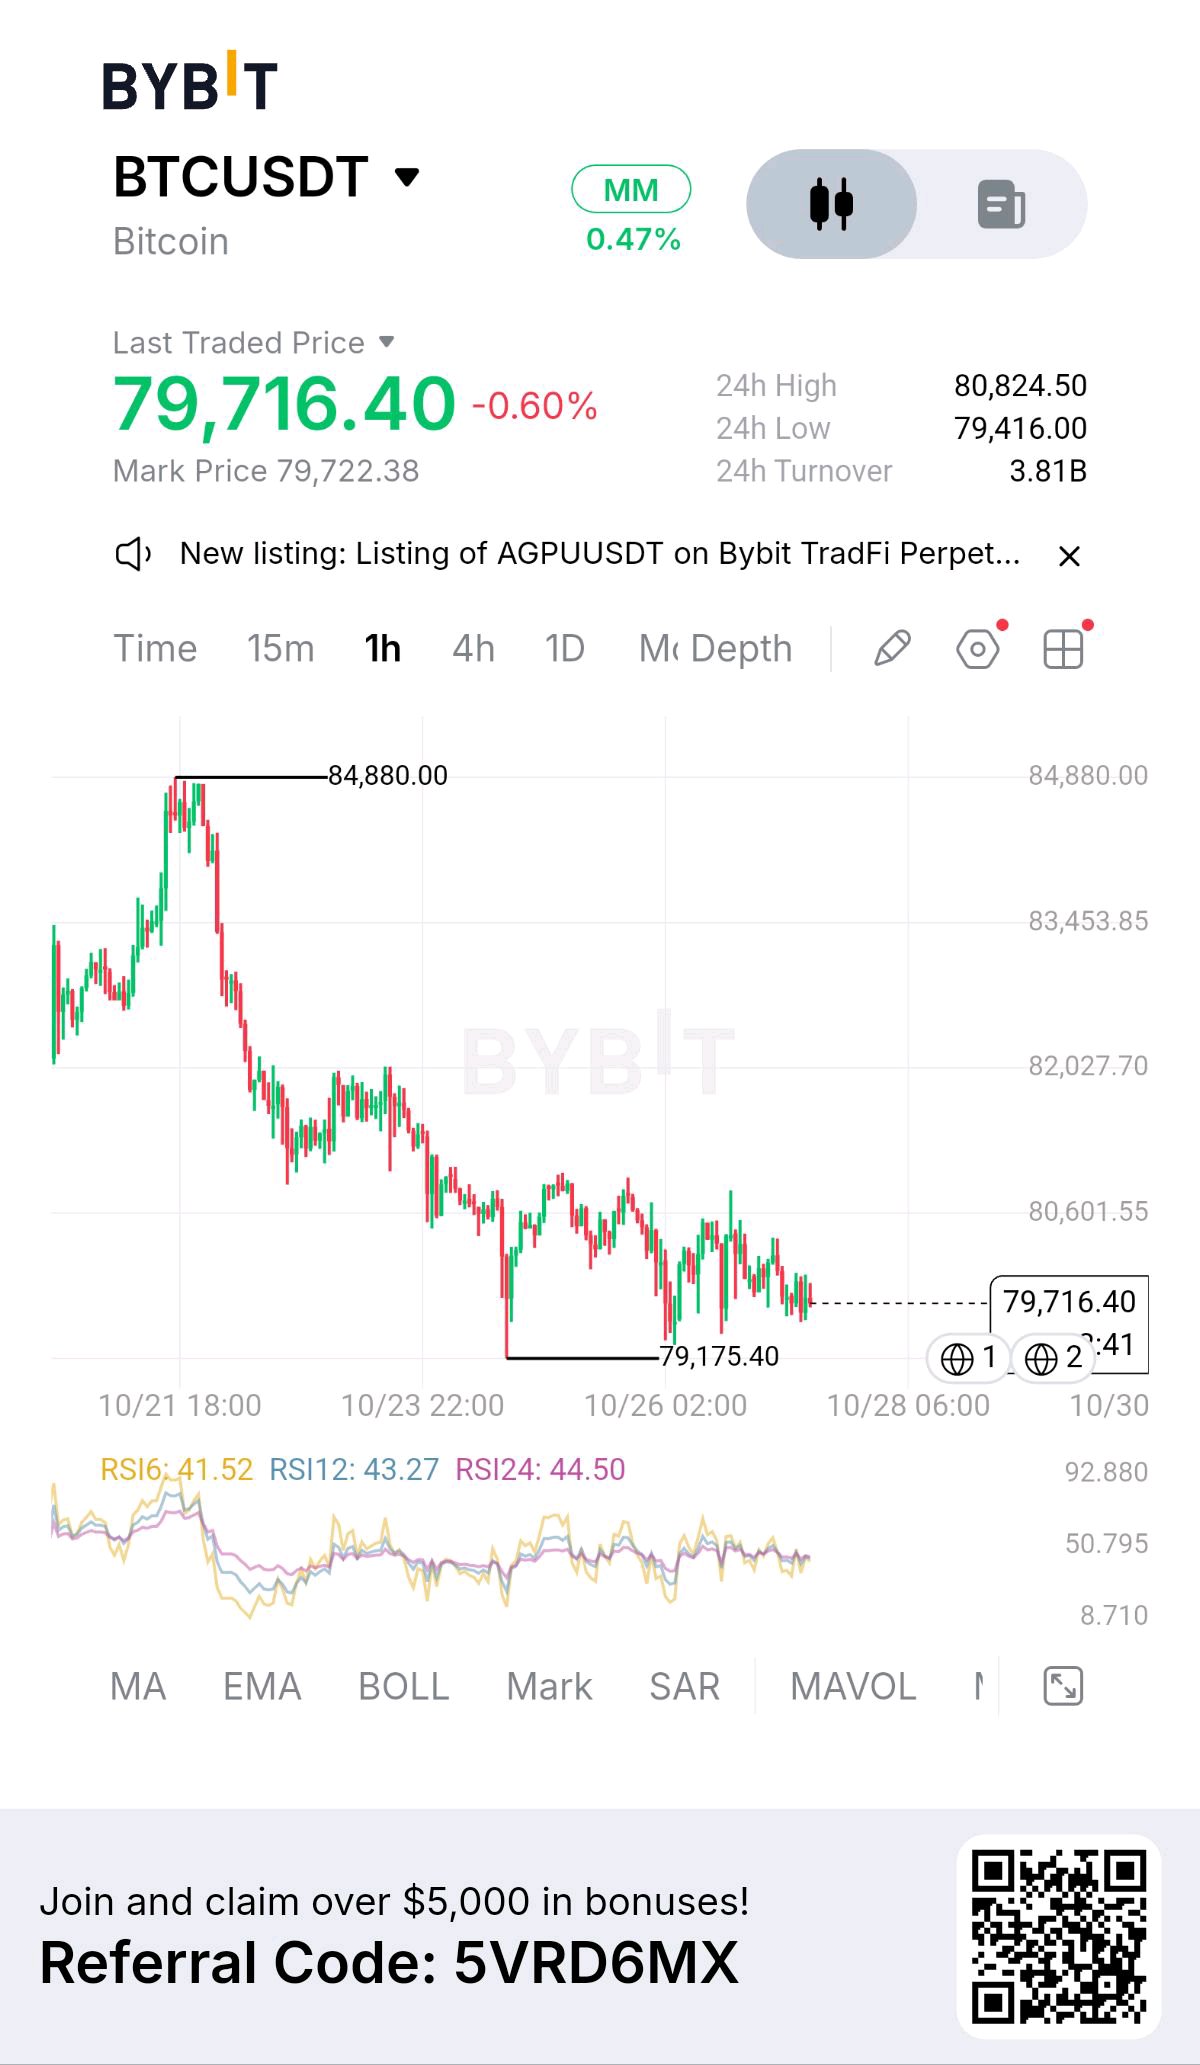
I almost scrolled past this chart, but something caught my attention. Bitcoin is still struggling to recover, and the 1H structure tells a story worth watching. We're currently at $79,716.40, down 0.60%, with a 24H high of $80,824.50 and a low of $79,416.00. Here's what caught my attention. BTC previously reached $84,880, but the rejection triggered a sustained downward move. Since then, price has continued printing lower highs and lower lows, keeping the short-term structure bearish. The important part is that BTC is now trading close to the $79,175.40 support zone, the marked swing low on my chart. This is where I want to pay closer attention. KEY OBSERVATION The RSI readings are: • RSI6: 41.52 • RSI12: 43.27 • RSI24: 44.50 All three are below 50, suggesting that momentum remains weak. However, this alone doesn't confirm another breakdown. Price is hovering near support, but I don't want to mistake a small bounce for a confirmed reversal. MY READ • Bias: Bearish while BTC remains below the recent resistance zones. • Immediate resistance: $80,824.50. • Bullish trigger: A strong 1H close above $80,824.50, followed by a successful retest, could open the door toward $82,027 and then $83,453. • Bearish trigger: A confirmed 1H breakdown below $79,175.40 could expose BTC to further downside. The next targets would depend on the new price structure. • invalidation: A sustained reclaim of resistance and a change in market structure would make me reconsider the bearish bias. One thing I've learned from watching BTC: support levels can look strong right until they fail. That's why I prefer confirmation over prediction. For now, I'm watching $79,175.40 closely. If buyers defend it, we could see a recovery attempt. If sellers break it, I don't want to stand in front of momentum. Would you buy BTC near this support, or wait for confirmation above $80,824? #ByXIMPACT $BTCUSDT


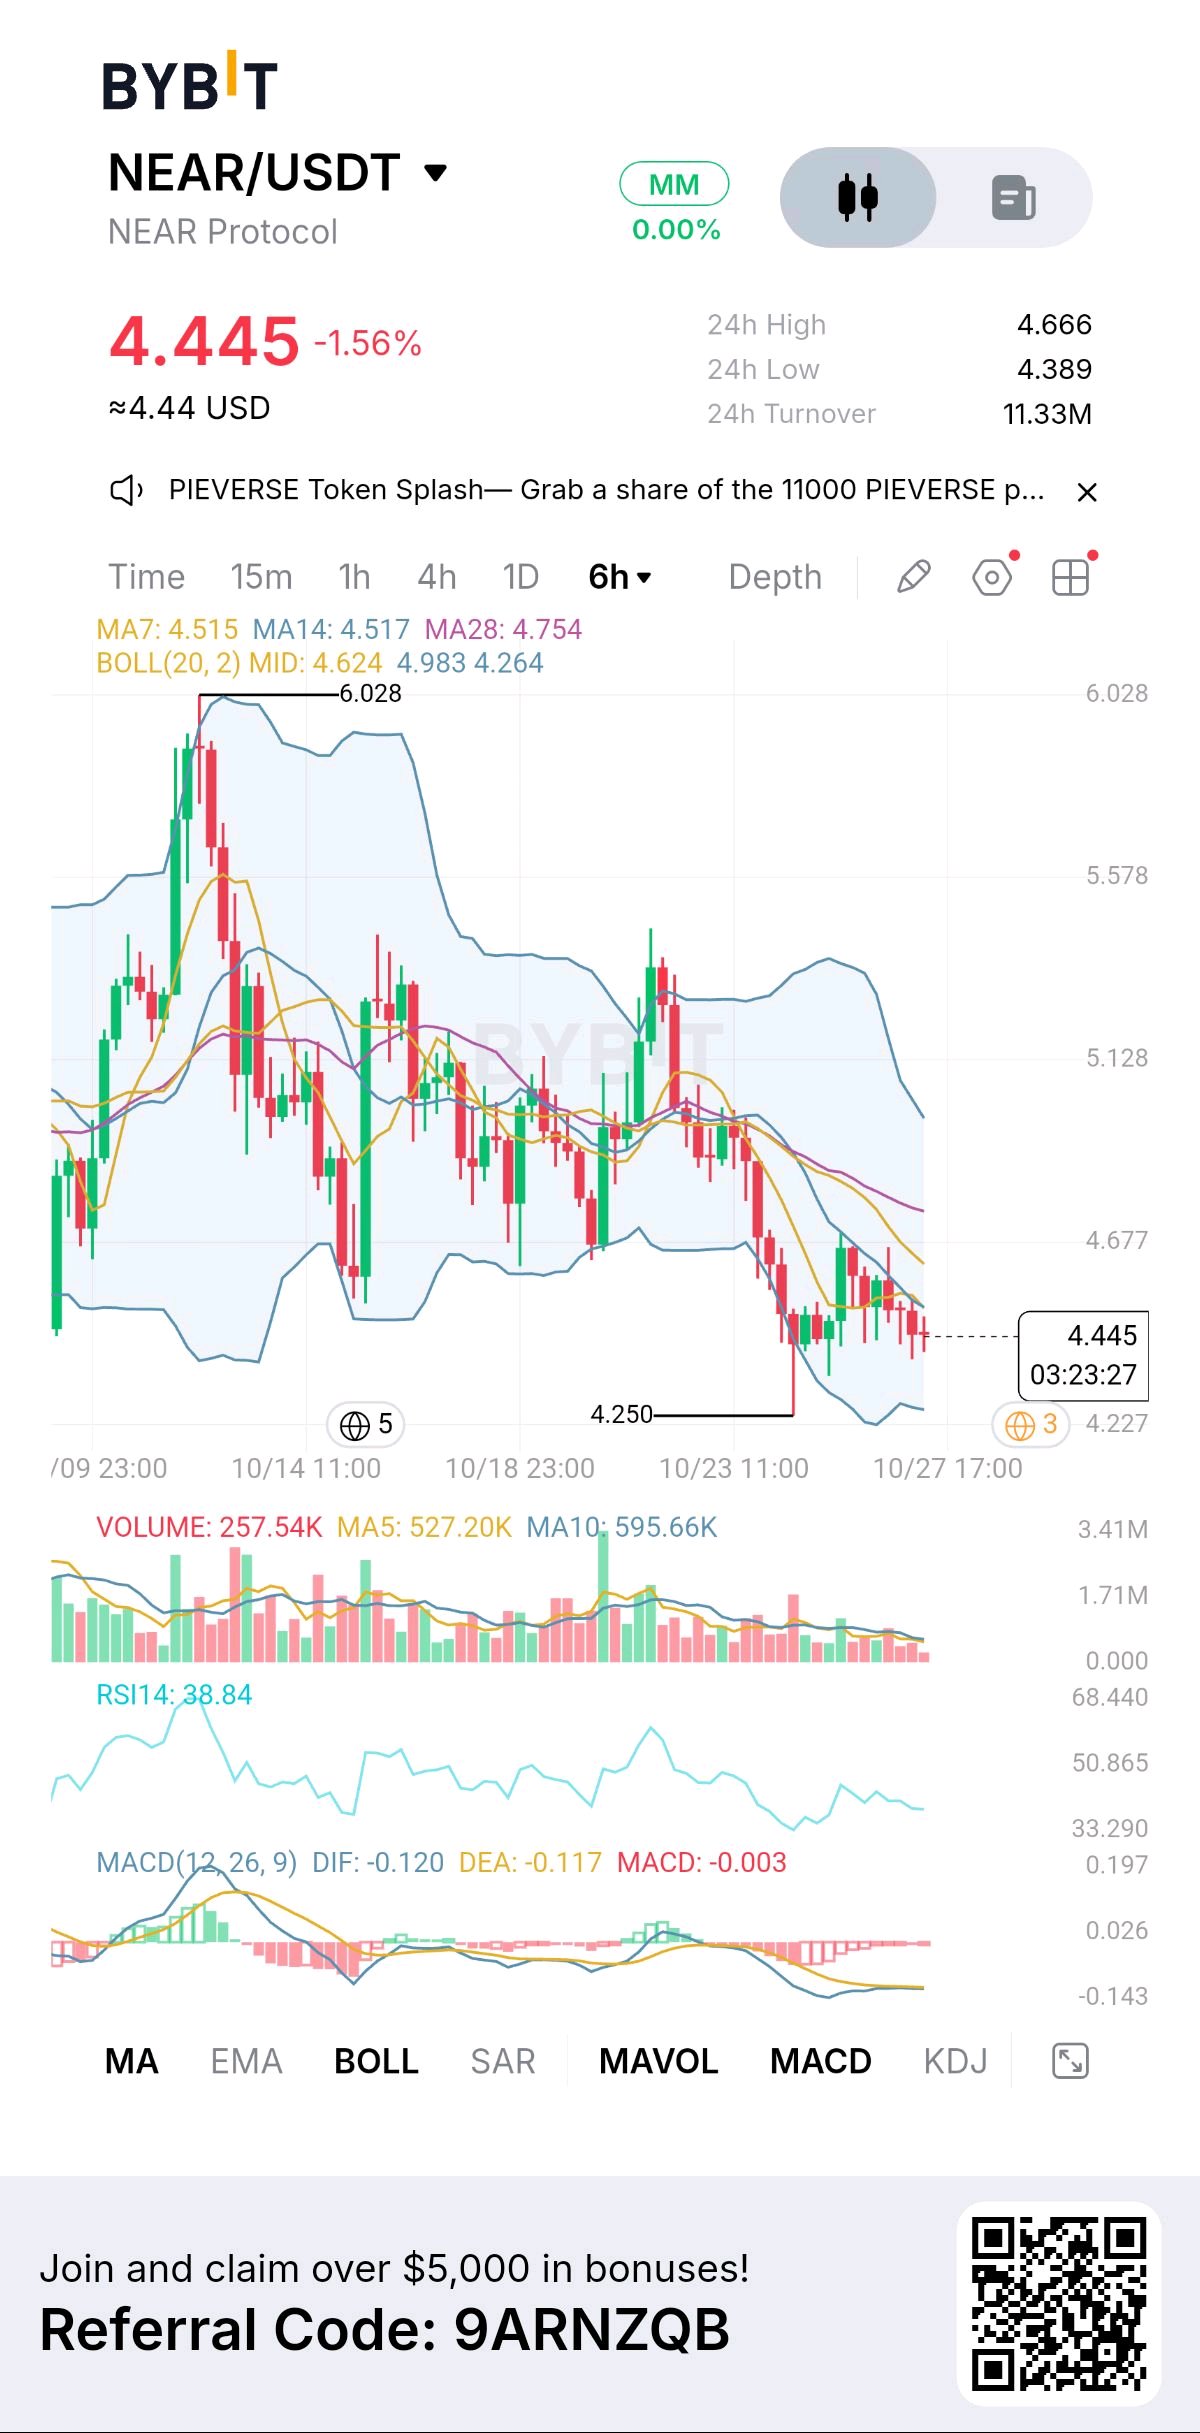
NEAR Protocol The Interesting Part Isn’t the Drop It’s What Price Does Near $4.25. What stands out to me is that NEAR has already suffered a substantial decline, yet the chart still hasn’t produced convincing evidence of a reversal. That creates an interesting conflict: price is approaching an area where buyers previously appeared, but momentum remains weak. A support level is only useful if buyers actually defend it. FACT / The uploaded Bybit chart shows NEAR/USDT at $4.445, down 1.56%, on the 6-hour timeframe. The visible 24-hour high is $4.666, the low is $4.389, and turnover is 11.33M. The chart marks a recent swing low around $4.250 and an earlier peak near $6.028. CURRENT MARKET DATA As of October 27, public trackers put NEAR around $4.45–$4.52, with market capitalization near $5.8–$5.9B, 24-hour volume roughly $500–550M and circulating supply around 1.31B NEAR. These figures fluctuate by exchange and timestamp, unlike the screenshot reading. FUNDAMENTALS NEAR is more than a conventional Layer-1 blockchain. Its focus includes scalable applications, chain abstraction and NEAR Intents, which facilitates cross-chain swaps and asset execution. The interesting question is whether growing product usage translates into durable demand for NEAR, rather than just impressive transaction statistics. TOKENOMICS The supply is effectively fully unlocked, with approximately 1.31B tokens circulating and no fixed maximum supply. NEAR's February 2026 tokenomics update halved maximum annual inflation and activated an Intents fee-sharing mechanism. Product revenue can support buybacks, but further buybacks depend on actual revenue and governance decisions; they are not guaranteed. MACRO + MARKET CONTEXT Bitcoin was hovering near $80,000 and ETH near $2,300 on October 26, while markets awaited the October 28 Federal Reserve decision. Rate expectations, inflation concerns and broader risk appetite could influence altcoin flows. Even strong project fundamentals can struggle when liquidity moves away from altcoins. CHART OBSERVATION The 6-hour structure remains bearish, with lower highs and sustained selling pressure from the $6.028 peak. NEAR is trading below its short- and medium-term moving averages, suggesting sellers still control the immediate trend. The $4.25 area is the key support to watch, while $4.52–$4.62 forms the first meaningful recovery zone. Above that, $4.75 and $4.98 are potential resistance areas. A bounce alone would not reverse the structure; buyers need to reclaim resistance and hold it on a retest. INDICATORS The displayed MA7 is $4.515, MA14 $4.517 and MA28 $4.754. Price is below all three, reinforcing the weak trend. Bollinger Bands show a middle line at $4.624 and a lower band at $4.264, putting price close to the lower boundary. RSI14 at 38.84 reflects bearish momentum but is not deeply oversold. MACD reads DIF -0.120, DEA -0.117 and histogram -0.003, indicating momentum remains slightly negative. Volume has faded compared with earlier activity, but that alone cannot confirm accumulation or a reversal. TRADING SCENARIOS Bullish: A 6-hour reclaim of $4.52–$4.62, followed by a successful retest, could offer an entry around $4.53–$4.60. SL: $4.38. TP1: $4.75; TP2: $4.98. The recovery would gain credibility if volume expands and RSI strengthens. Bearish: A decisive 6-hour close below $4.25, followed by a failed retest, could offer a short near $4.20–$4.25. SL: $4.42. TP1: $4.05; TP2: $3.85. A recovery above the broken support invalidates this setup. These are conditional scenarios, not confirmed signals. MY PERSONAL READ WHY THIS SETUP MATTERS I wouldn't chase NEAR here. The project has a more interesting economic story than a simple AI narrative, but the chart hasn't caught up with that thesis yet. I'm watching whether $4.25 holds and whether buyers can reclaim $4.62 with stronger volume. That gap between improving token economics and weak price structure is precisely what makes this setup worth watching. $NEARUSDT #IMPACTbyTrade #ByXIMPACT


📢Bitcoin Fresh price analysis and trade setup📈
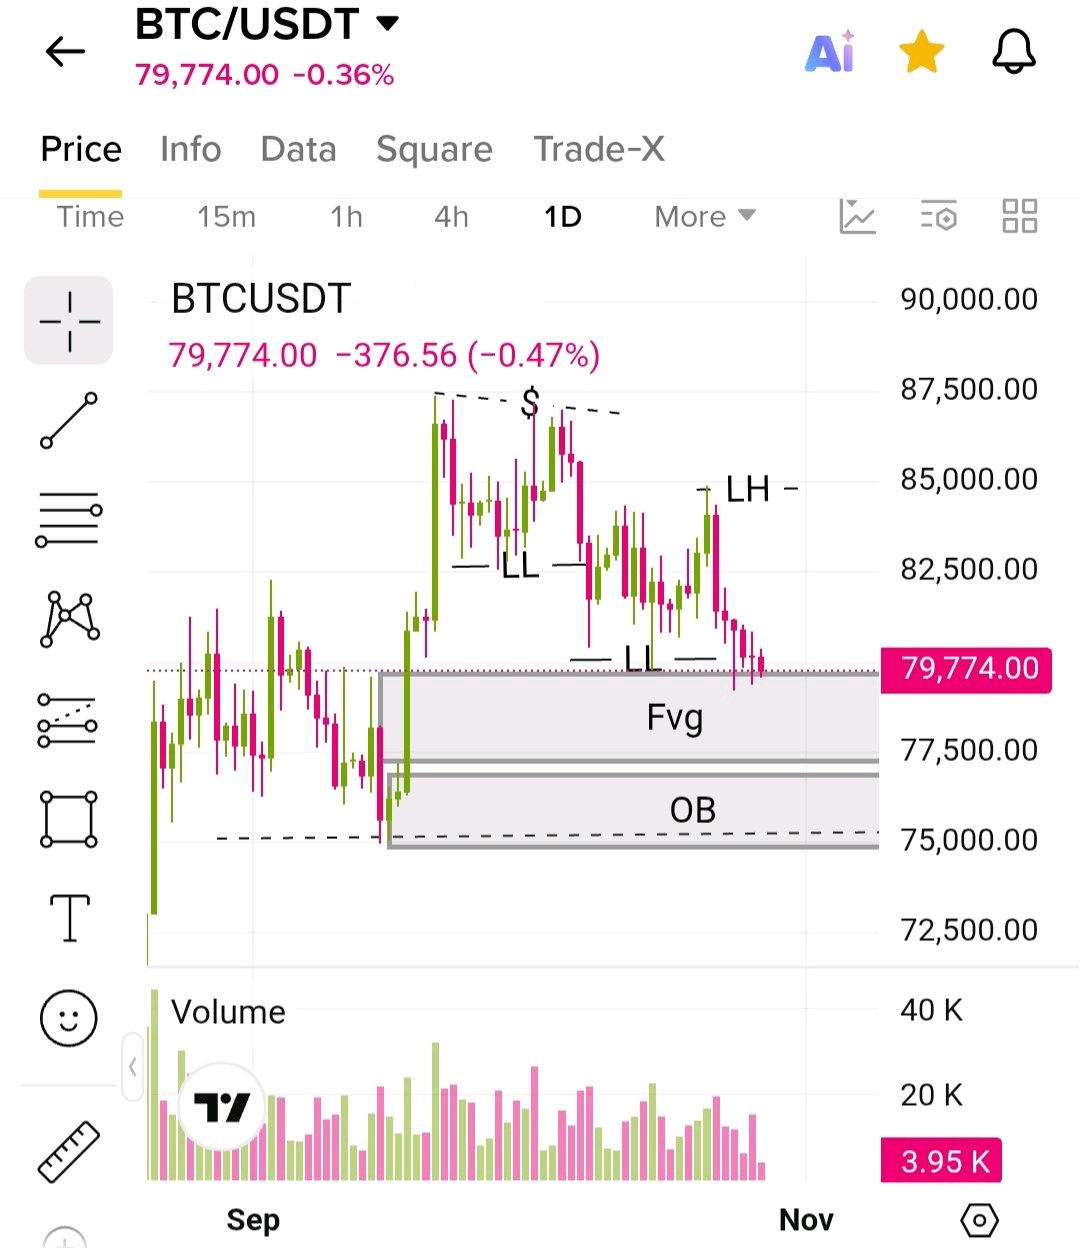
Bitcoin price looks bullish on 1 day time frame as it has broken its structure from bearish to bullish and it is going up continuously making higher highs and higher lows after making higher high it is now taking correction and making lower lows and lower highs it is going to fill it's fair value gap and OB its mean it can touch the $75k $74k $72k area...🚀🚀 once it complete it's correction you can go with long trade after a break of structure and you can target the new high again and it can touch the 90k area and 95k and the last one Target will be $100k because overall market structure looks bullish📈 it's internal structure is bearish which is its pullback phase it is buying opportunity for everyone who understand the price structure 😊💪 👀just keep an eye on the 70k price level this price must be protected because it is it's strong low area as long as this area is protected Bitcoin price will remain bullish on higher time frame #IMPACTbyTrade #MyByXTake #ByXIMPACT #WSOT2026 #AnthropicS1Filing

تعتمد توقعات سعر عملة TREE (سواء توكن Tree Finance أو Treehouse Protocol) على تحليل المؤشرات الفنية، وسيولة المنصات، والاتجاه العام لأسواق الرقميات. يتراوح سعر العملة حالياً حول مستويات $0.15 - $0.18. التوقعات السعرية (2026 - 2030) المدى القصير (نهاية 2026): السيناريو المحافظ/السلبي: تذبذب هابط باتجاه مستويات الدعم بين $0.10 - $0.12 في حال انخفاض سيولة التداول أو صحح السوق العام. السيناريو الإيجابي: اختراق مستويات المقاومة والوصول إلى نطاق $0.20 - $0.23 مع استمرار تحركات البيتكوين الإيجابية. المدى المتوسط إلى الطويل (2027 - 2030): عام 2027: يُتوقع تداول العملة حول مستويات $0.17 - $0.26 في حال زيادة الاعتماد على بروتوكول العملة. عام 2030: تشير التوقعات الخوارزمية إلى احتمال استهداف مستويات $0.27 - $0.35، مع قمة سابقة (All-Time High) سجلتها العملة بالقرب من $0.44. #WSOT2026 $TREEUSDT


Boom 💥
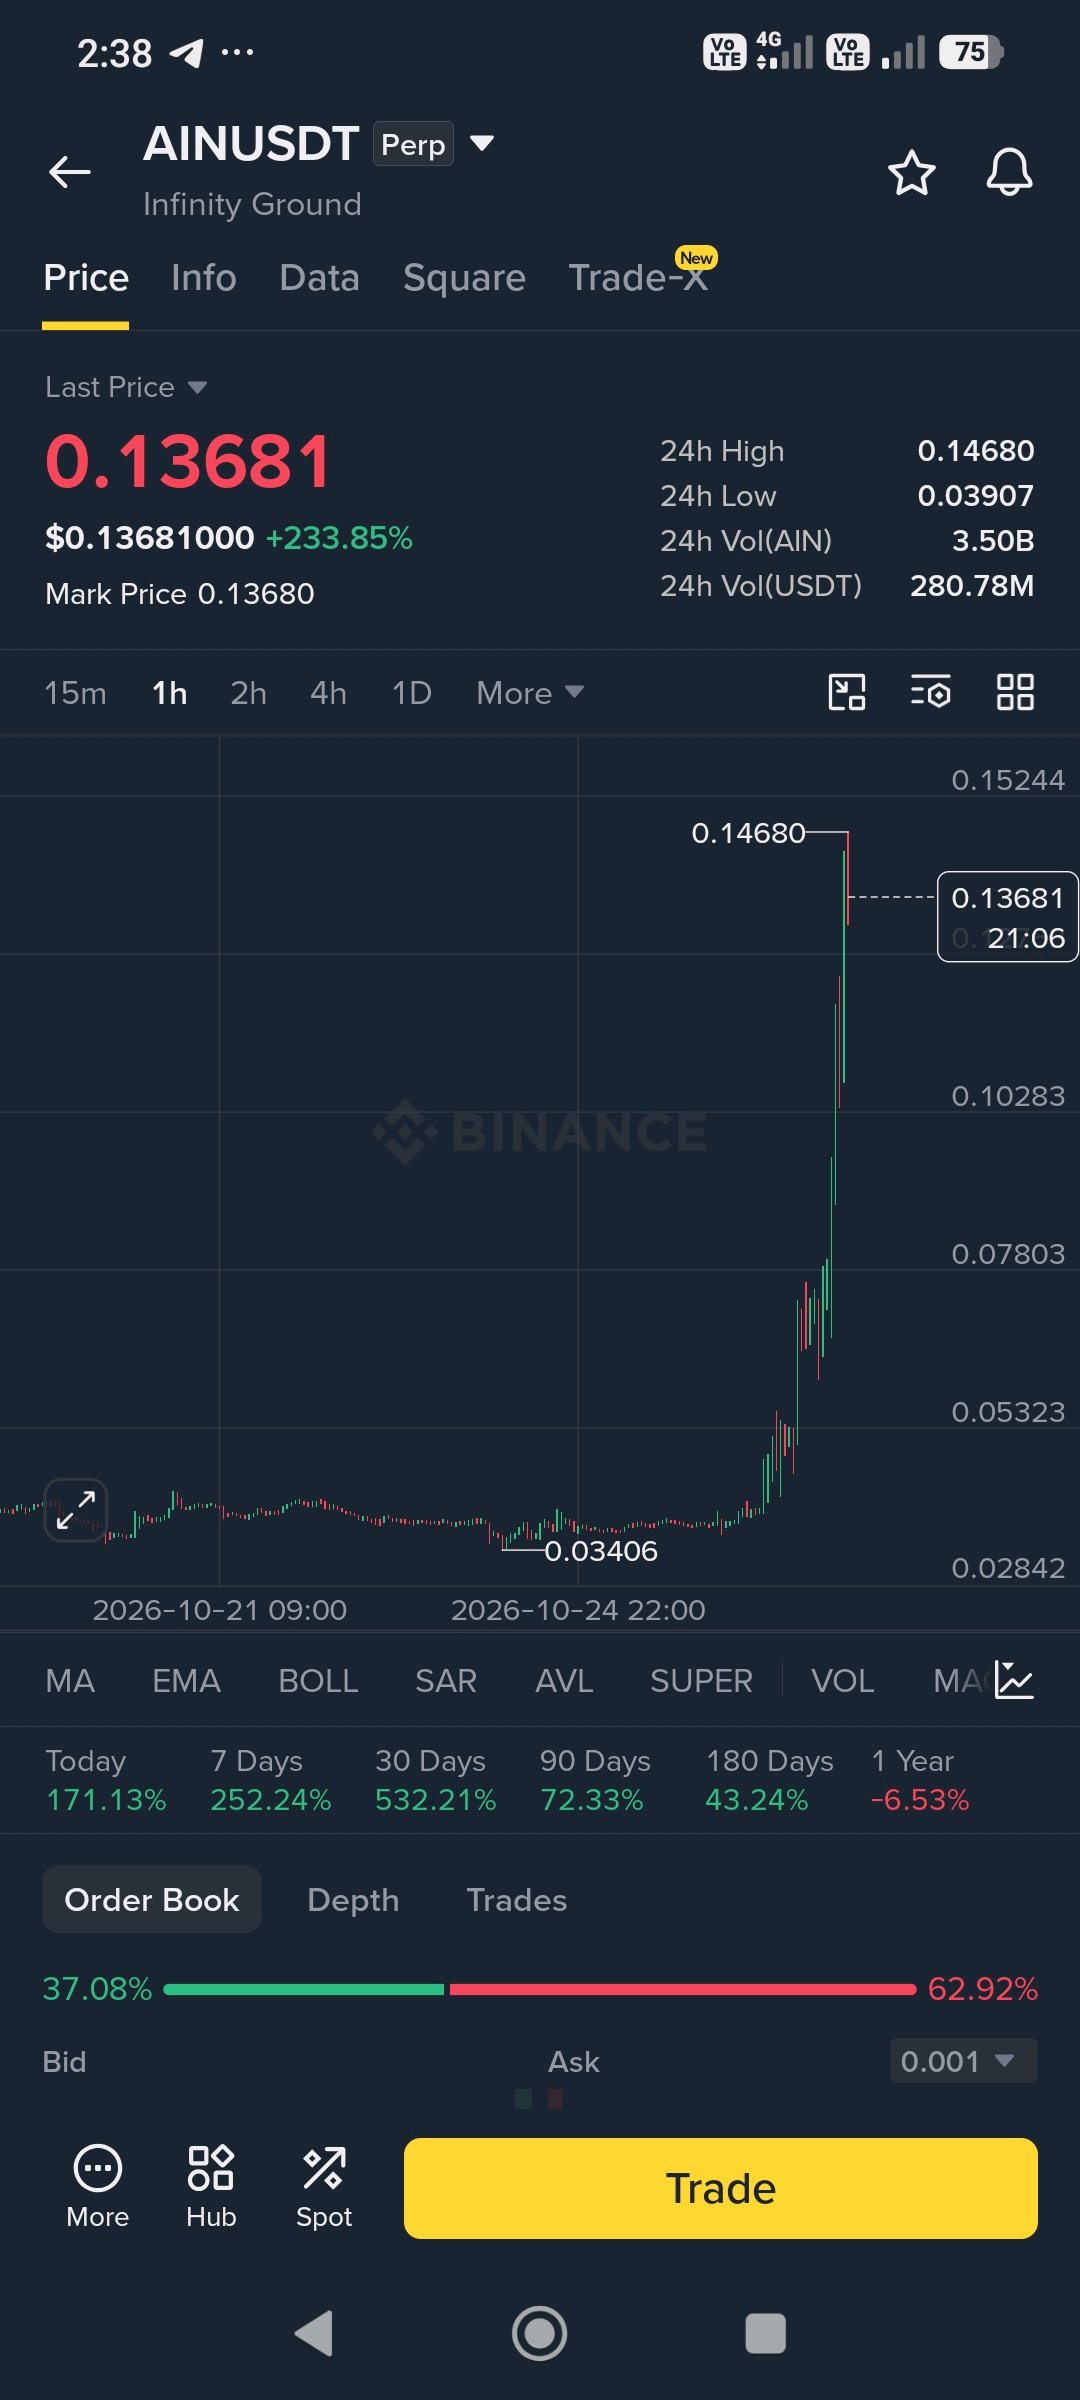
#AIN bullish breakout. 📈💎 $BTCUSDT

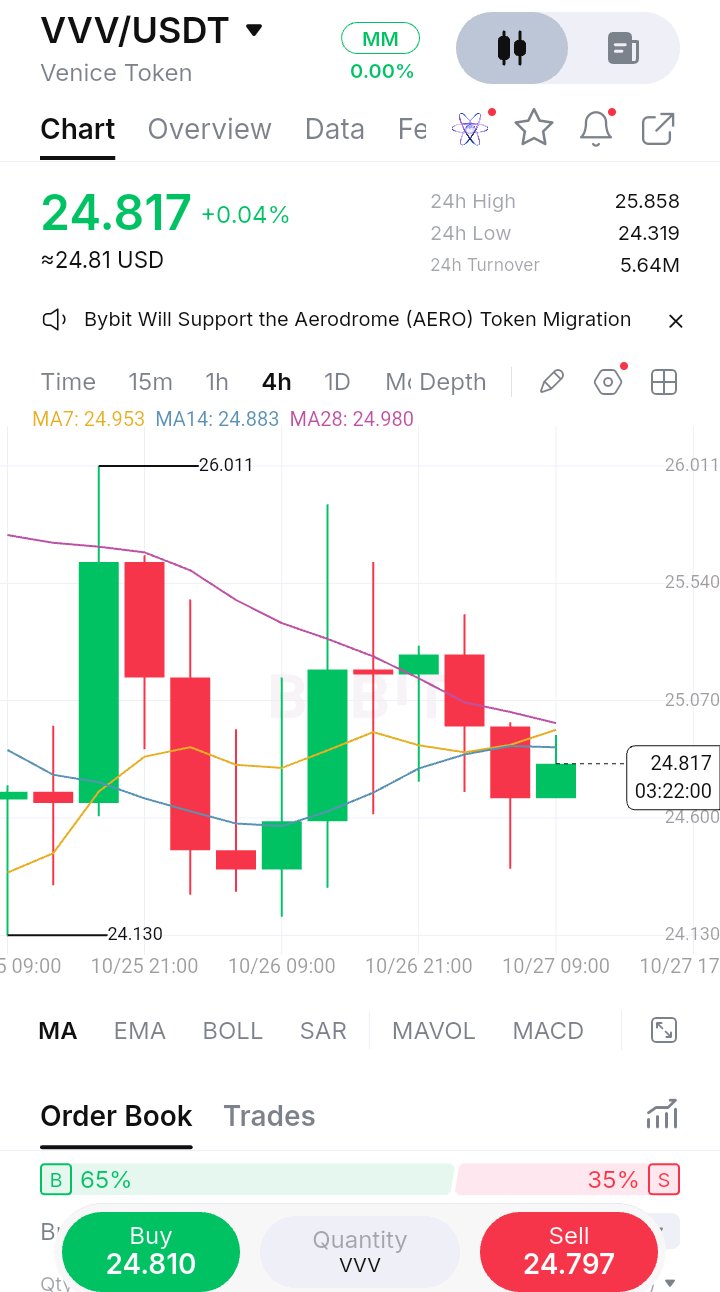
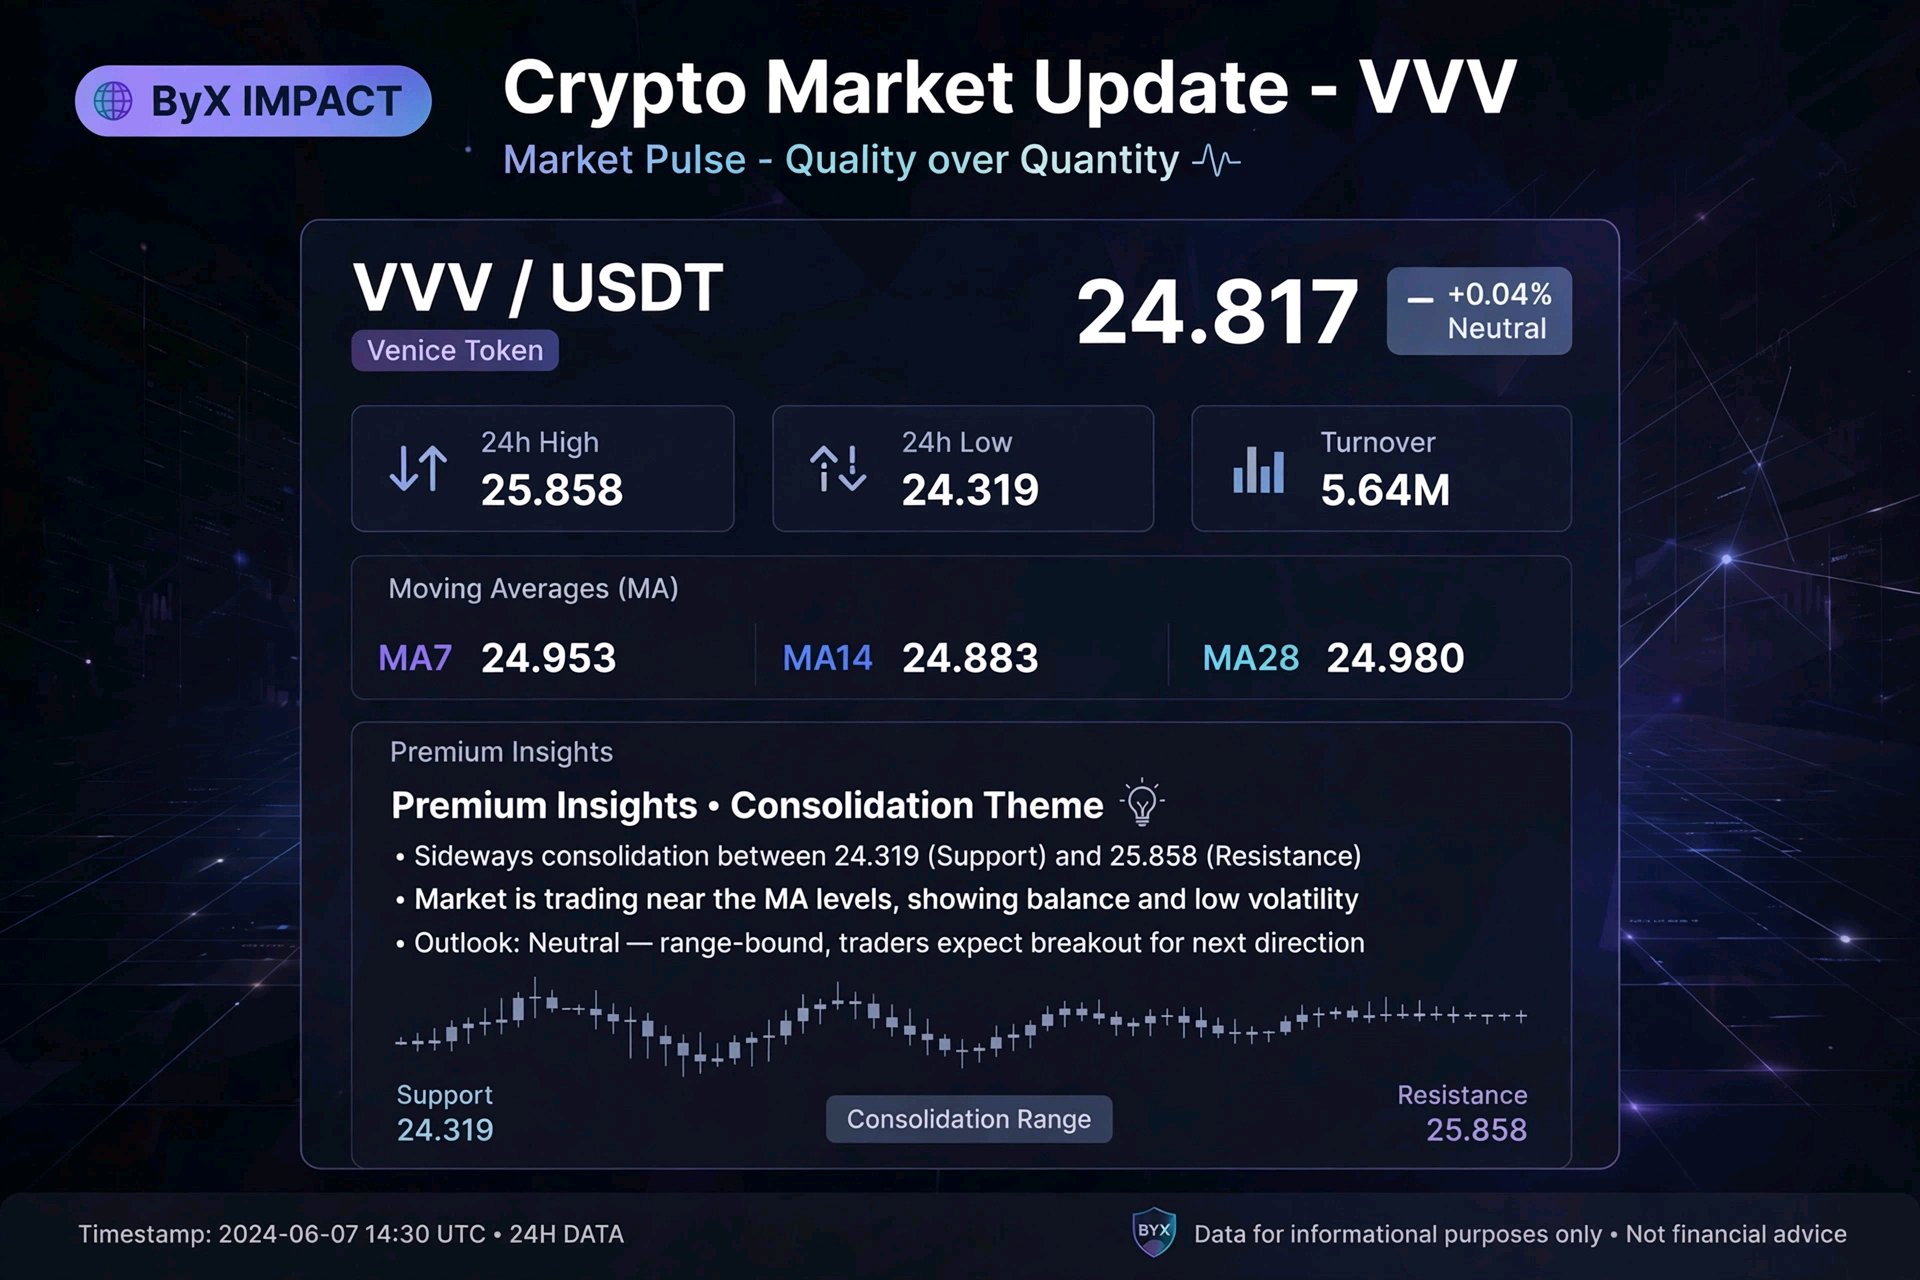
*VVV/USDT - 24.817 (+0.04%) | Tight Consolidation* $VVVUSDT *1. MA Cluster - All above price:* MA7 24.953 | MA14 24.883 | MA28 24.980 Price 24.817 is below ALL 3 MAs, and all 3 MAs are compressed within 0.10 - 24.883 to 24.980. This is tight range. Bearish but very close to flip. *2. Structure - High volatility to low:* - Top wick 26.011 on 10/25 - massive spike - Bottom 24.130 - then rally to 25.85 - Last 4 candles: lower highs 25.47 > 25.10 > 24.95 > 24.81 - downtrend in consolidation - Your 03:22 candle small green after red wick to 24.319 low - showing buyers defending low. *3. Order Book:* 65% Buy vs 35% Sell - moderate bullish bias, healthy. Not extreme like DATA. *4. Turnover:* 5.64M - low, same as ASTER. Low volume consolidation = breakout pending. - Range Trader Angle:* > *VVV - Consolidation at 24.817* > VVV compressed between 24.319 support and 25.858 resistance. MAs clustered at 24.88-24.98 above price - resistance confluence. > > *What I learned:* After 26.011 spike failed, I stopped chasing highs. Now waiting for range break. > > *Plan:* No trade inside. Need close above 24.98 MA28 to confirm bullish breakout target 25.858. Or breakdown below 24.319 for short. Until then, patience = profit. No FOMO. #ByXIMPACT

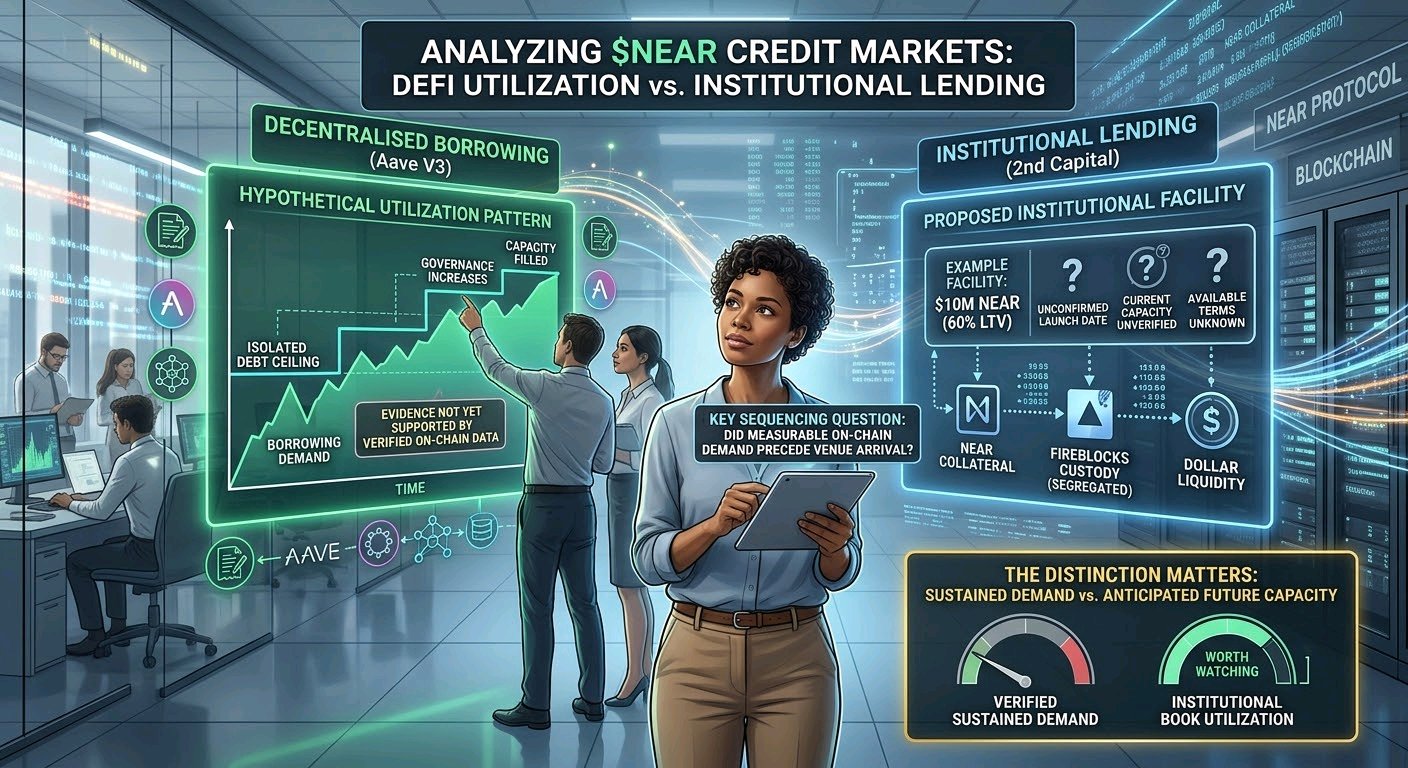
$NEARUSDT presents an interesting credit-market question, but the evidence does not yet support a verified pattern of borrowers repeatedly exhausting an isolated debt ceiling on Aave, with governance raising the limit only for the new capacity to fill again. That distinction matters: sustained borrowing demand is a stronger signal than a single increase in utilization, and the figures need to be confirmed against on-chain market data. The institutional lending angle is worth examining separately. 2nd Capital advertises digital-asset-backed financing, including a published example of a $10 million NEAR facility at 60% loan-to-value, with Fireblocks identified for segregated custody. However, that example does not establish a newly opened NEAR lending book, a confirmed launch date, or current available capacity. The distinction is less a spot listing and more a credit listing: a potential route for holders to access dollar liquidity against $NEAR without selling their underlying position. Yet the actual terms, funding currency, collateral eligibility, custody structure, and facility availability must be verified before treating it as a live alternative to decentralized borrowing. The important sequencing question is whether measurable on-chain borrowing demand preceded the arrival of a more conservative lending venue, rather than the venue simply anticipating future demand. Worth watching whether utilization on a verified institutional $NEAR lending book fills anywhere near as fast as the relevant DeFi market's did. #ByXIMPACT

🚀 $GOOGLX: GOOGLE'S AI AND CLOUD GROWTH STORY
Alphabet, Google's parent company, remains a major force in digital advertising, cloud computing, and artificial intelligence. Its expanding technology ecosystem provides several potential drivers for long-term growth. 🏢 1. FUNDAMENTAL STRENGTH 🔎 Google Search: A major advertising revenue engine supported by a global user base. ▶️ YouTube: Advertising and subscriptions create additional recurring revenue opportunities. ☁️ Google Cloud: Enterprise demand for cloud infrastructure and AI services offers significant growth potential. 🤖 Artificial Intelligence: Gemini and AI integration across Google's products could improve competitiveness and unlock new revenue streams. 📈 2. KEY GROWTH CATALYSTS ✅ AI monetization and innovation. ✅ Google Cloud expansion. ✅ Strong advertising demand. ✅ Growth across subscriptions and digital services. ✅ Continued investment in technology and infrastructure. 💰 3. INFLOWS, OUTFLOWS & NETWORK Inflows: Demand for tokenized Alphabet exposure may encourage additional token issuance. Outflows: Redemptions can reduce circulating token supply. Network: Blockchain infrastructure enables transfers through supported networks, subject to platform availability. Unlike traditional crypto projects, $GOOGLXUSDT derives its investment thesis primarily from Alphabet's underlying share performance rather than staking rewards or token scarcity. 🌐 4. ADOPTION & UTILITY Tokenized equities connect traditional financial assets with blockchain technology, potentially offering fractional exposure and easier digital transfers. ⚠️ 5. RISKS TO WATCH 🔻 AI competition and rising infrastructure costs. 🔻 Antitrust and regulatory pressure. 🔻 Advertising-market weakness. 🔻 Valuation risks and potential stock-market corrections. 🔻 Token issuer, custody, and liquidity risks. 🚀 FINAL OUTLOOK Alphabet's combination of AI, advertising, cloud computing, and a global technology ecosystem provides a compelling fundamental growth story. The key question is whether AI investments and cloud expansion can translate into sustained revenue growth and stronger profitability. Strong ecosystem. Expanding AI opportunities. Long-term growth potential. #ByXIMPACT #WSOT2026 #AnthropicS1Filing #MyByXTake #IMPACTbyTrade


Gold just lost more than 3% but the interesting part isn't the drop itself. XAU/USD extended Friday’s Jackson Hole selloff into Monday, briefly slipping below $4,400 and touching around $4,396 as markets repriced the Fed path after Kevin Warsh’s hawkish inflation comments. September rate-hike odds have moved toward roughly 58–60%, while the dollar remains near a two-week high. That changes the short-term gold equation. For weeks, the trade was simple: weaker dollar + easier Fed expectations = stronger gold. Now we're seeing the inverse. Higher yields are increasing the opportunity cost of holding a non-yielding asset, while the stronger dollar adds another layer of pressure. At the same time, geopolitical risk is sending oil above $90, creating an unusual problem for gold bulls: safe-haven demand supports gold, but higher energy prices can reinforce inflation and keep the Fed hawkish. Technically, $4,467 is the level I'm watching. Gold is trading below that area after losing the 200-day average, with $4,408 acting as the immediate downside pivot. A failure to reclaim $4,467–$4,511 keeps the short-term structure bearish. My setup: Bearish: rejection around $4,450–$4,500 → target $4,408, then $4,368–$4,350 over the coming days. Bullish: reclaim and hold above $4,511 → the bearish repricing starts losing credibility, opening a move back toward $4,540–$4,580. Invalidation: sustained reclaim above $4,600. The real catalyst now isn't another Fed speech. It's the US jobs report. If employment weakens enough to unwind September hike expectations, gold could reverse aggressively. If the data keeps the Fed hawkish, that $4,400 shelf may not hold. Gold isn't necessarily bearish long term. The market is simply repricing the cost of owning it right now. #ByXIMPACT $XAUTUSDT #IMPACTbyTrade


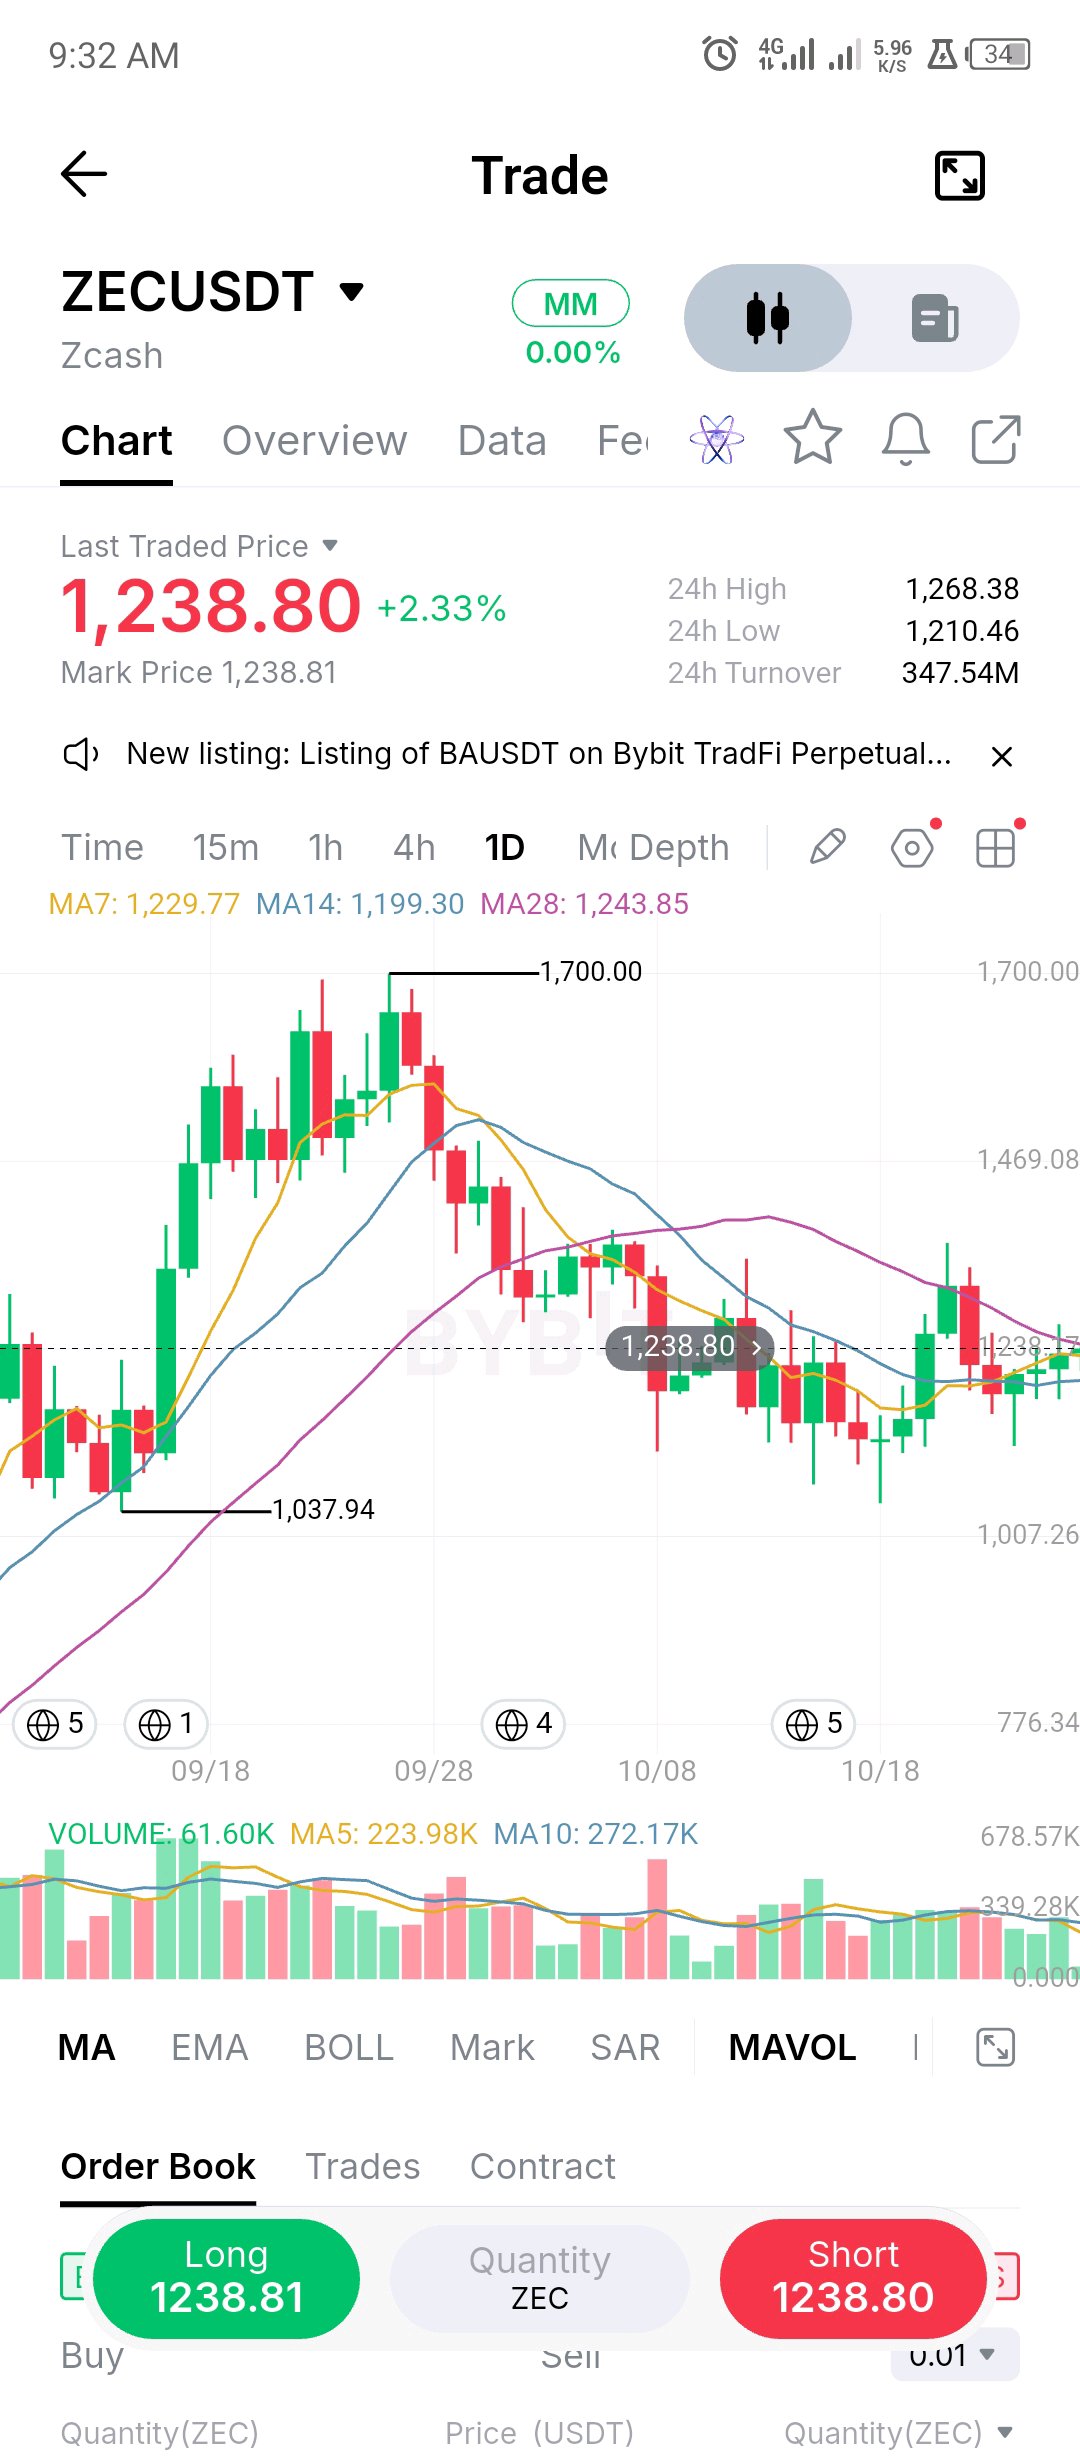
$ZEC round-tripped almost its entire move. It ran from 1,038 to 1,700, fell back to roughly 1,050 by October 18, and has since recovered about 18%. The question now is whether that retest was the low or just a pause. On the daily, price sits inside a tight cluster: the 7, 14 and 28 day MAs are at 1,230, 1,199 and 1,244, with price at 1,239. When all three average within about 4% of each other, direction usually comes from whichever side breaks first. Volume is cooling too, with the 5 day average under the 10 day, which fits a coil. Upside: a daily close above 1,268 (today's high), then the 1,300-1,365 area where last week's bounce ran out. Downside: 1,210 first, then the 14 day MA near 1,199, with 1,050 as the level that decides the bigger picture. I don't have an edge in the middle of this cluster, so I'm letting the break show direction. $ZENTUSDT #ByXIMPACT

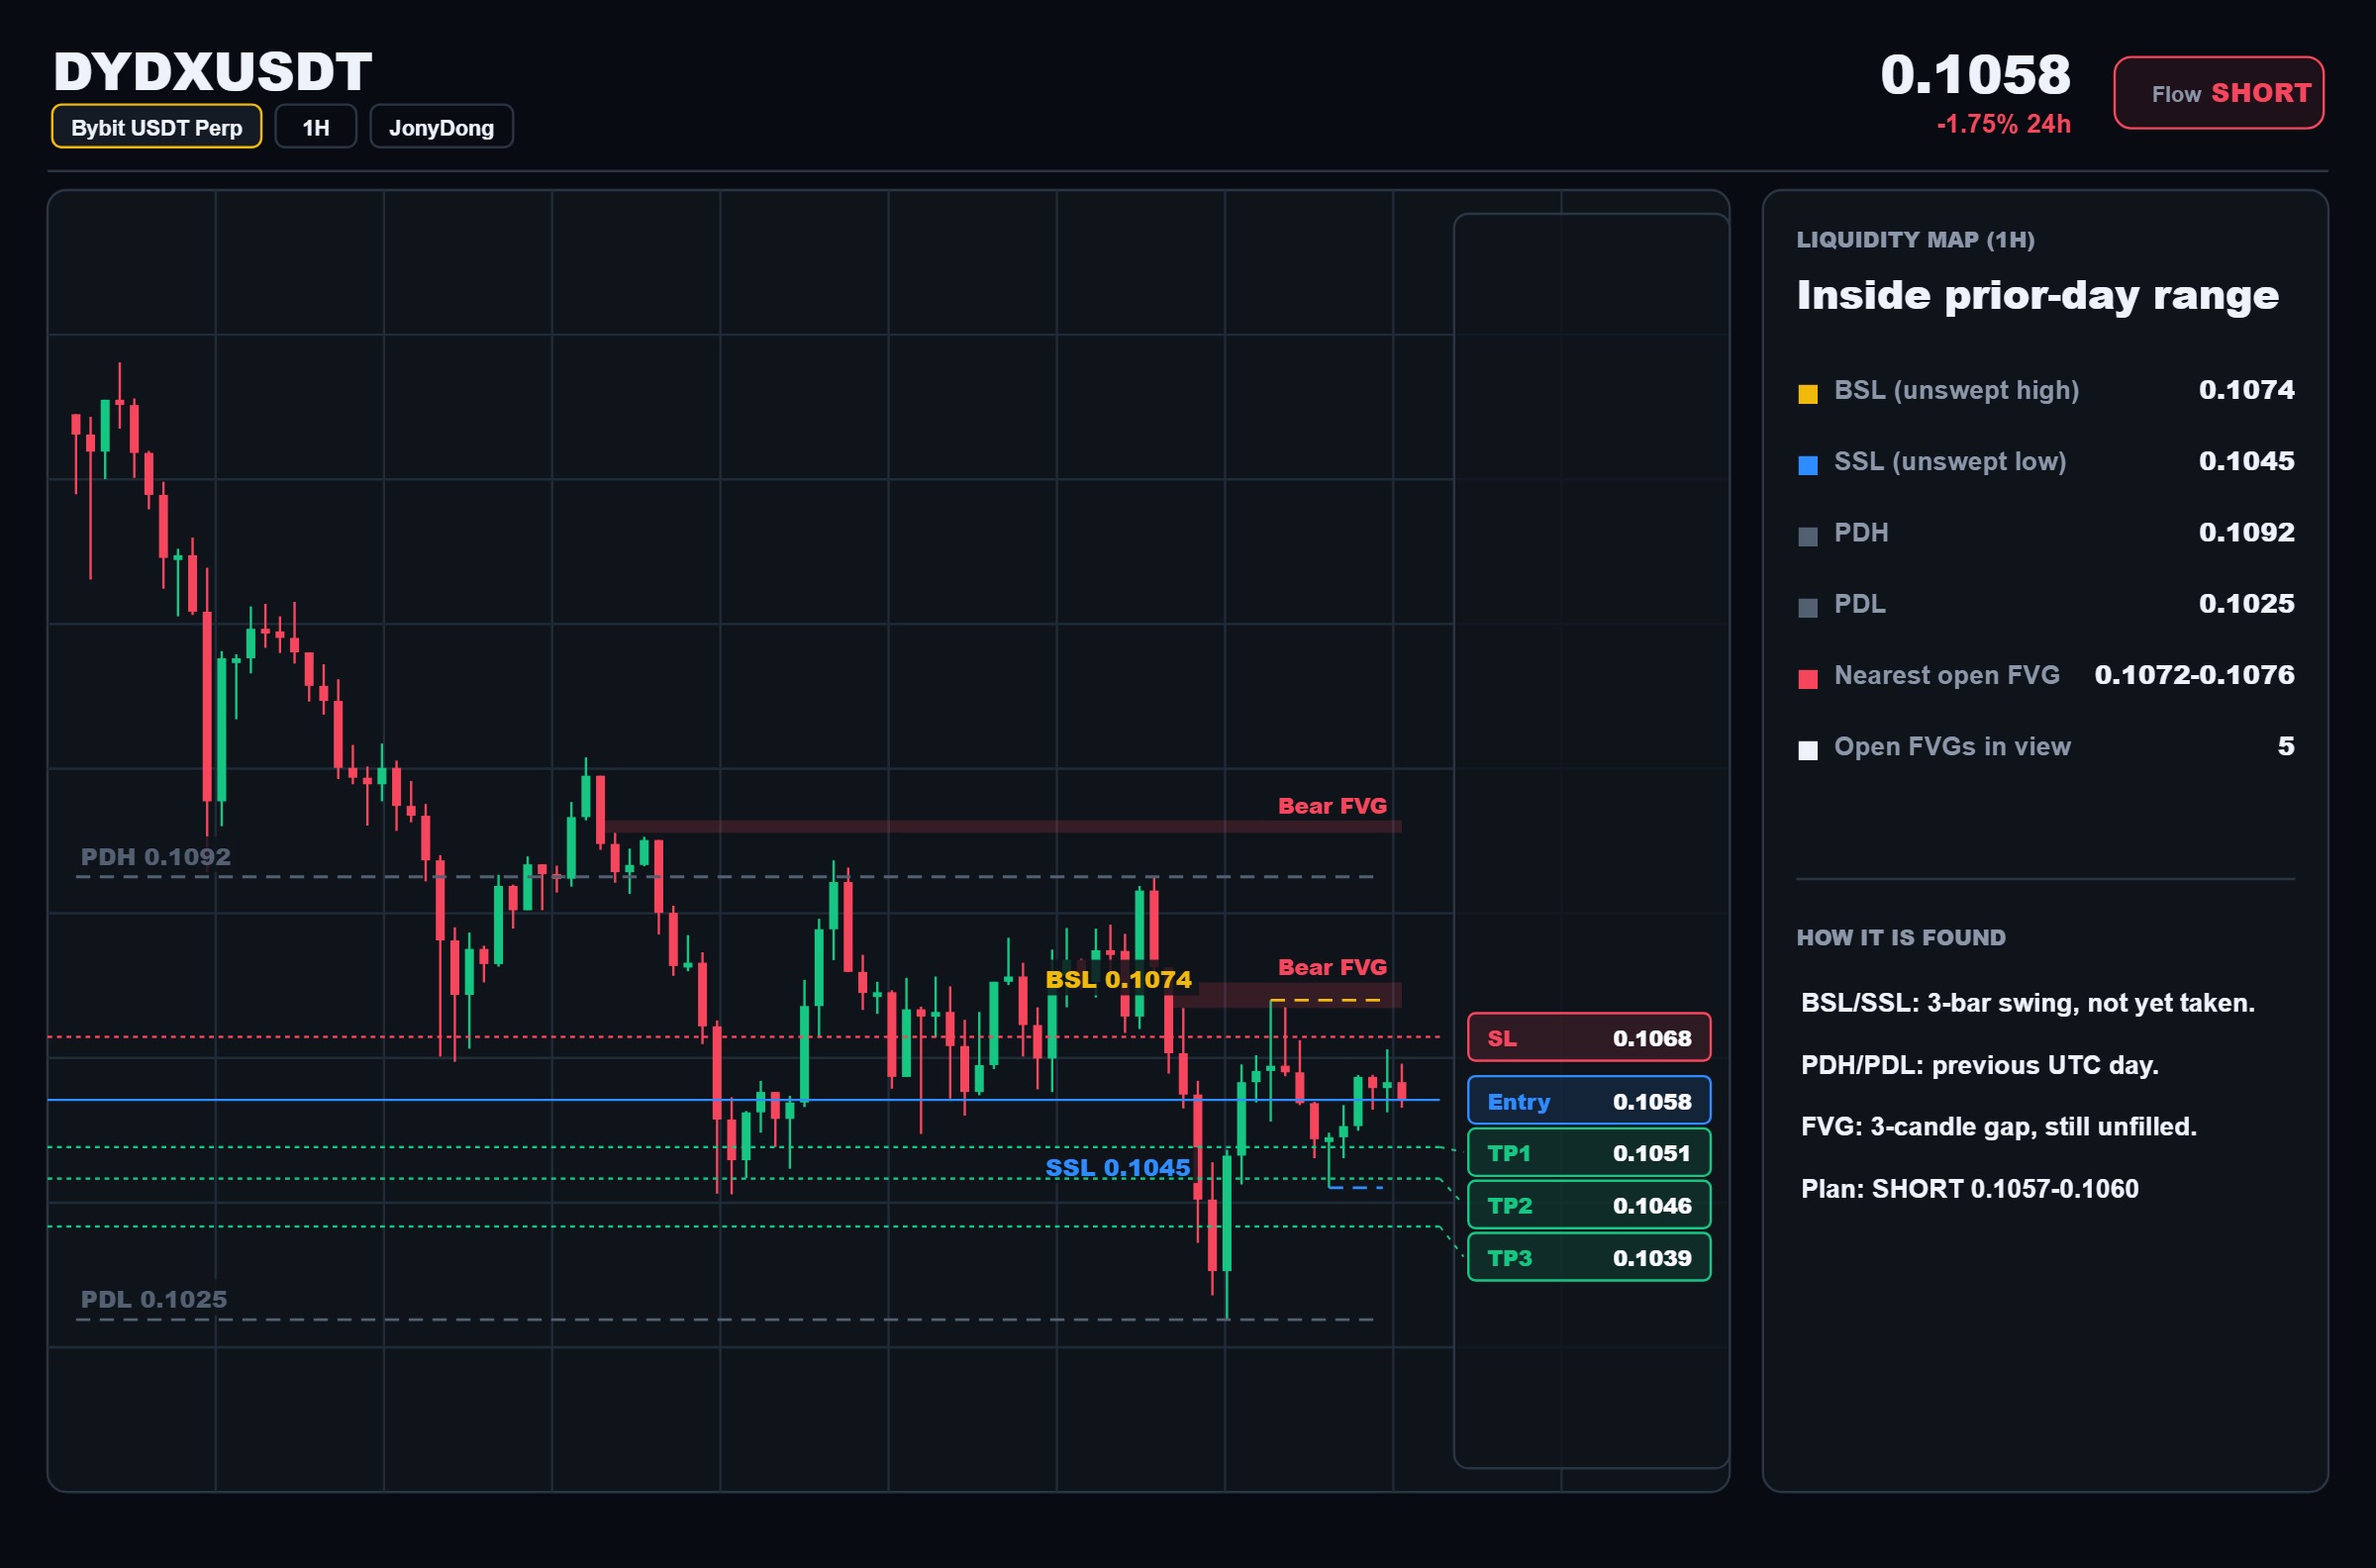
$DYDXUSDC short setup. 74% of accounts are long. That tells me most accounts are already long. Reject 0.106 and that becomes fuel. Reclaim 0.107 and it flushes the other way. What I'm seeing: 4H price 0.106 below EMA50 0.113: trend structure still favors sellersRisk 0.90% to SL vs 1.8% to TP3: about 2.1R if the full move plays outDaily below EMA200 0.126: the bigger trend is on this sideSHORT · Entry 0.1057–0.1060 · TP 0.1051 / 0.1046 / 0.1039 · SL 0.1068Clean bounce from here, or one more sweep first?NFA · DYOR

BTC key levels have been clearly identified: $81,500 and $79,000 are the two major liquidity concentration zones. Currently, bearish momentum is stronger, and the price may first probe near $79,000 to clear the liquidity below. The next move for $BTC will depend heavily on the reactions at these two levels. #AnthropicS1Filing #IMPACTbyTrade #MyByXTake
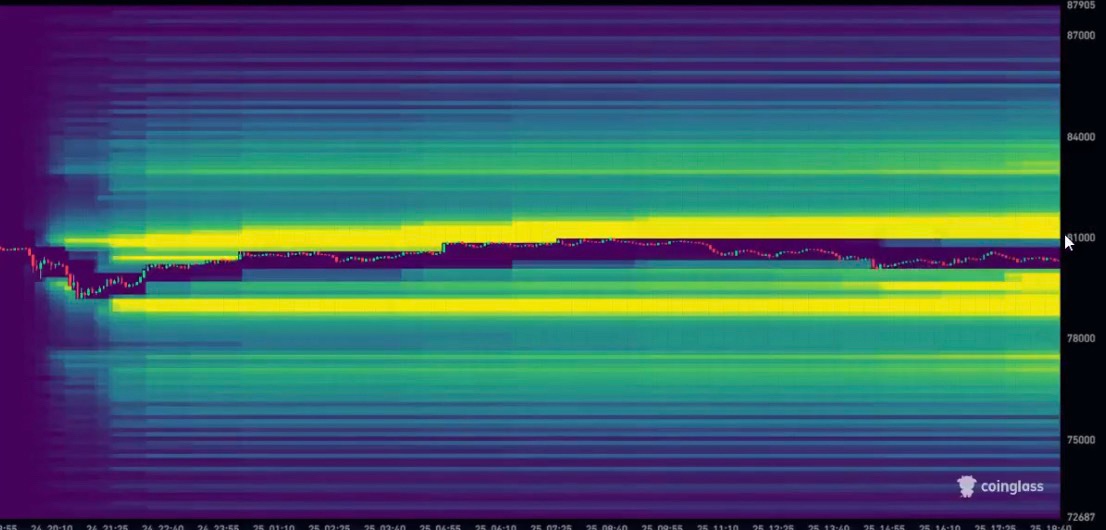

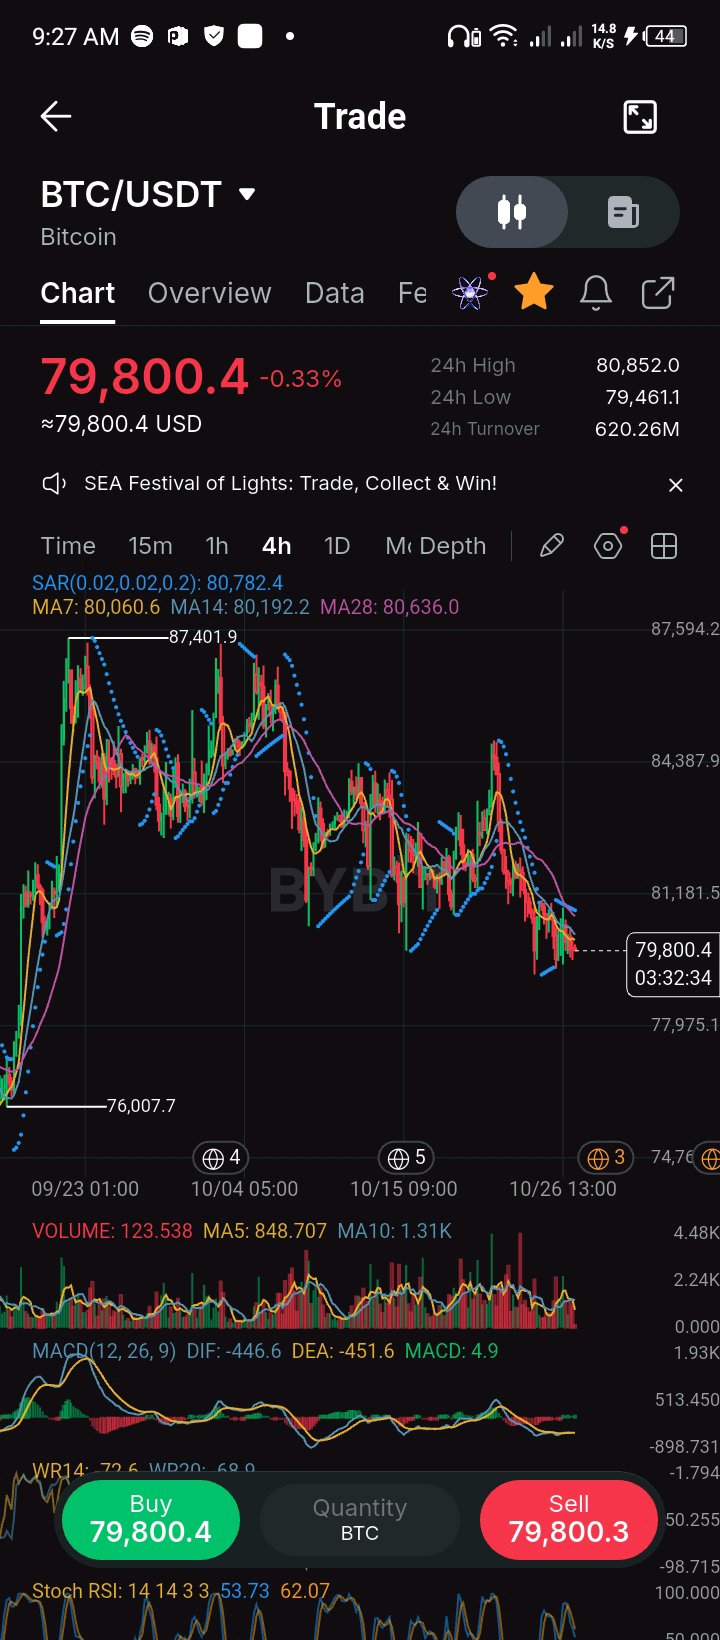
55% of Bitcoin in Circulation owned by unknown
Trade here: $BTCUSDT According to reports by Galaxy Reserachers the amount of Bitcoin in Circulation sit approximately around $21 million, of which about $11.1 million approximately 55% is been possessed and owned by an unknown person or organization. But Analysis believe that the 55% accumulated huge amount of Bitcoin was bought at early years of Bitcoin market at lower price, which nows grows in huge millions. Just like the story of the pizza guy who got paid in BTC for delivering a Pizza 🍕, if he held unto it in the next 5 years he is already a multi millionaire. Never the less, Start today trade today buy and hold today tomorrow will still tell today's story like I just did. BTC/USDT Last traded price : $79,800.04 -33% range change in market price. $76,007.7 low in the past weeks. $$87,401.9 high in the past weeks. Note: Recommended you do your own Analysis. #WSOT2026 #AnthropicS1Filing #IMPACTbyTrade #MyByXTake #MidtermsMarketWatch $ETHUSDT

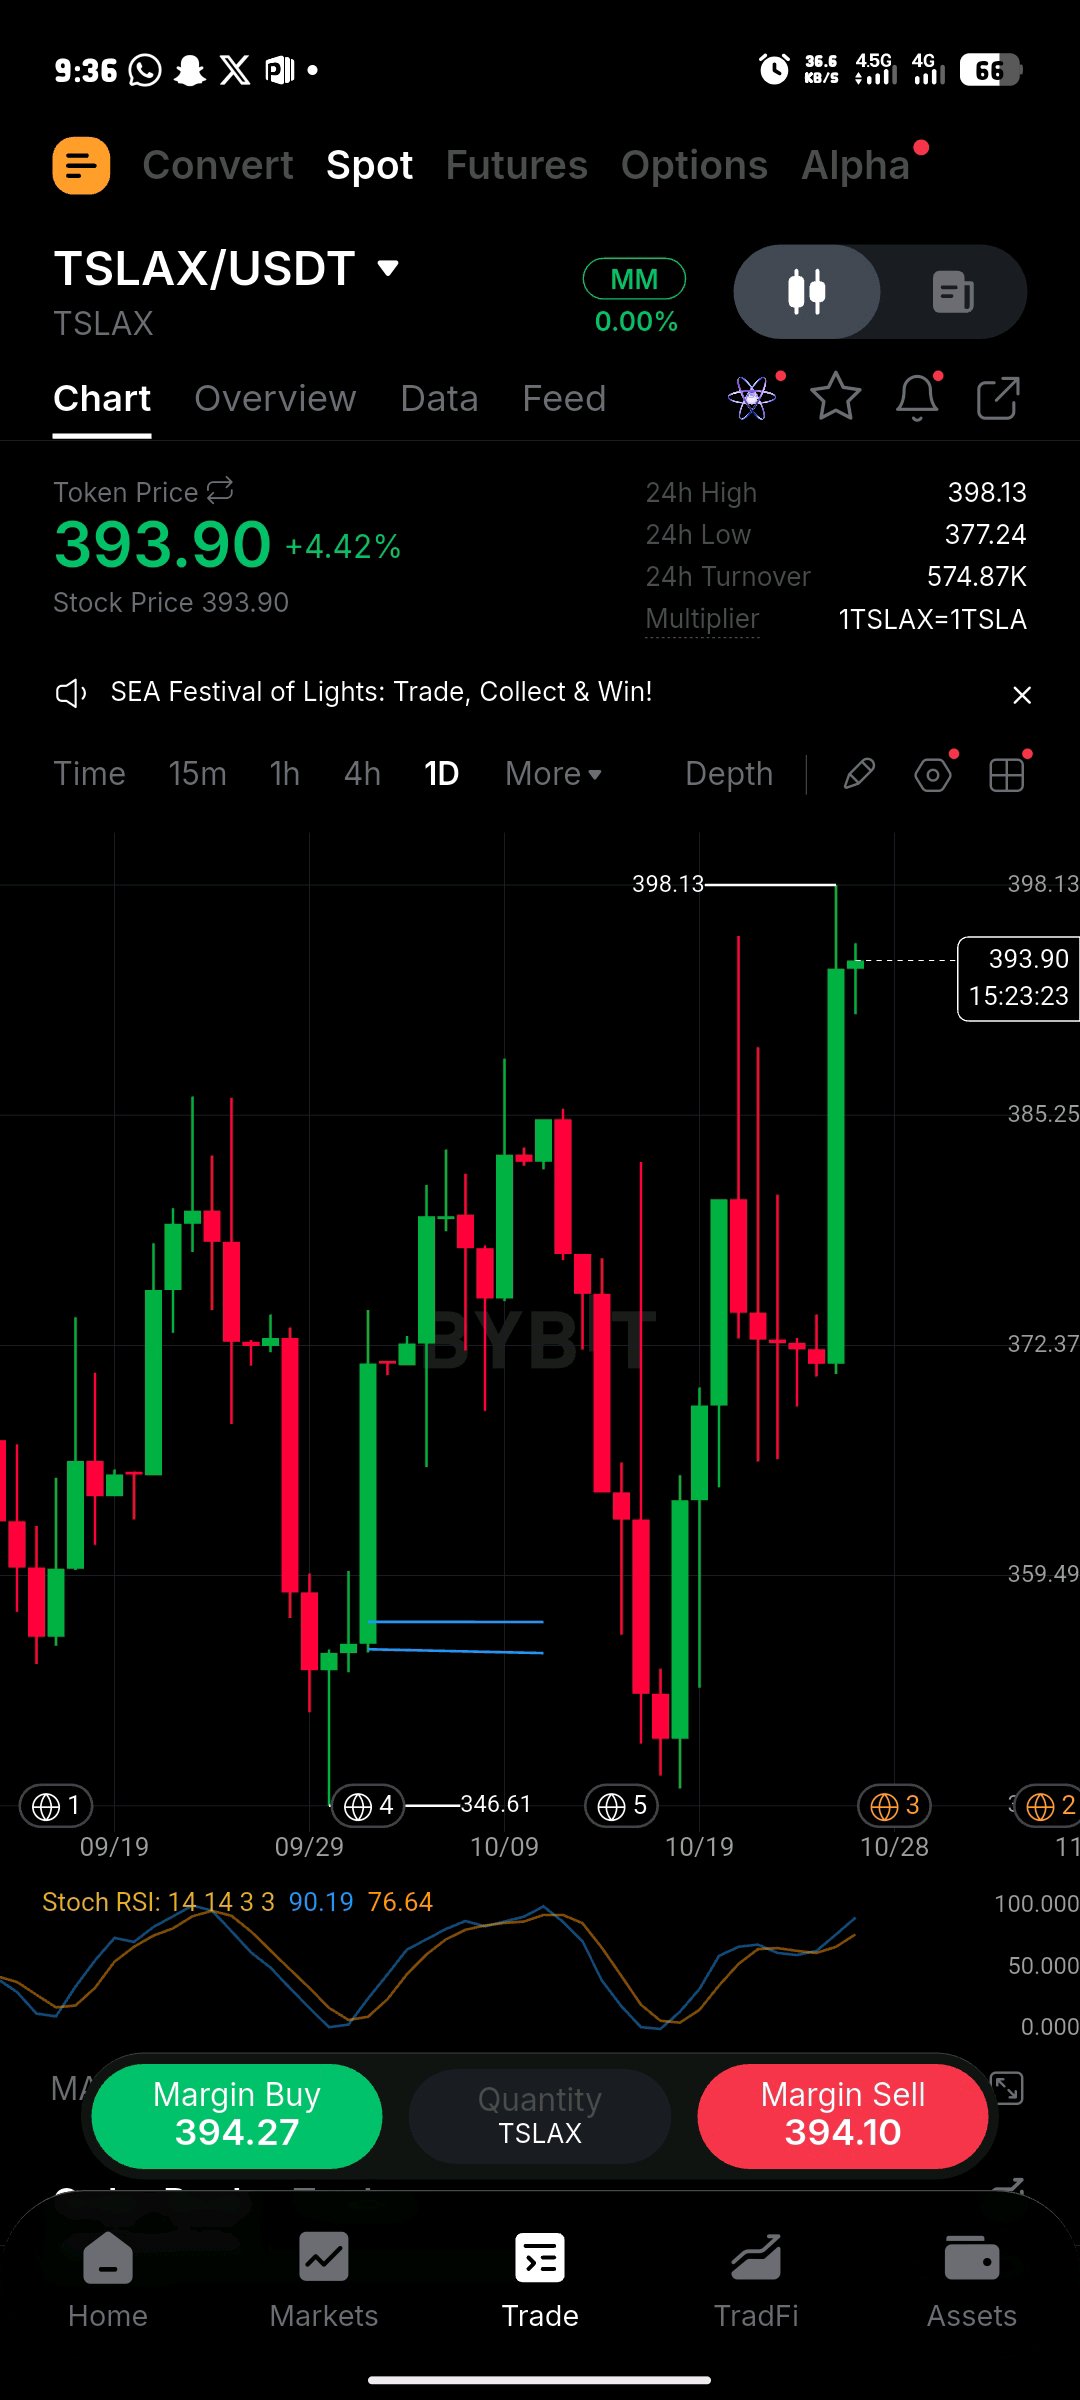
TSLA | Tesla Is Moving! Here’s What I’m Watching
$Traders, I’ve been analyzing Tesla, and the latest price action has caught my attention. TSLA closed at $391.62 on October 26, gaining 5.21% in one session. Buyers are showing strength, but price is now approaching an important resistance zone, so I’m watching carefully before drawing my next conclusion. KEY LEVELS I’M WATCHING Current Reference Price: $391.62 Resistance 1: $397.27 Resistance 2: $400.00 Resistance 3: $410.00 Support 1: $383.73 Support 2: $375.00 Support 3: $365.00 Major Support: $355.00 BULLISH SCENARIO From my analysis, if TSLA breaks above $397.27 and holds that level, I’ll be watching for a possible move toward $400 and then $410. Potential Targets: TP1: $397.27 TP2: $400.00 TP3: $410.00 I want to see a confirmed breakout with strong buying volume before considering this scenario. A rejection at resistance could lead to a temporary pullback. BEARISH SCENARIO On the other hand, if Tesla fails to break above $397.27 and selling pressure increases, I’ll be watching the $383.73 support zone. If that support breaks, the next levels I’m watching are $375 and $365, with $355 as a deeper support area. MY PERSONAL OUTLOOK Traders, I’m leaning cautiously bullish because buyers have recently pushed the price higher. However, I don’t want to chase the move after a strong green session. For me, the key question is whether buyers can push TSLA above $397.27 or whether sellers will defend that resistance and trigger a pullback. I’ll be watching price action, volume, and the reaction around these key levels before making any conclusions. What do you think, traders? Are we going to see TSLA break above $400, or will sellers push the price back toward support? Drop your thoughts in the comments. Let’s discuss! #IMPACTbyTrade $TSLAXUSDT
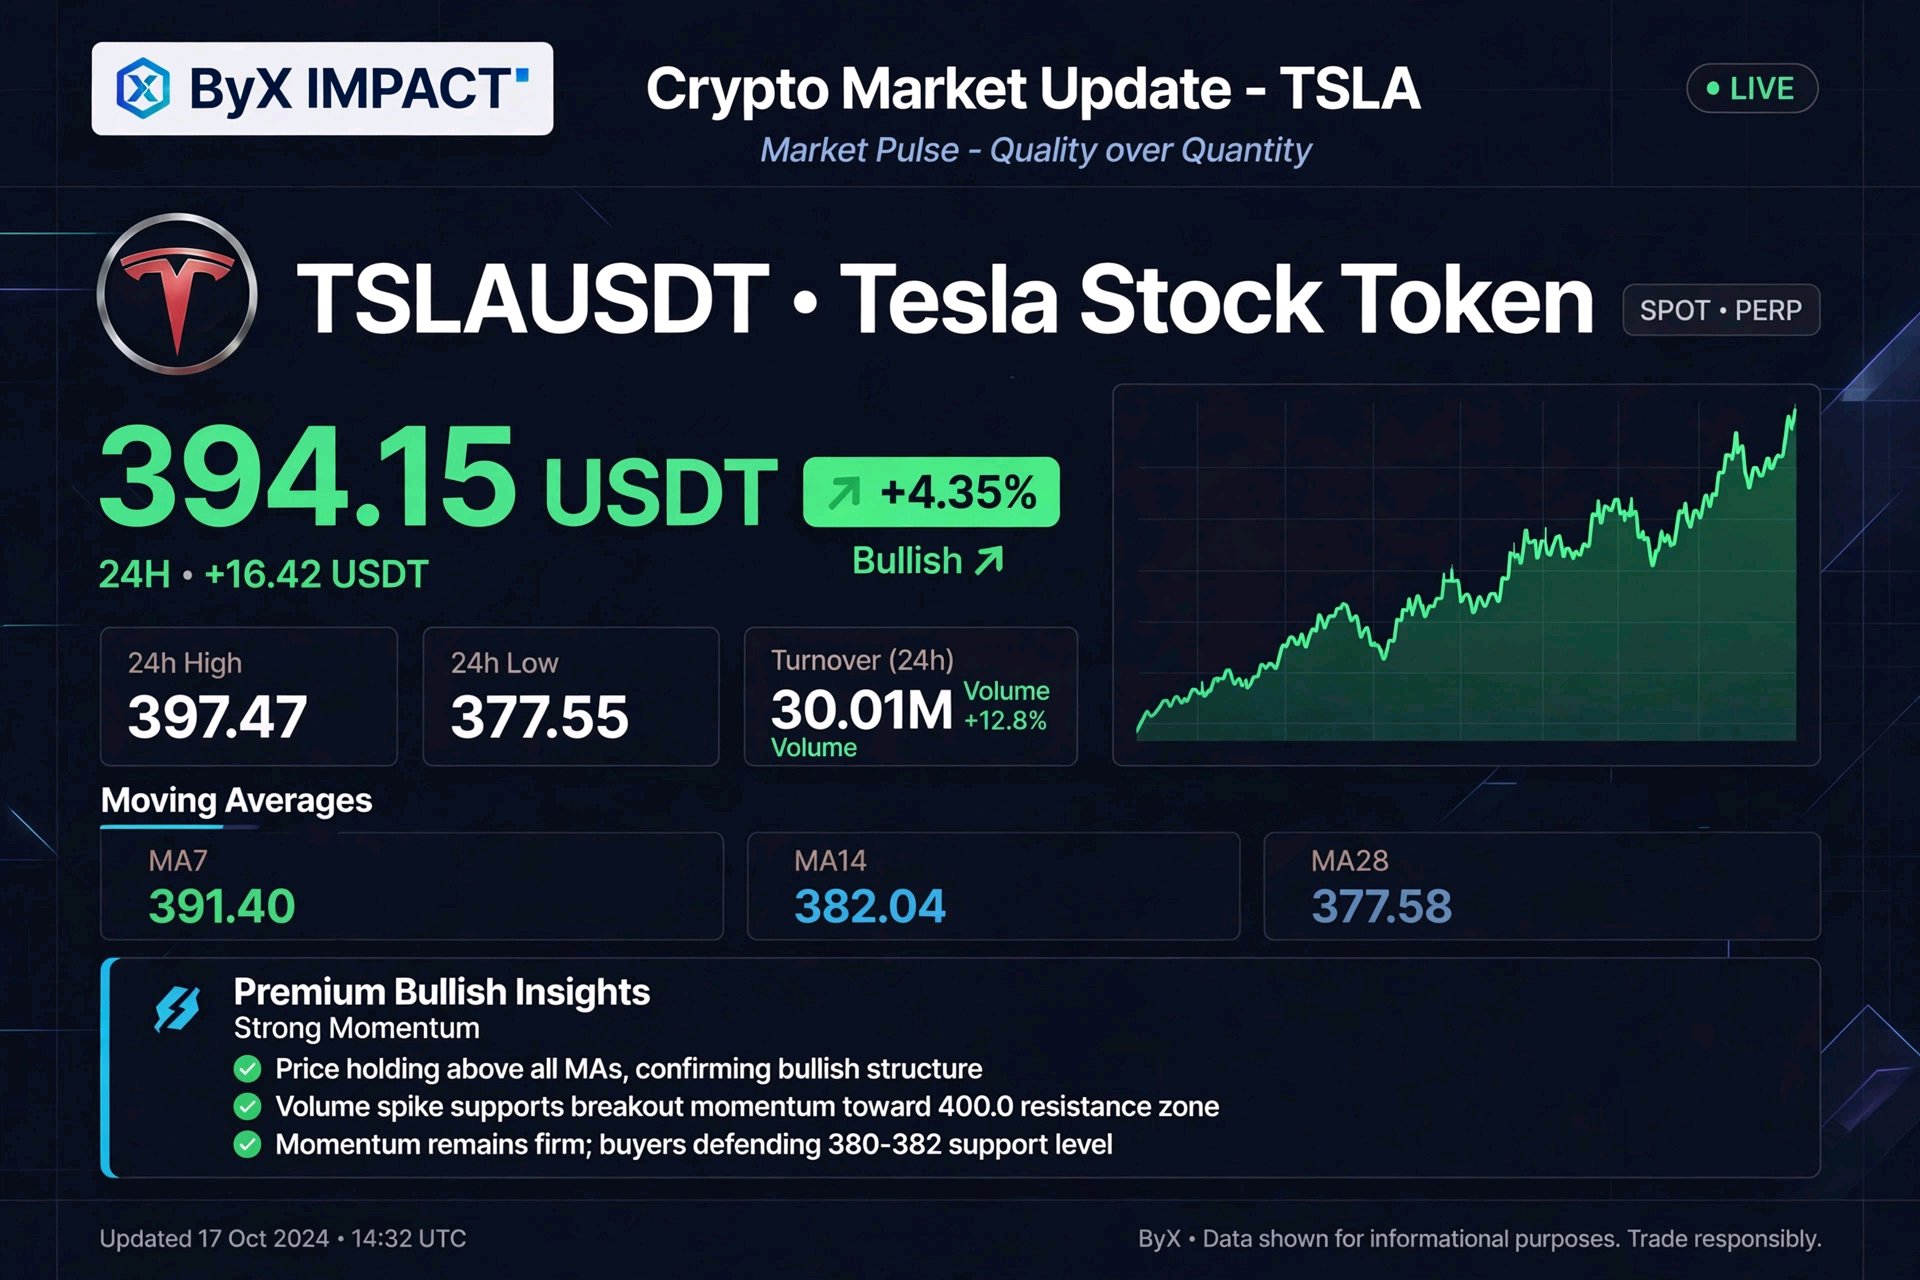
*TSLAUSDT - Tesla Token 394.15 (+4.35%) | Monster Breakout!* *1. MA Stack - Perfect Bullish:* MA7 391.40 | MA14 382.04 | MA28 377.58 Price 394.15 > MA7 > MA14 > MA28. All MAs rising, price above all. This is textbook uptrend. Compare to your DATA/AAVE which were below all MAs - complete opposite. *2. Structure from your 4H chart:* - Base 370.51 on 10/25 - then consolidation - *10/26 09:00 MASSIVE green candle* from 374 to 395 - $21 breakout (+5.6% in one candle) with volume - High 397.47 rejected, then 3 candles consolidation 390-396 - healthy flag - Current 394.15 reclaiming MA7 after pullback - continuation signal *3. Volume:* Turnover 30.01M - *highest among all your uploads* (vs DOOD 8.48M, ASTER 5.74M). Real institutional flow. This confirms breakout is not fake. *4. Order Book:* Your screenshot cut but shows heavy Sell side 76% - means shorts trapped, potential short squeeze to 400. * - Premium Angle:* > *TSLAUSDT - +4.35% Breakout with Volume* > TSLA token broke 370.51 base and ripped to 397.47. Now holding above MA7 391.40 after flag. > > *What I did:* Did not chase the green spike at 397.47. Waited for 390 retest. Now structure is bullish higher lows. > > *What I learned:* Volume matters - 30M turnover vs 6M on DATA. Follow strength with volume. > > *Plan:* Long hold above 391.40 MA7, target 397.47 then psychological 400. SL 385 below MA14. Quality setup, risk 1%. #ByXIMPACT


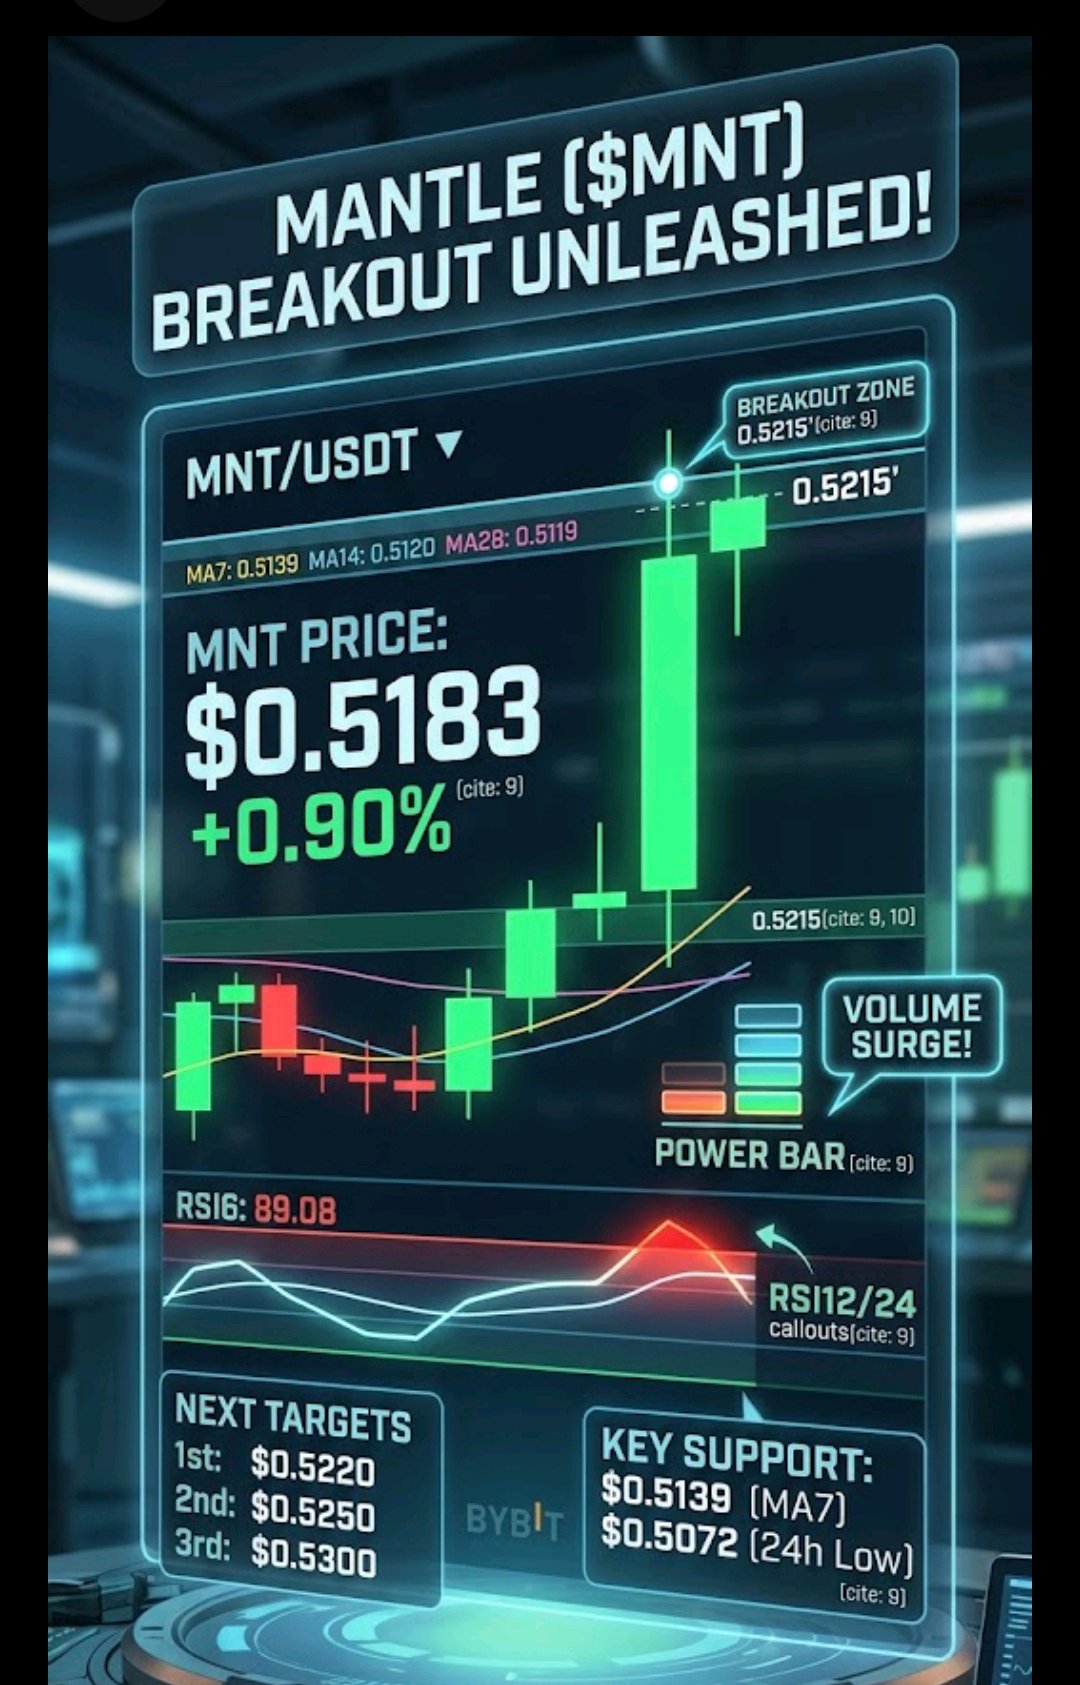
🔥 MNT Big Breakout! Surging Towards $0.52!
$MNTUSDT ⚡ Mantle ($MNT) is on fire, trading at $0.5183 (+0.90%) and exploding on the 15m chart. After consolidating, a massive green candle has just pierced through all key moving averages with huge volume! 📊 Key Levels: Current Price: $0.5183 24h High: $0.5215 Next Resistance: $0.5215 Support: $0.5139 (MA7) Momentum is clearly with the bulls right now. 💬 Is this the start of a massive rally? Where do you think MNT is heading next? 👇 #Mantle #MNT #CryptoTrading #Breakout #Altcoins #WSOT2026 #AnthropicS1Filing @
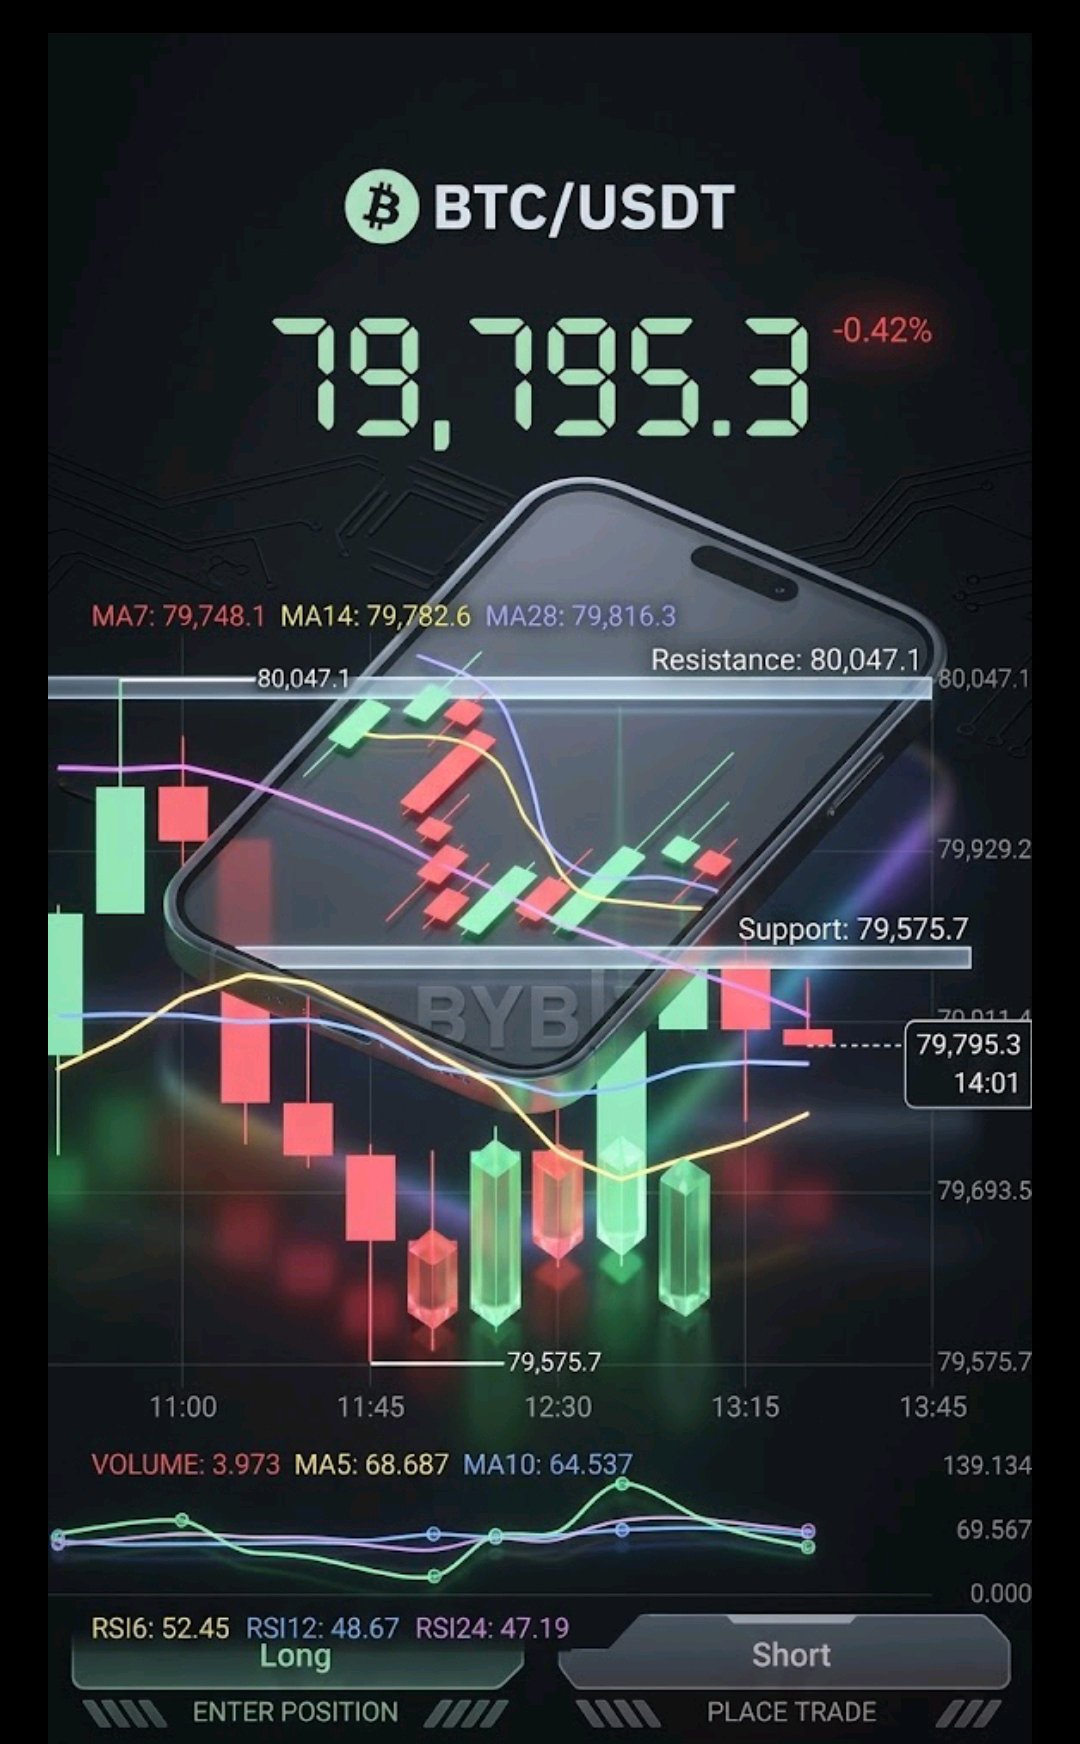
🔥 BTC 15m Rangebound! Eyes on $80K Breakout! ⚡
$BTCUSDT Bitcoin ($BTC) is hovering at $79,795.3 (-0.42%), testing the 15m moving averages with support at $79,575.7 and resistance near $80,047.1. 📊 Key Levels: Current Price: $79,795.3 24h Range: $79,461.1 - $80,852.0 Support: $79,575.7 Resistance: $80,047.1 Momentum is tight. Will BTC smash past $80K resistance next, or retest support? 📉📈 💬 Are you going Long or Short here? Drop your prediction below! 👇 #Bitcoin #BTC #CryptoTrading #Bybit #TechnicalAnalysis #WSOT2026 #IMPACTbyTrade #MyByXTake #MidtermsMarketWatch #AnthropicS1Filing
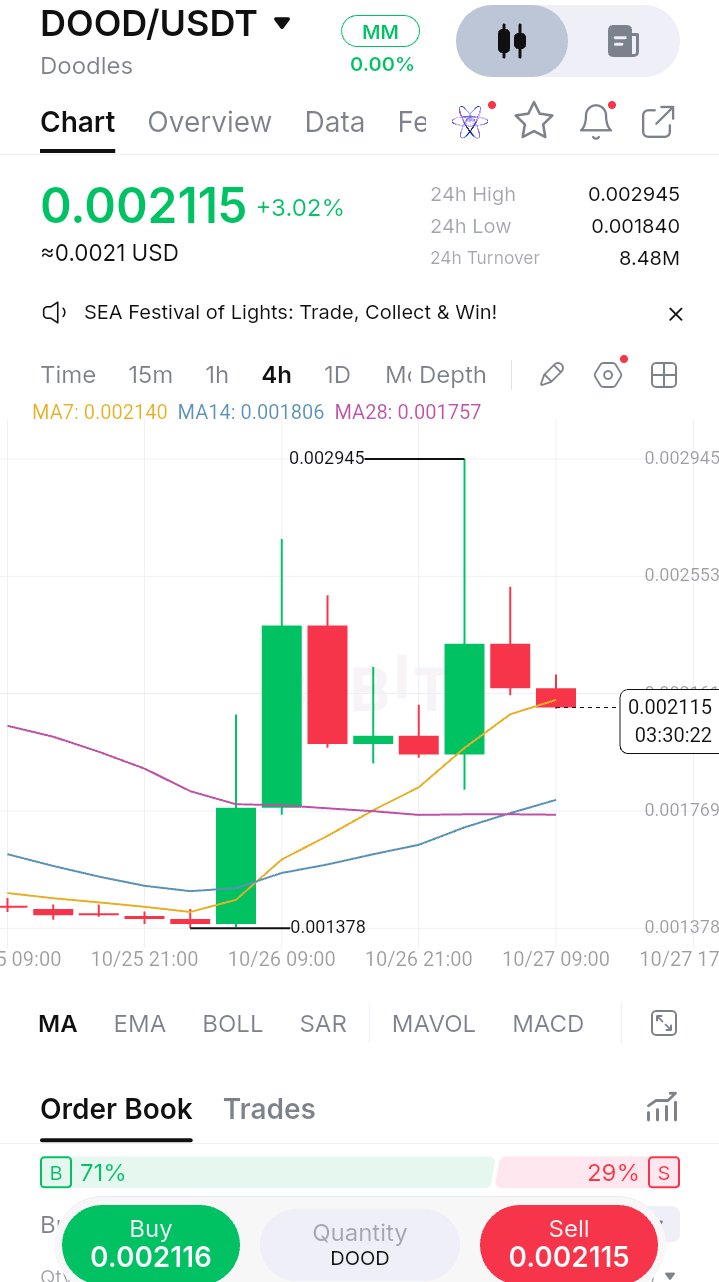
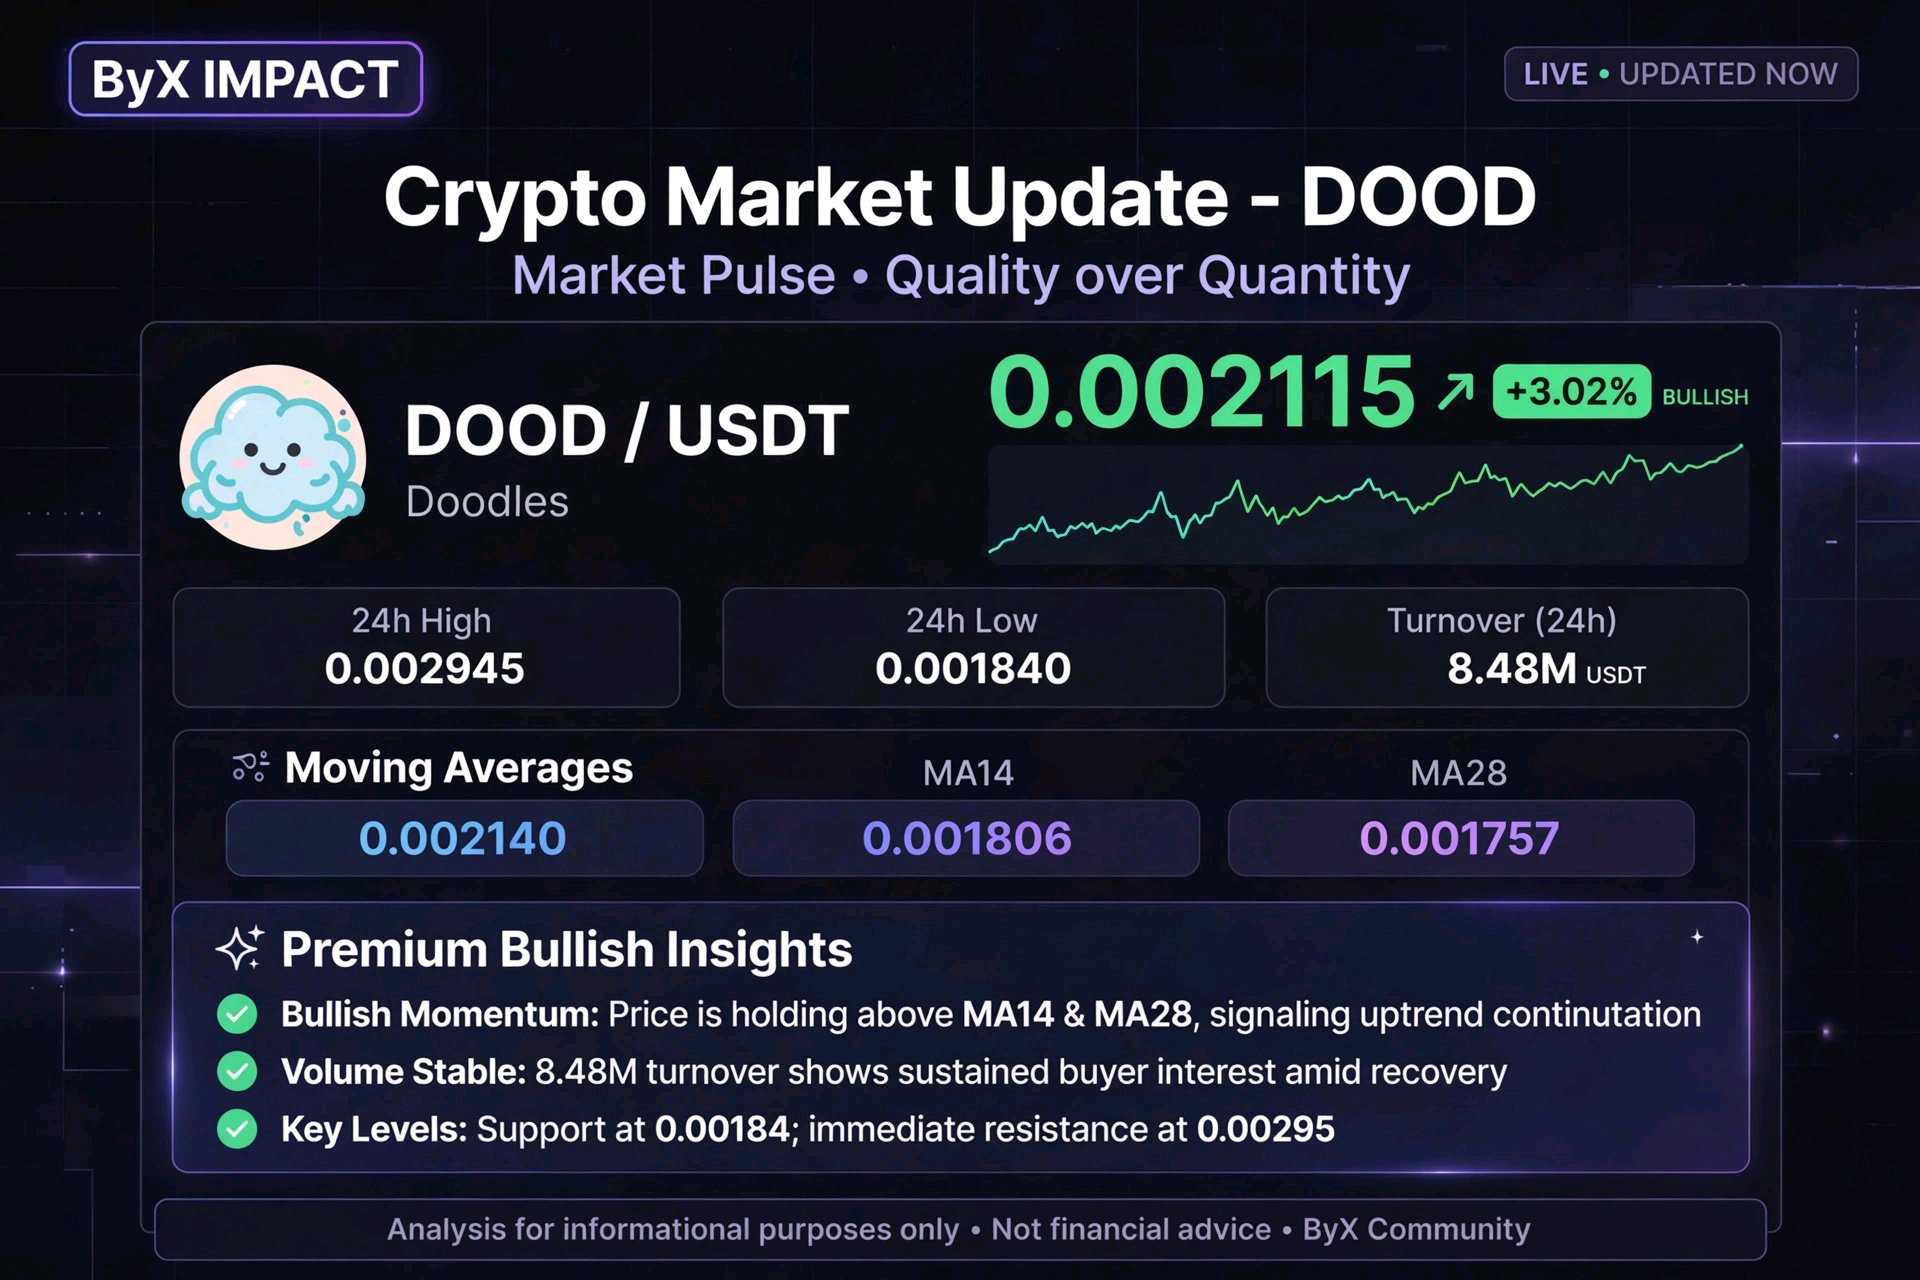
*DOOD/USDT - 0.002115 (+3.02%) | Top Gainer in your list!* $DOODUSDT *1. MA Alignment:* MA7 0.002140 | MA14 0.001806 | MA28 0.001757 Price 0.002115 is just below MA7 but ABOVE MA14 & MA28 - bullish stack with minor pullback. This is stronger than ZIG/DATA. *2. Structure - Your chart tells story:* - Base 0.001378 on 10/26 09:00 - then EXPLOSIVE +80% impulse to 0.002945 - Two big green candles = aggressive buying, then 3 red consolidation candles - Current price 0.002115 is holding above 0.00184 low - higher low pattern. Volatile but bullish. *3. Volume & Order Book:* Turnover 8.48M higher than ZIG - real interest. Order Book 71% Buy vs 29% Sell - strong buy pressure, second highest after ASTER. *4. - High Quality Angle:* > *DOOD - +3.02% after 113% range day* > DOOD printed massive range 0.001840 - 0.002945 (+60% range). Now consolidating at 0.002115, holding above MA14 0.001806. > > *What I learned:* Chasing the 0.002945 spike was trap. Patient wait for MA7 retest at 0.00214 is better entry. > > *Plan:* If closes above 0.002140 MA7, target 0.002553 then 0.002945 high. SL below 0.001840. This is momentum coin - small size only. > > Quality trade = wait for retest, not FOMO at top. #ByXIMPACT #BybitStocks

📉 $SOL 合约空单|连跌 6 天失守 100,下方 95 守得住吗? 📍 入场:$100.80 - $101.60 🛑 止损:$103.30 🎯 止盈1:$98.60 🎯 止盈2:$95.50 💡 逻辑: ① 技术结构:SOL 现在报价 $99.95,24h 小跌 0.60%,单看一天没啥感觉,但把日线图拉开就不好看了——最近 6 个交易日收盘价一路从 $106.97 滑到 $99.95,中间一根像样的反抽阳线都没有,标准的阴跌走势。均线这边空方明显占优:现价离 50 日均线 $109.47 差了一大截,短线反弹连摸都摸不到;唯一还算体面的是 200 日均线 $88.58,目前仍在下方托着,说明大周期结构没走坏,但中间这段缓冲带比较空。日线 RSI(14) 现在 33.5,离超卖区(30 以下)还差一步,意味着还没到"跌不动"的位置,往下仍有空间。关键位看两头:上方 $101.5 一带是小时线均线压力区,下方 $98.62 是近 30 日最低点,破与不破就是这波的分水岭。 ② 量能与资金:24h 成交额 1.61 亿美元,放在市值第七的身段上只能说中规中矩——既没有恐慌性的放量出逃,也没看到抄底资金大举进场,整体是缩量阴跌的节奏。这种走法通常说明抛压温和但持续、承接意愿不足,价格容易被慢慢磨下去。资金面还有个绕不开的压力:现货 SOL ETF 近期每天净流出约 4 万枚 SOL,机构端一直在往外搬,这跟后面那堆利好形成了明显对冲。衍生品端 Polymarket 上押注"年底前跌破 $100"的概率一度给到 79%,市场对下方空间的定价明显比上方积极。 ③ 基本面催化:说句公道话,SOL 这轮消息面真不差,甚至是主流币里最亮眼的。10 月 21 日主网激活 Alpenglow 共识升级,交易最终确认时间从约 12.8 秒压到约 150 毫秒,验证者运营成本还降了约 60%,这是它 2020 年上线以来共识层最大的一次改动;紧接着 10 月 22 日摩根大通把两只代币化货币市场基金(近 9 亿美元规模)放到了 Solana 上;RWA 更猛,10 月 18–25 日一周吸走 4.535 亿美元代币化基金净流入,占前十网络总量的 73%。此外 30 天链上收入 1.931 亿美元、稳定币规模 155 亿美元,3 月 SEC 还把 SOL 归为数字商品。问题就出在这儿——利好这么密集,价格不但没涨,反而从 $106 磨到 $100,典型的利好兑现后多头乏力,$100 这关口就是多空掰腕子的地方。 ④ 情绪与风险:情绪面上 SOL 现在挺尴尬——利好管够但资金不买账,跟跌大盘的时候比跟涨积极,属于情绪偏弱、板块联动被大盘拖着走的状态。风险主要两个:一是 $100 是整数关口兼心理支撑,短线容易出现技术性反抽,直接追空容易被反手打掉;二是机构预测分歧极大,21Shares 给 2026 年基准目标 $150、渣打更乐观看到 $250,可衍生品市场却押注大概率再破 $100,任一边资金突然发力都会放大波动。所以纪律讲明白:这是顺势空、不是无脑追空,只在 $100.80–$101.60 反抽区介入,止损 $103.30 放在近 30 小时高点上方,价格不到不做,破了止损就认错走人,仓位别上头。 你觉得这波 SOL 能跌破 $98.6 的前低,还是在 $100 附近磨出个底来?评论区聊聊你的目标价,记得带好止损再上。$SOLUSDT
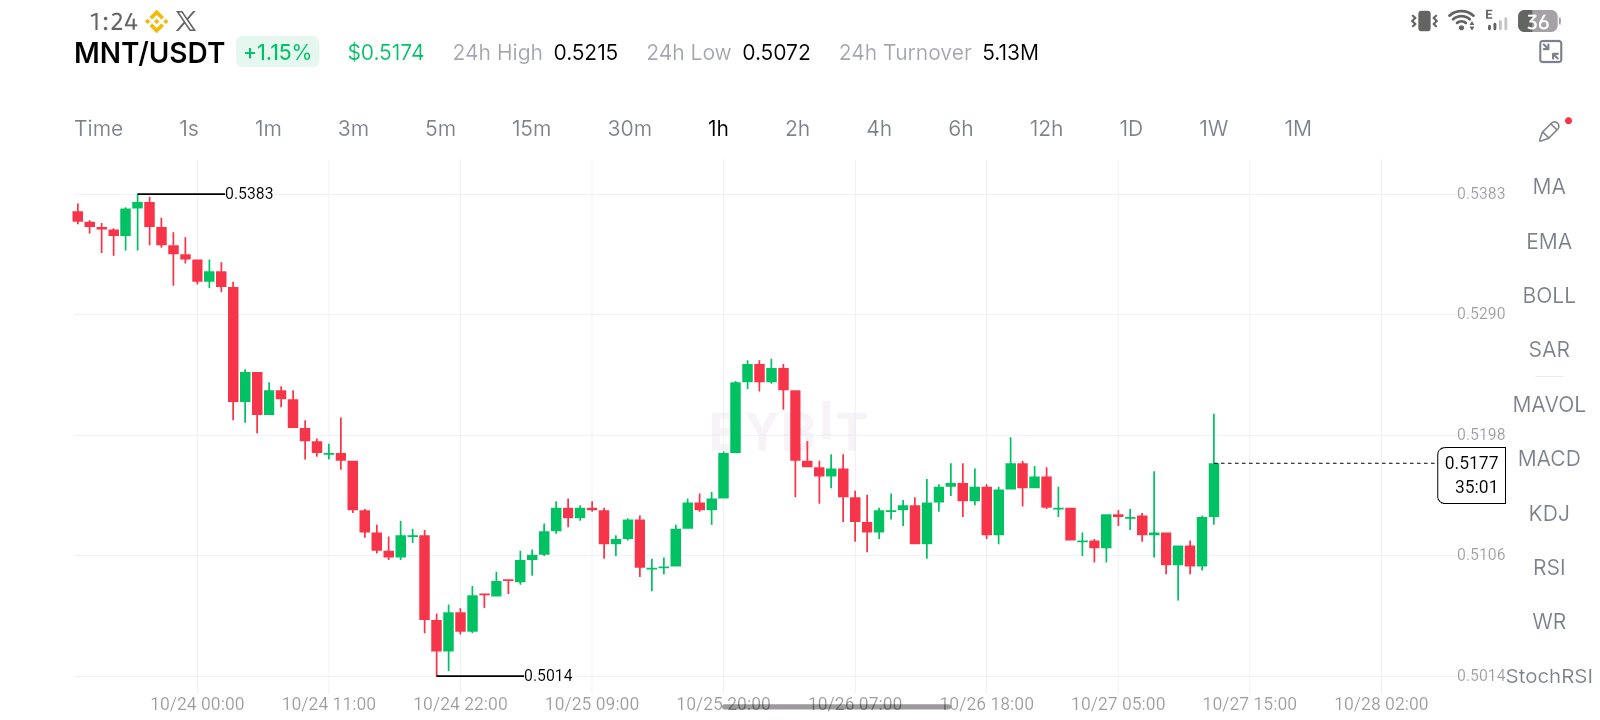
🚨 MNT/USDT — THE QUIET MOVE MAY BE OVER 👀🔥 MNT is sitting around $0.5174 (+1.15%), and the chart is starting to look VERY interesting. After falling from the $0.5383 area down to around $0.5014, MNT has spent days building a base instead of continuing the breakdown. Now look at what just happened… 👇 ⚡ PRICE: $0.5174 📈 24H HIGH: $0.5215 📉 24H LOW: $0.5072 💰 24H TURNOVER: 5.13M The latest 1H candle shows a powerful push upward from the $0.510–$0.512 zone. That makes the next few candles VERY important. 🎯 KEY RESISTANCE • $0.5198 — immediate breakout zone • $0.5215 — 24H high / first major test • $0.5290 — next psychological resistance • $0.5383 — major previous high 🛡️ KEY SUPPORT • $0.5120–$0.5106 — first support zone • $0.5072 — recent 24H low • $0.5014 — major chart support 🔥 THE INTERESTING PART If MNT can reclaim and hold above $0.5198–$0.5215 with strong volume, the market could suddenly start paying attention. A clean breakout could open the path toward: ➡️ $0.5290 ➡️ $0.5383 But here's the trap… ❌ A rejection around $0.5198–$0.5215 followed by a loss of $0.5106 could send price back toward $0.5072, with $0.5014 becoming the bigger downside level. So this isn't the moment to blindly chase a green candle. 👀 WATCH THE BREAKOUT. WATCH THE VOLUME. WATCH THE RETEST. MNT is approaching a decision point. The next move could turn this boring range into a very interesting chart. ⚡ Bullish above the resistance zone. Cautious below support. No confirmation = no chase. #ByXIMPACT $MNTUSDT


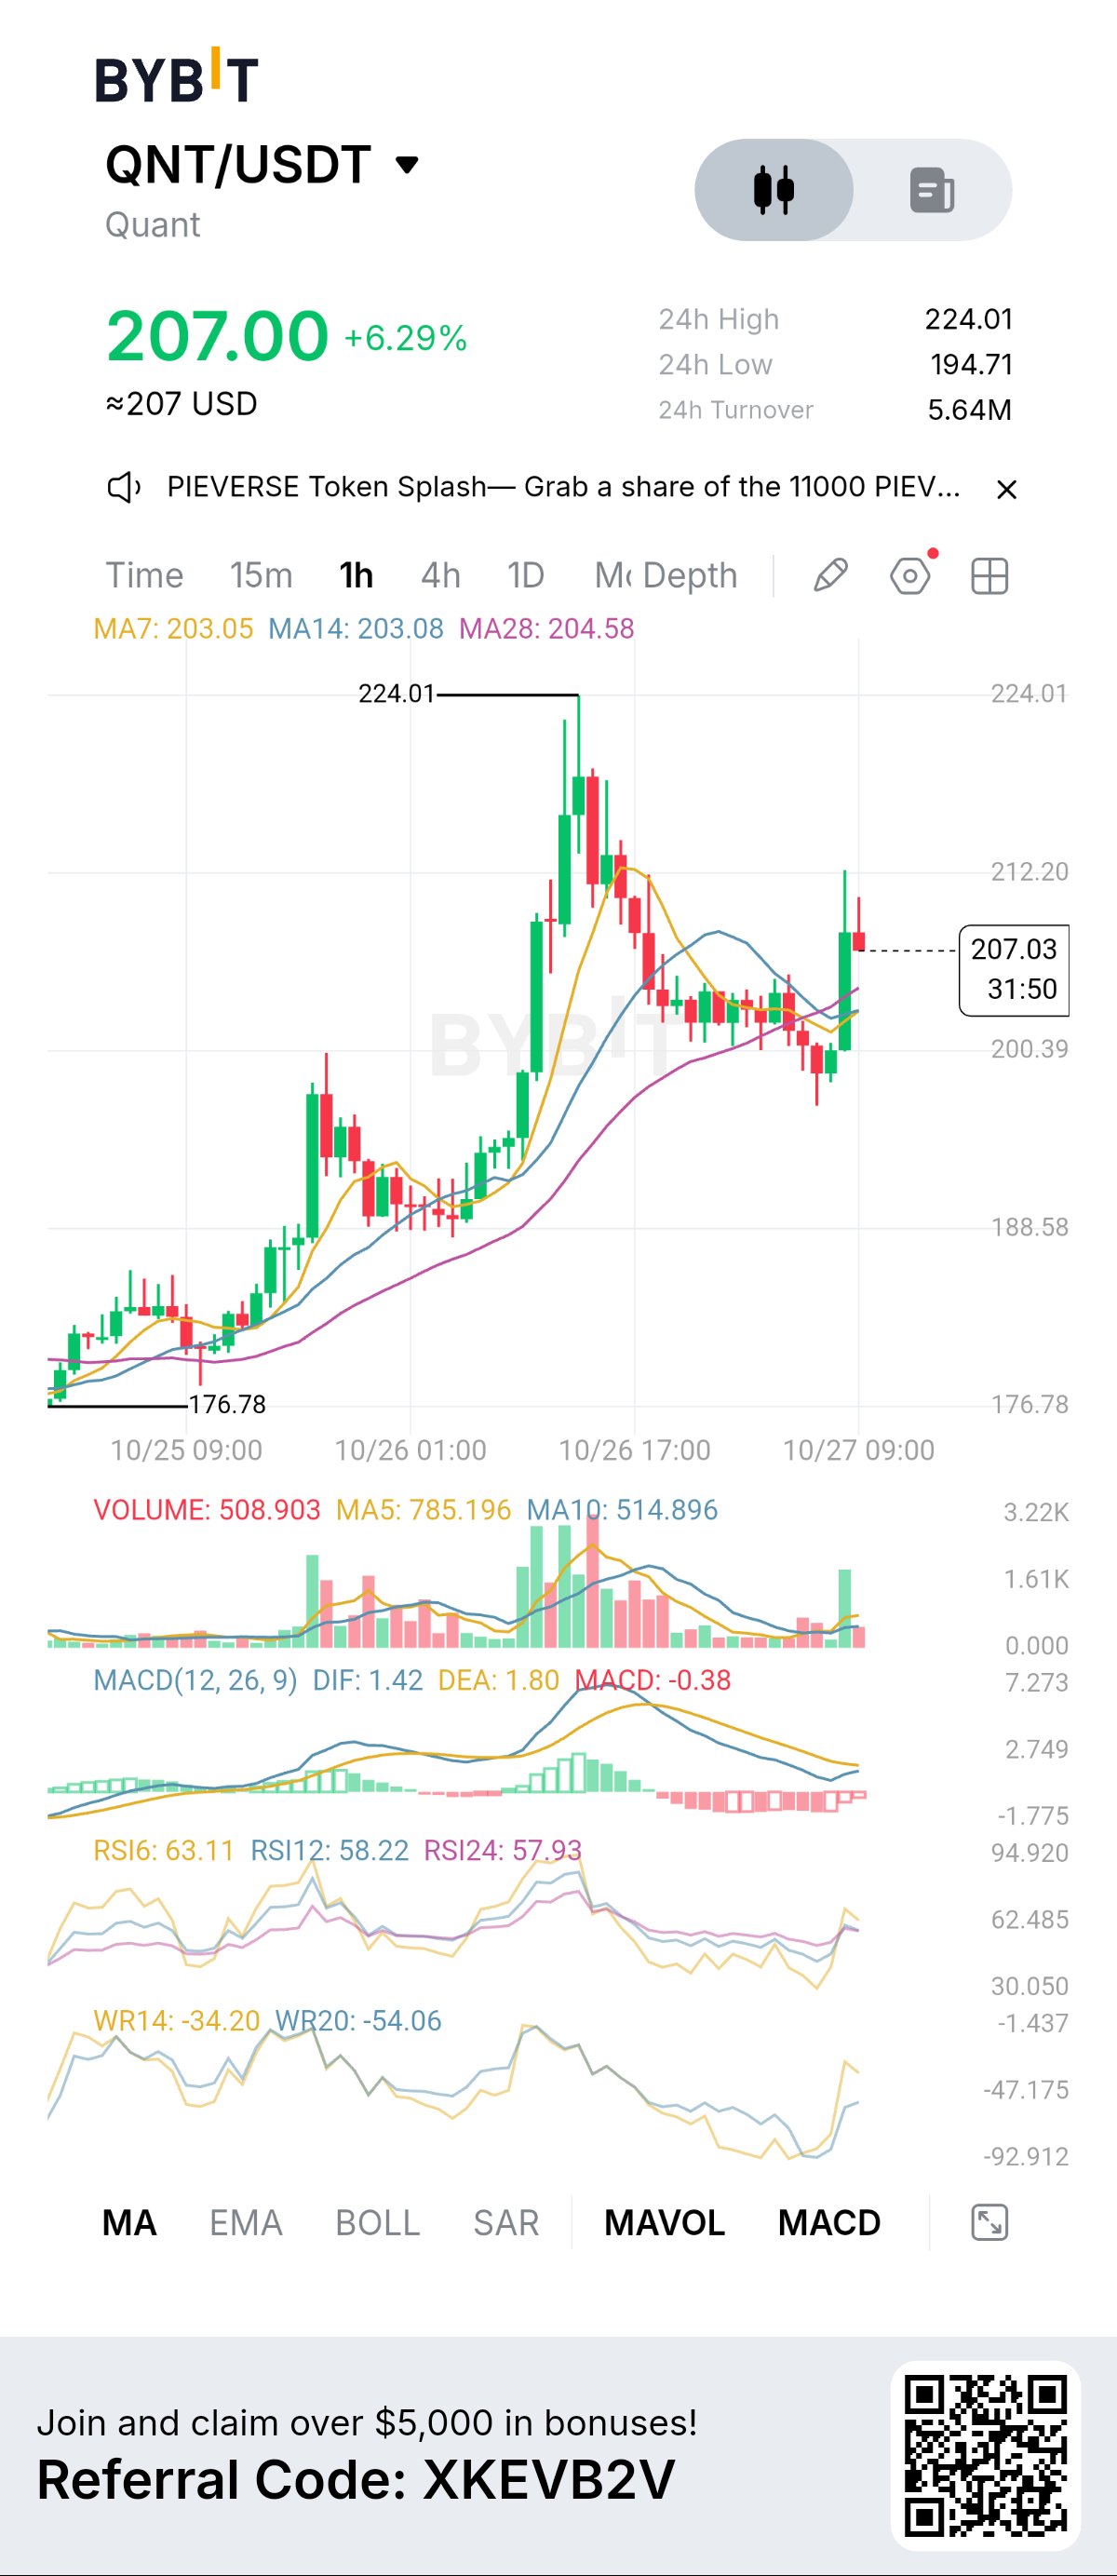
🚨 QUANT (QNT) SURGES 6.29%! 🚀 IS A BIGGER BREAKOUT COMING? 🔥 $QNTUSDT is making a strong move, trading around $207.00 after climbing sharply from its recent lows. Buyers have stepped in following a pullback from $224.01, and traders are watching to see whether QNT can regain its upward momentum. 💰 QNT MARKET UPDATE 🔹 Current Price: $207.00 🔹 24H Change: +6.29% 🔹 24H High: $224.01 🔹 24H Low: $194.71 🔹 Trading Pair: QNT/USDT 🔹 Timeframe: 1 Hour 📊 KEY LEVELS TO WATCH 🚀 Resistance: $212.20 🎯 Major Resistance: $224.01 🛡️ Support: $203.00–$200.39 ⚠️ Lower Support: $194.71 📈 TECHNICAL ANALYSIS 🟢 RSI: The RSI6 is around 63, showing positive short-term momentum, although further confirmation is needed. 🟡 MACD: The MACD remains below its signal line, suggesting the earlier bearish momentum has not fully disappeared. 🟢 Moving Averages: QNT is trading near $207, above the MA7, MA14, and MA28 levels shown on the chart. This is an encouraging short-term signal for buyers. 🔥 WHAT COULD HAPPEN NEXT? 🚀 Bullish Scenario: A sustained move above $212.20 could open the way toward a retest of $224.01. 📉 Bearish Scenario: If QNT falls below $203 and loses the $200.39 support zone, the price could weaken toward $194.71. 👀 FINAL OUTLOOK QNT is showing encouraging short-term strength after its recent pullback. However, traders should watch the $212 resistance closely and look for stronger volume before assuming another major rally is underway. 💬 YOUR PREDICTION: WHERE IS QNT HEADING NEXT? 🚀 $224 — Bulls take control! 📉 $200 — A deeper pullback? 🔥 $230 — A new breakout target? Share your prediction in the comments! This analysis is based on the supplied chart and is for educational purposes only, not financial advice. Always manage your risk. #ByXIMPACT
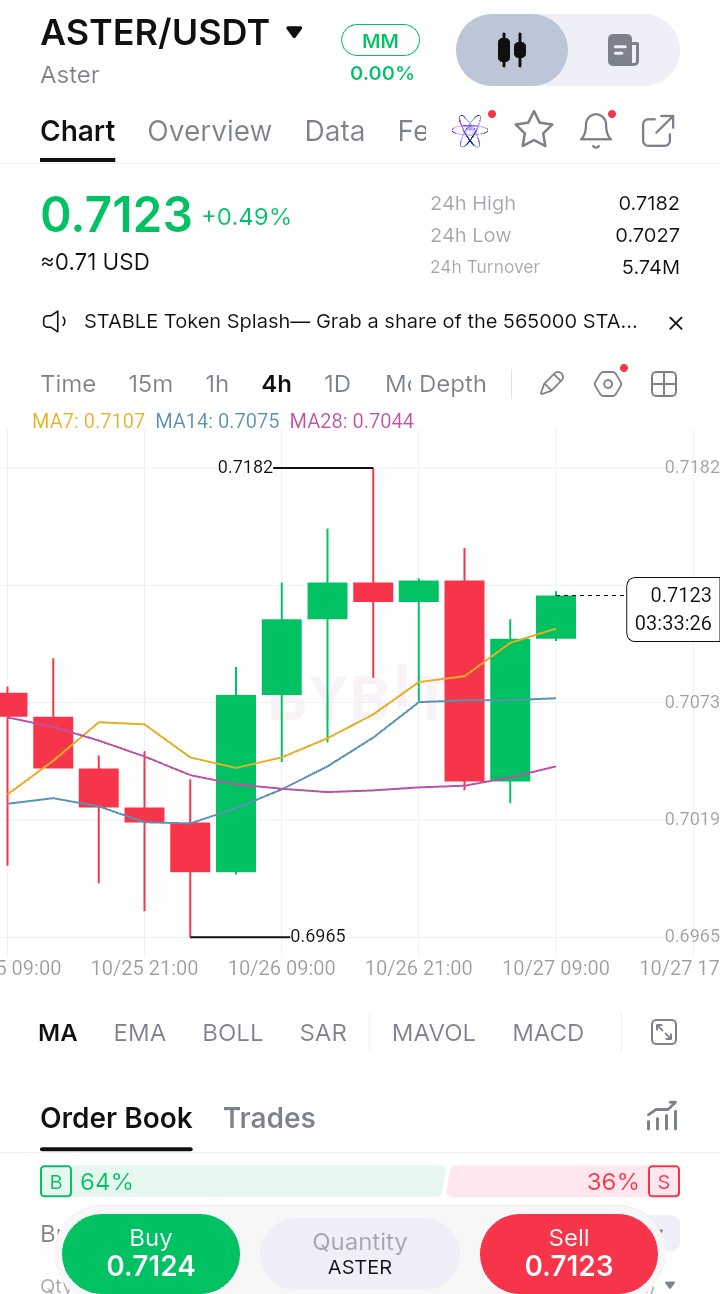
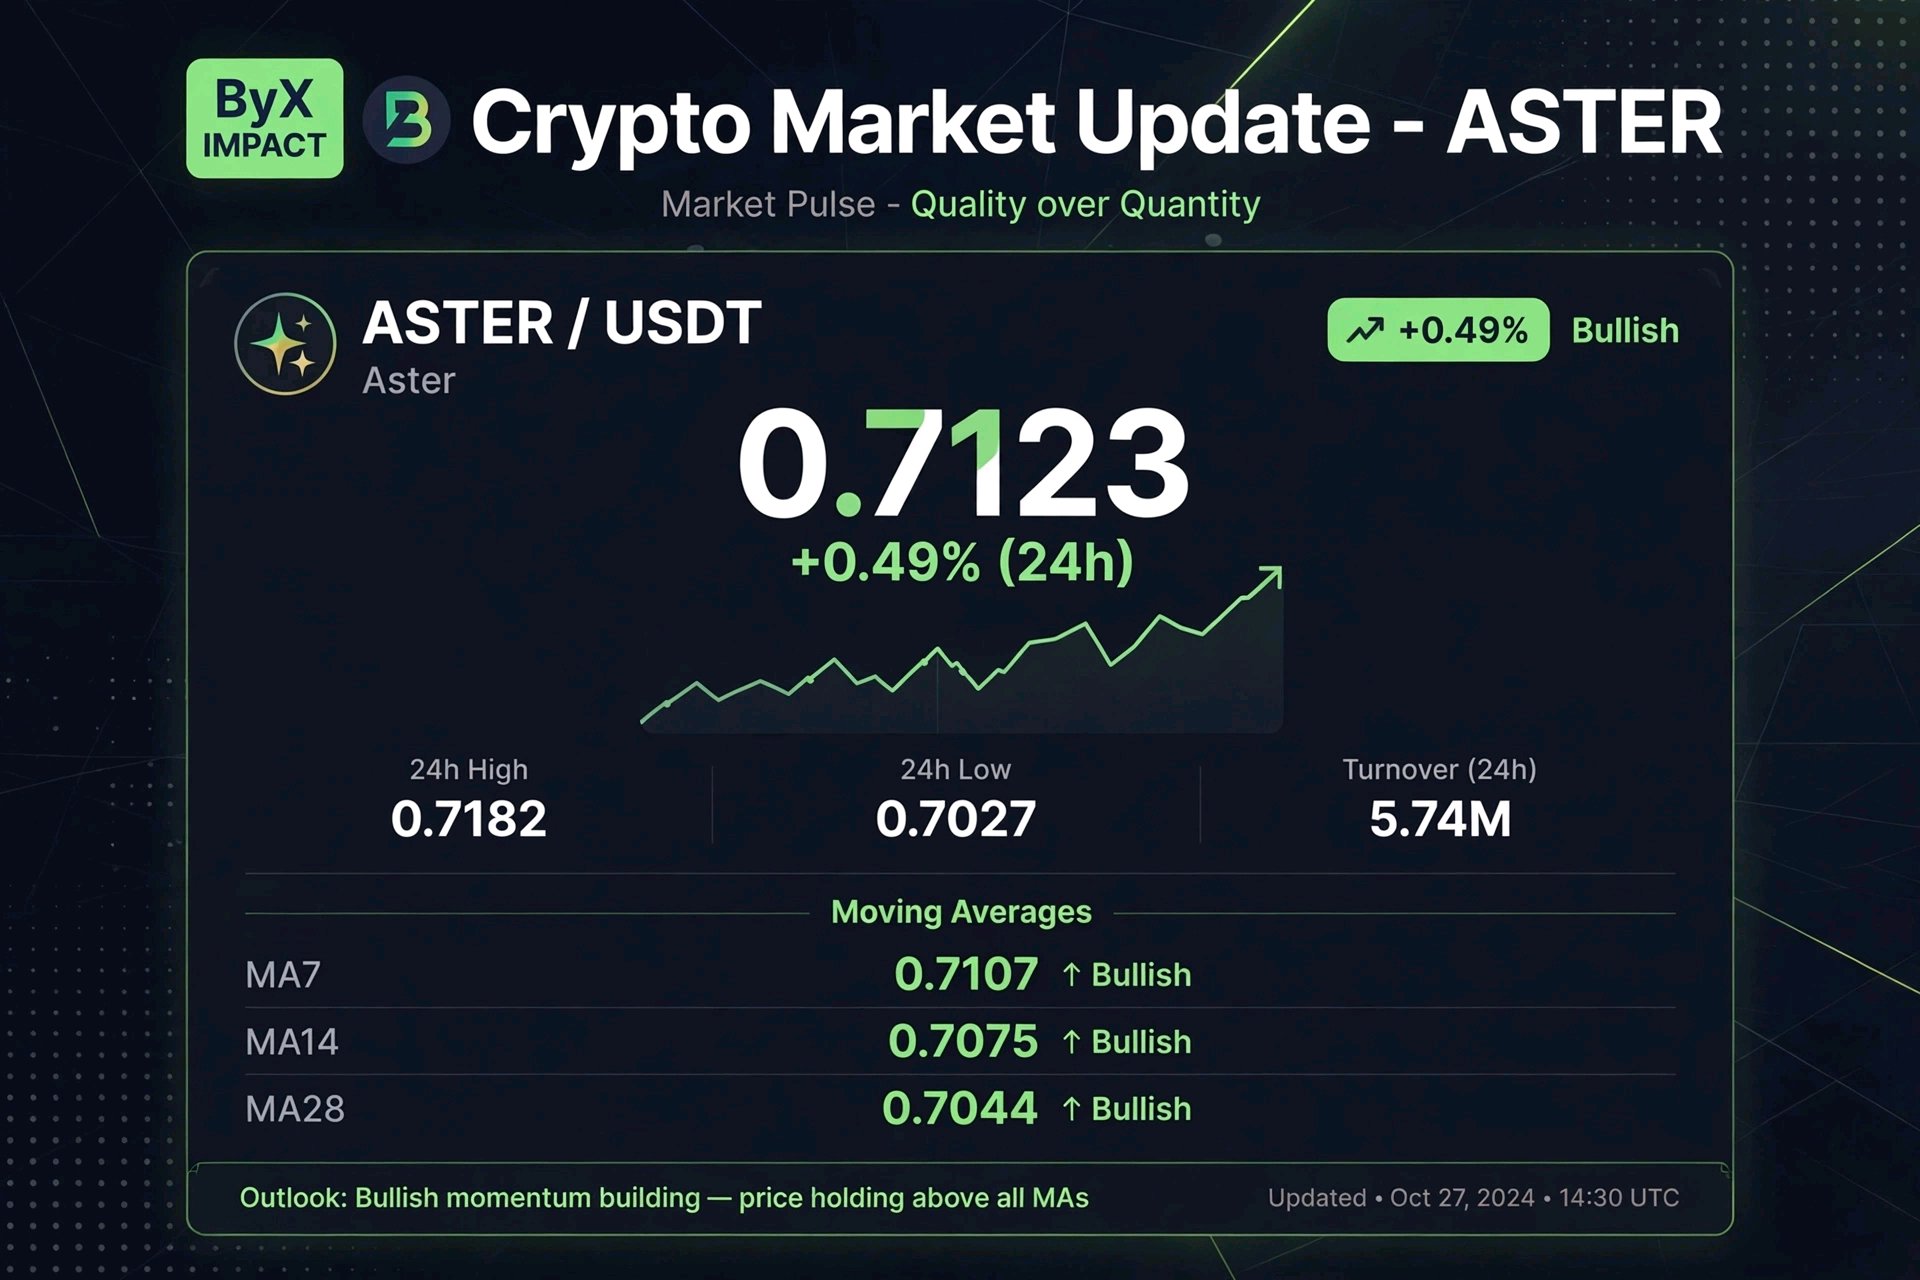
$ASTERUSDT *ASTER - 0.7123 (+0.49%) | High 0.7182 Low 0.7027 | Turnover 5.74M* *1. Perfect MA Stack:* MA7 0.7107 | MA14 0.7075 | MA28 0.7044 Price 0.7123 is ABOVE all 3 MAs, and MAs are in bullish order MA7 > MA14 > MA28. This is the OPPOSITE of DATA, AAVE, WLD. Strongest chart you posted today. *2. Structure from your screenshot:* - Low 0.6965 on 10/26 00:00 - then huge green impulse candle on 10/26 09:00 - reversal start - High 0.7182 tested, then pullback to 0.7027, then now reclaiming 0.7123. Higher lows since bottom. - Current candle 0.7123 closing near high with small wick = buyers in control. *3. Order Book:* 64% Buy vs 36% Sell - healthy bullish bias, not extreme 99% like DATA. Real demand. *4. Trade Plan > *ASTER - Bullish Reversal Confirmed* > After sweeping 0.6965 low, ASTER reclaimed all MAs. Price 0.7123 holding above MA7 0.7107 is key. > > *What happened:* I avoided chasing at 0.7182 high, waited for pullback to MA7. Now structure is higher lows. > > *What I learned:* Not all altcoins are same - while DATA/AAVE bleed, ASTER shows relative strength. Focus capital on strength. > > *Next:* Watching 0.7182 breakout. If 4H close above, target 0.7250. SL below 0.7075 (MA14). Risk 1% only. #ByXIMPACT #MyByXTake #IMPACTbyTrade

BTC 4H Update
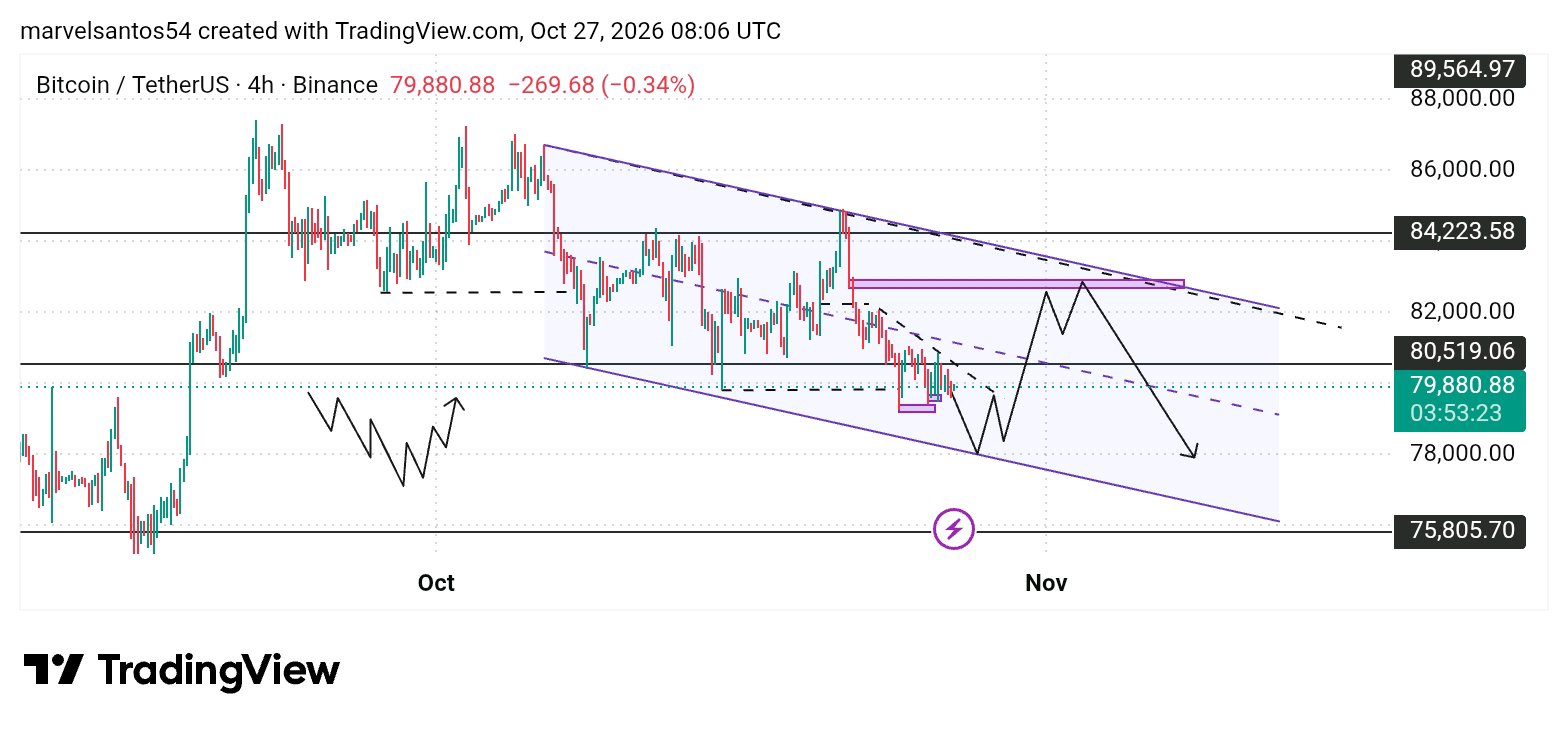
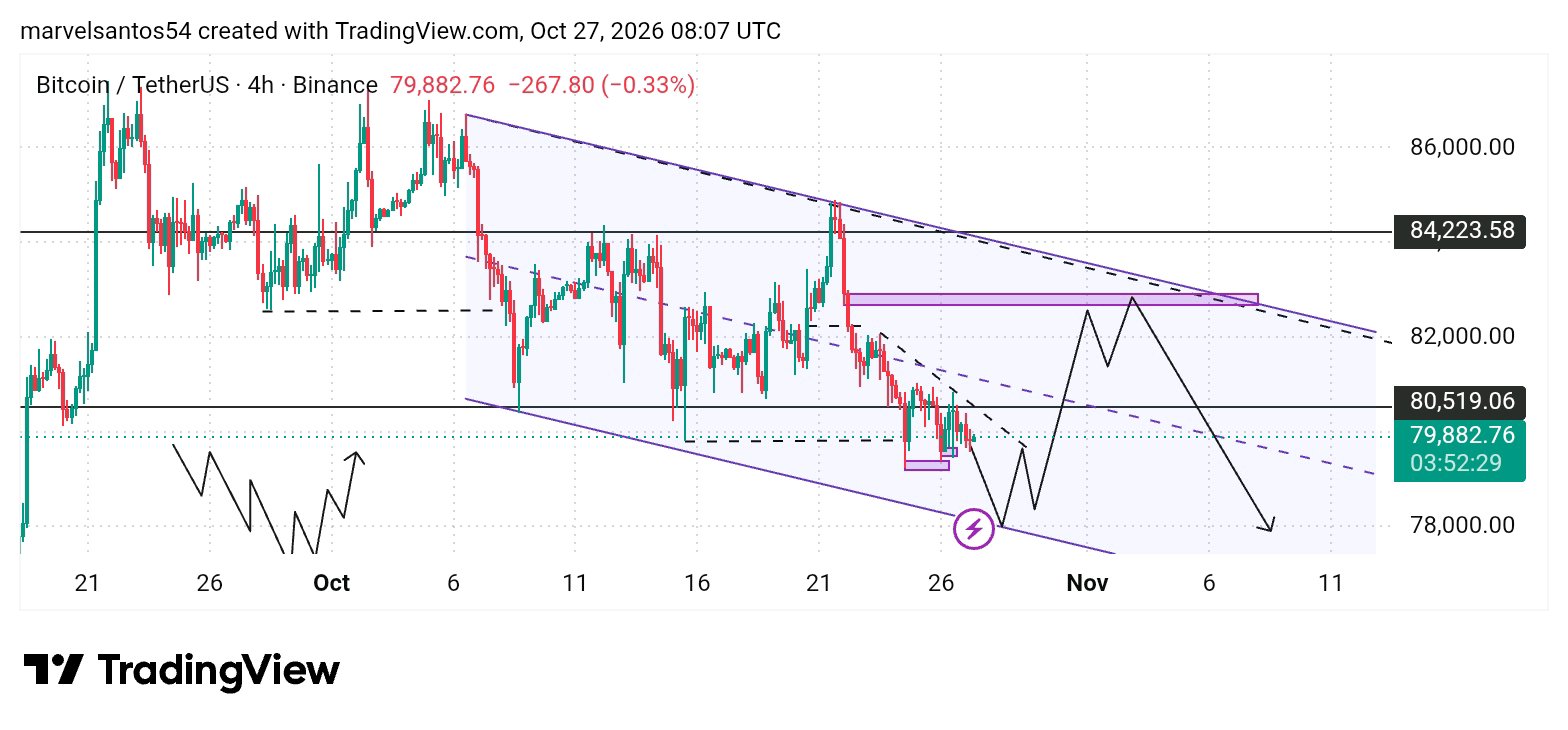
Bitcoin is still trapped in a descending channel since early October. Price at ∼$79,880 is holding the $80,519 support but looking weak. The recent pump to $84k was a fakeout — tapped the channel top + $82.5k supply zone (purple box) and got rejected hard. We swept the lows around $79.3k liquidity. My projection: Short-term bounce to $78k-$77.5k (channel bottom) for a final liquidity grab, then a relief to retest $82.5k resistance, then continuation down towards $75,805. Bias: Bearish as long as we stay below $82.5k-$84,223. Invalidation: Break and close above $84,223. Manage risk.$BTCUSDT $ETHUSDT

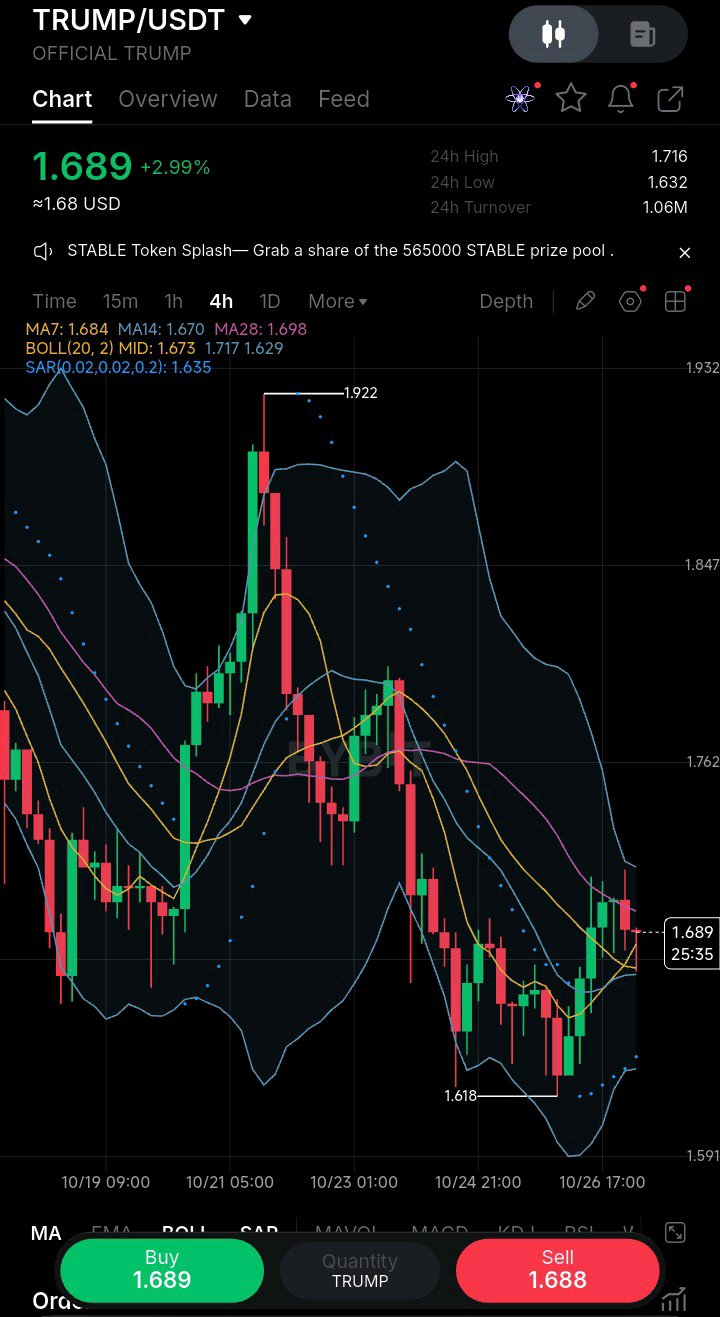
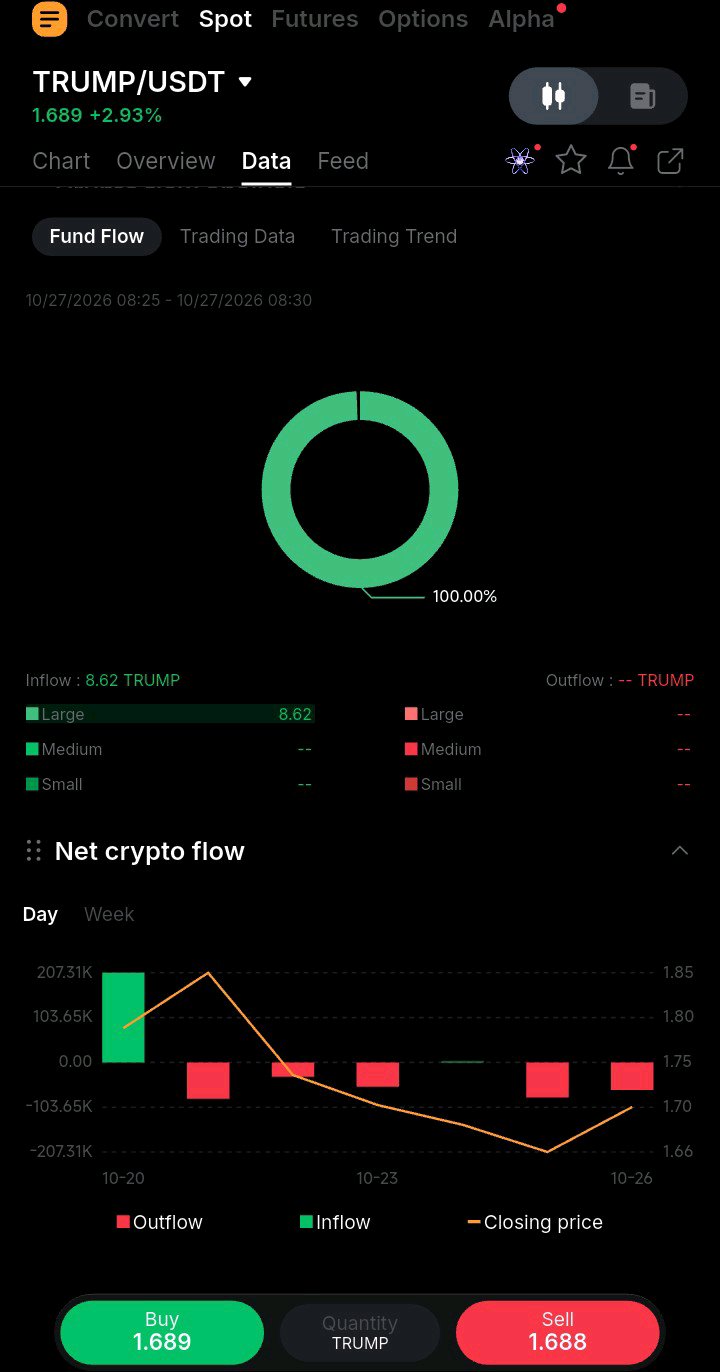
$TRUMPUSDT : A Green Candle Doesn't Always Mean a Trend Reversal OFFICIAL TRUMP is showing positive momentum on the Bybit gainers list, rising approximately 2.37% to $1.683 in the snapshot shared. But here's the question I'm more interested in: Is this the beginning of a recovery, or just a temporary bounce? Meme coins can move quickly when speculative interest returns. However, short-term gains alone don't confirm that buyers have regained control. 🔍 Three things I'm watching: 📈 Bullish scenario: If TRUMP maintains buying pressure and pushes through nearby resistance, the recovery could extend. Earlier market analysis identified the $1.80–$1.85 area as a zone to watch. 📉 Bearish scenario: If buyers lose momentum and the price falls back below nearby support, the current bounce could fade. Previous analysis highlighted $1.65 as an important level to monitor. ⚠️ The risk: A rising price without sustained buying interest can attract late entries just before a pullback. My approach is simple: I want to see confirmation, not just a green percentage on a leaderboard. A coin being among today's gainers makes it worth investigating, but it doesn't automatically make it a good entry. #ByXIMPACT #IMPACTbyTrade #WSOT2026

📊 Ринок завмер перед ФРС. Наші угоди вже показують, чому зараз важливо не поспішати. BTC тримається біля $79 819, Fear & Greed — 48. Ринок не визначився з напрямком, але всередині альткоїнів уже є цікава ротація. Поки BTC і SOL слабшають, HYPE +2,07%, XRP +1,97% та ONDO +1,97%. Саме такі розбіжності зараз привертають мою увагу. Але спочатку — трохи про власну торгівлю. 📉 APR — шорт, який не спрацював. Вхід близько $0,0340, стоп — $0,0364. Після падіння до $0,0321 ціна відскочила й вибила позицію. Згодом рух униз продовжився, але це вже не змінює результату: стоп спрацював раніше. 📉 ENA — лонг, який не підтвердився. Вхід $0,20883, вихід по стопу $0,20553, плече 10х. Ціна виглядала сильніше на короткому таймфреймі, але не змогла розвинути імпульс. Ковзні середні дали частину картини, але не гарантували продовження зростання. ⚡ HYPE — новий сценарій. Вхід у зоні $76,50–77,50. Стоп — $73,50. Цілі: $80,15 / $84,67 / $92,64. Чому саме HYPE? Він показував відносну силу на слабкому ринку, а відкритий інтерес за добу знизився приблизно на 2,5%. Це може створити умови для short squeeze, але ще не підтверджує його. Позиція відкрита за сценарієм, а не з гарантією результату. 🌍 Що може змінити картину? У центрі уваги — рішення ФРС і коментарі голови. Важливі не лише ставки, а й тон заяв: жорстка риторика може посилити тиск на ризикові активи, нейтральна — продовжити боковик, м’якша — дати ринку шанс на відновлення. Додатково стежу за даними ВВП США, звітами Microsoft і Alphabet та експірацією BTC-опціонів. Мій висновок: після двох стопів немає сенсу поспішати відіграватися. APR і ENA нагадали, що навіть логічний сценарій може не спрацювати. У HYPE зараз є аргументи на користь лонгу, але макрофон залишається ризиком. Тому план простий: контролювати ризик, не пересувати стоп через емоції та оцінювати реакцію BTC після новин. Якщо ринок дасть підтвердження — працюємо за планом. Якщо ні — збереження капіталу важливіше за бажання вгадати рух. $BTCUSDT $ENAUSDT

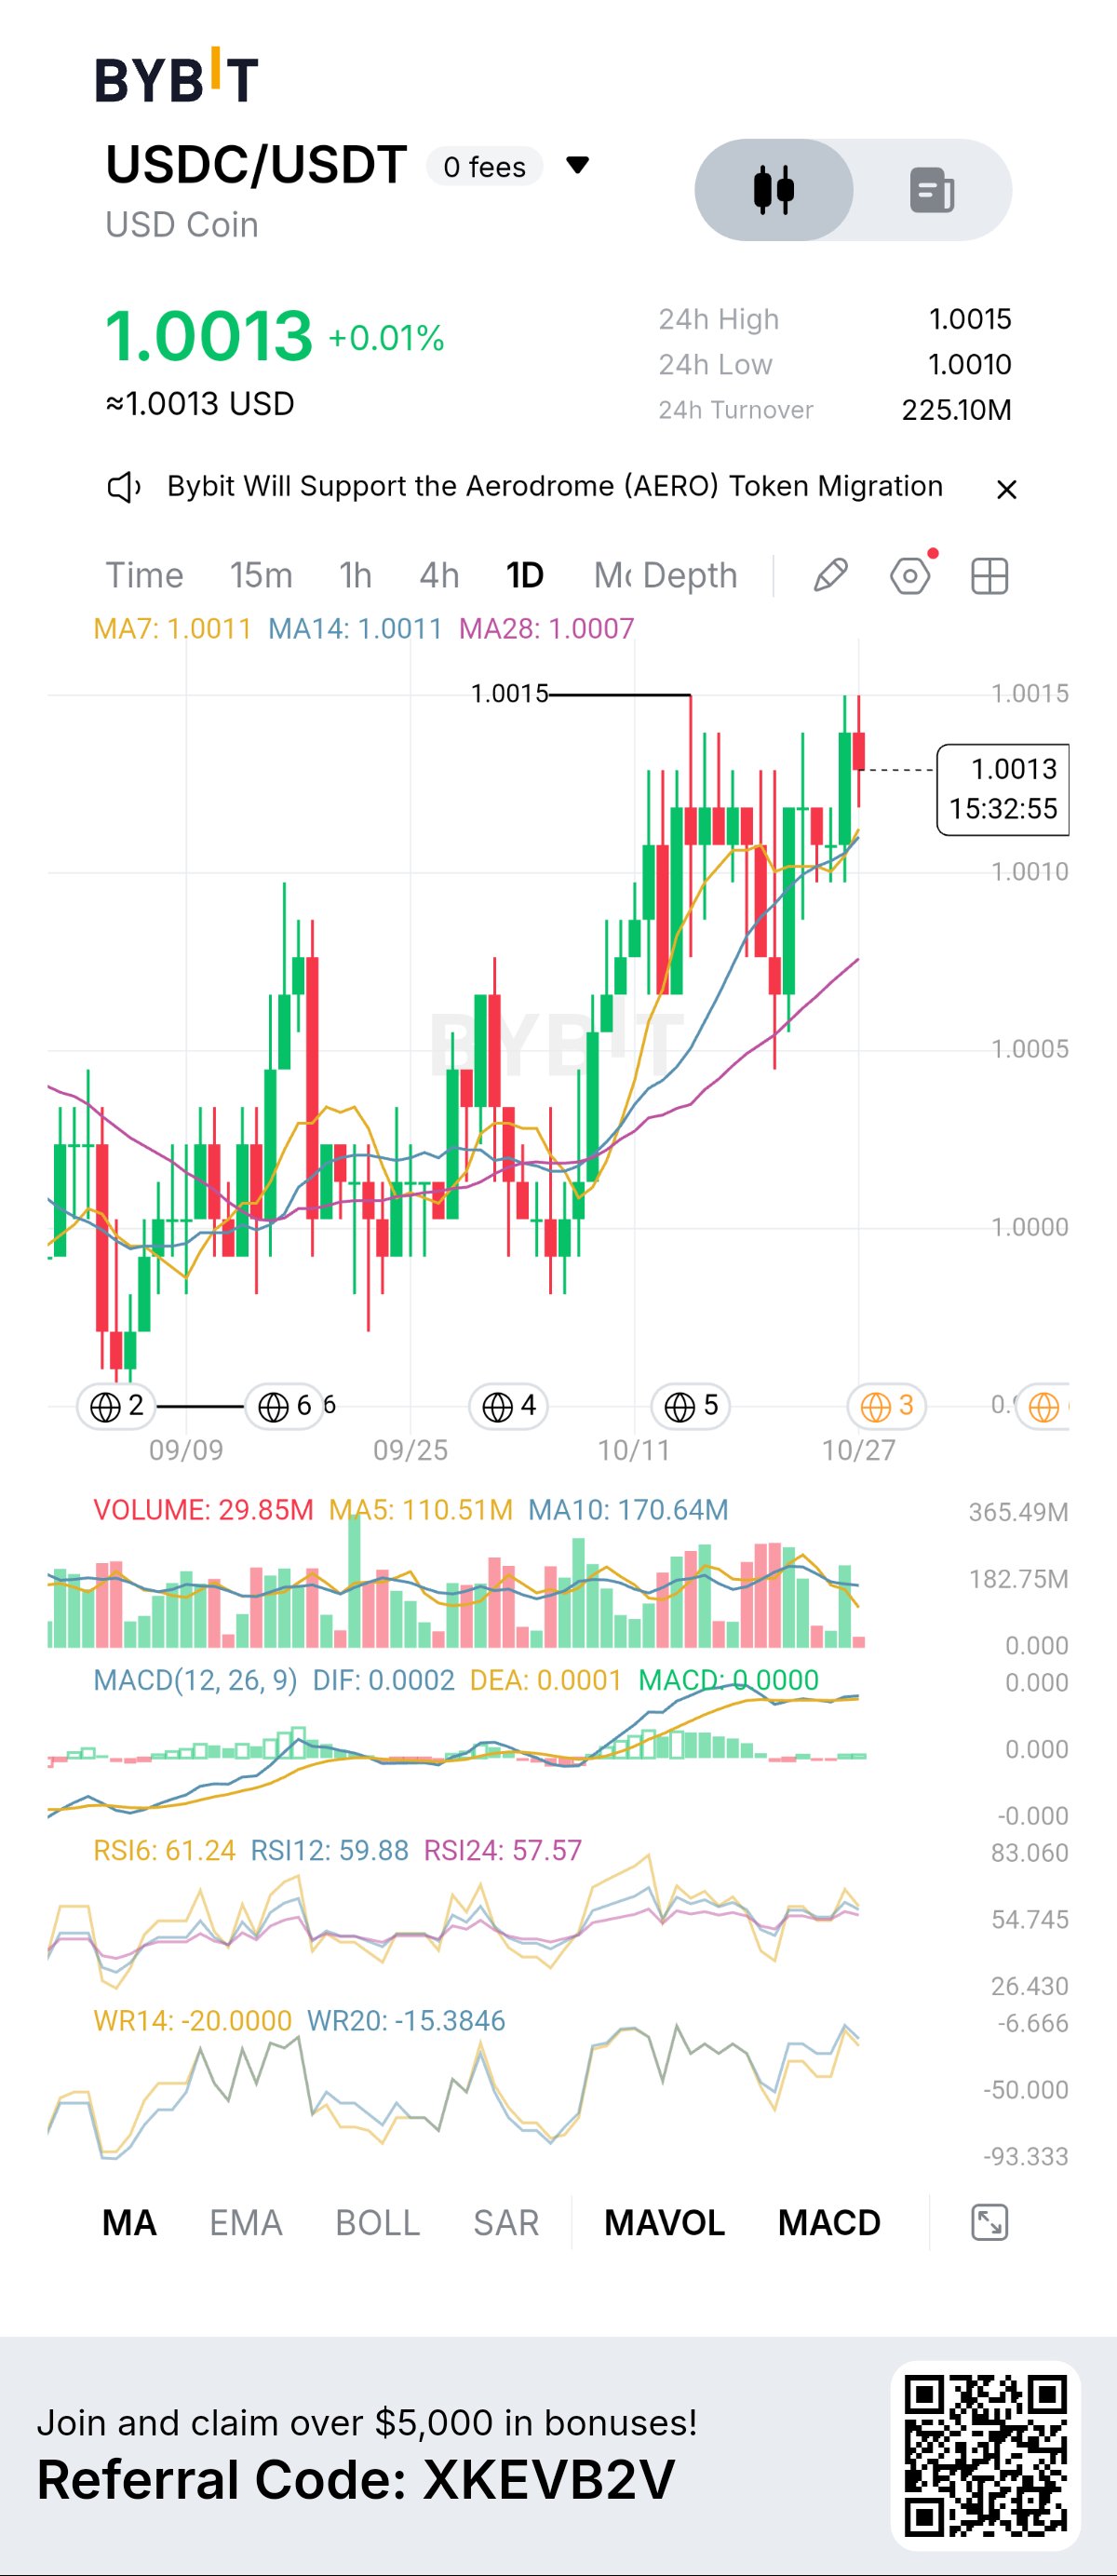
🚨 USDC PRICE ALERT: USD COIN HOLDS ABOVE $1.00 AS BUYING MOMENTUM STRENGTHENS! 📈🔥 $USDCUSDT is trading at $1.0013, maintaining its dollar peg while the latest daily chart shows positive momentum. Traders are watching closely as the price approaches the recent high of $1.0015. 💰 USDC MARKET UPDATE 🔹 Current Price: $1.0013 🔹 24H Change: +0.01% 🔹 24H High: $1.0015 🔹 24H Low: $1.0010 🔹 Trading Pair: USDC/USDT 🔹 Timeframe: 1 Day 📊 TECHNICAL ANALYSIS 🟢 Moving Averages: The price is above the MA7, MA14, and MA28, indicating positive short-term chart momentum. 🟢 RSI: Readings between 57 and 61 show relatively strong momentum without an extreme overbought signal on these indicators. 🟡 MACD: The indicator is near zero, suggesting limited momentum and the possibility of consolidation. 🎯 KEY LEVELS TO WATCH 🚀 Resistance: $1.0015 🛡️ Support: $1.0010 📍 Main Psychological Level: $1.0000 🔥 WHAT COULD HAPPEN NEXT? If buying pressure continues, USDC could test the $1.0015 high again. If momentum weakens, the price may retreat toward $1.0010. However, USDC is a stablecoin designed to track the US dollar, so small price movements against USDT do not necessarily indicate a major bullish breakout. Maintaining the peg is more important than price appreciation. 💎 FINAL THOUGHTS USDC remains close to $1.00, with the chart showing modest positive momentum. Traders should watch for price stability, liquidity, and any deviation from its intended dollar peg. 💬 What do you think? Will USDC remain stable around $1.00, or could volatility increase? Share your thoughts below! Market analysis based on the supplied chart. This is for educational purposes only, not financial advice. #ByXIMPACT
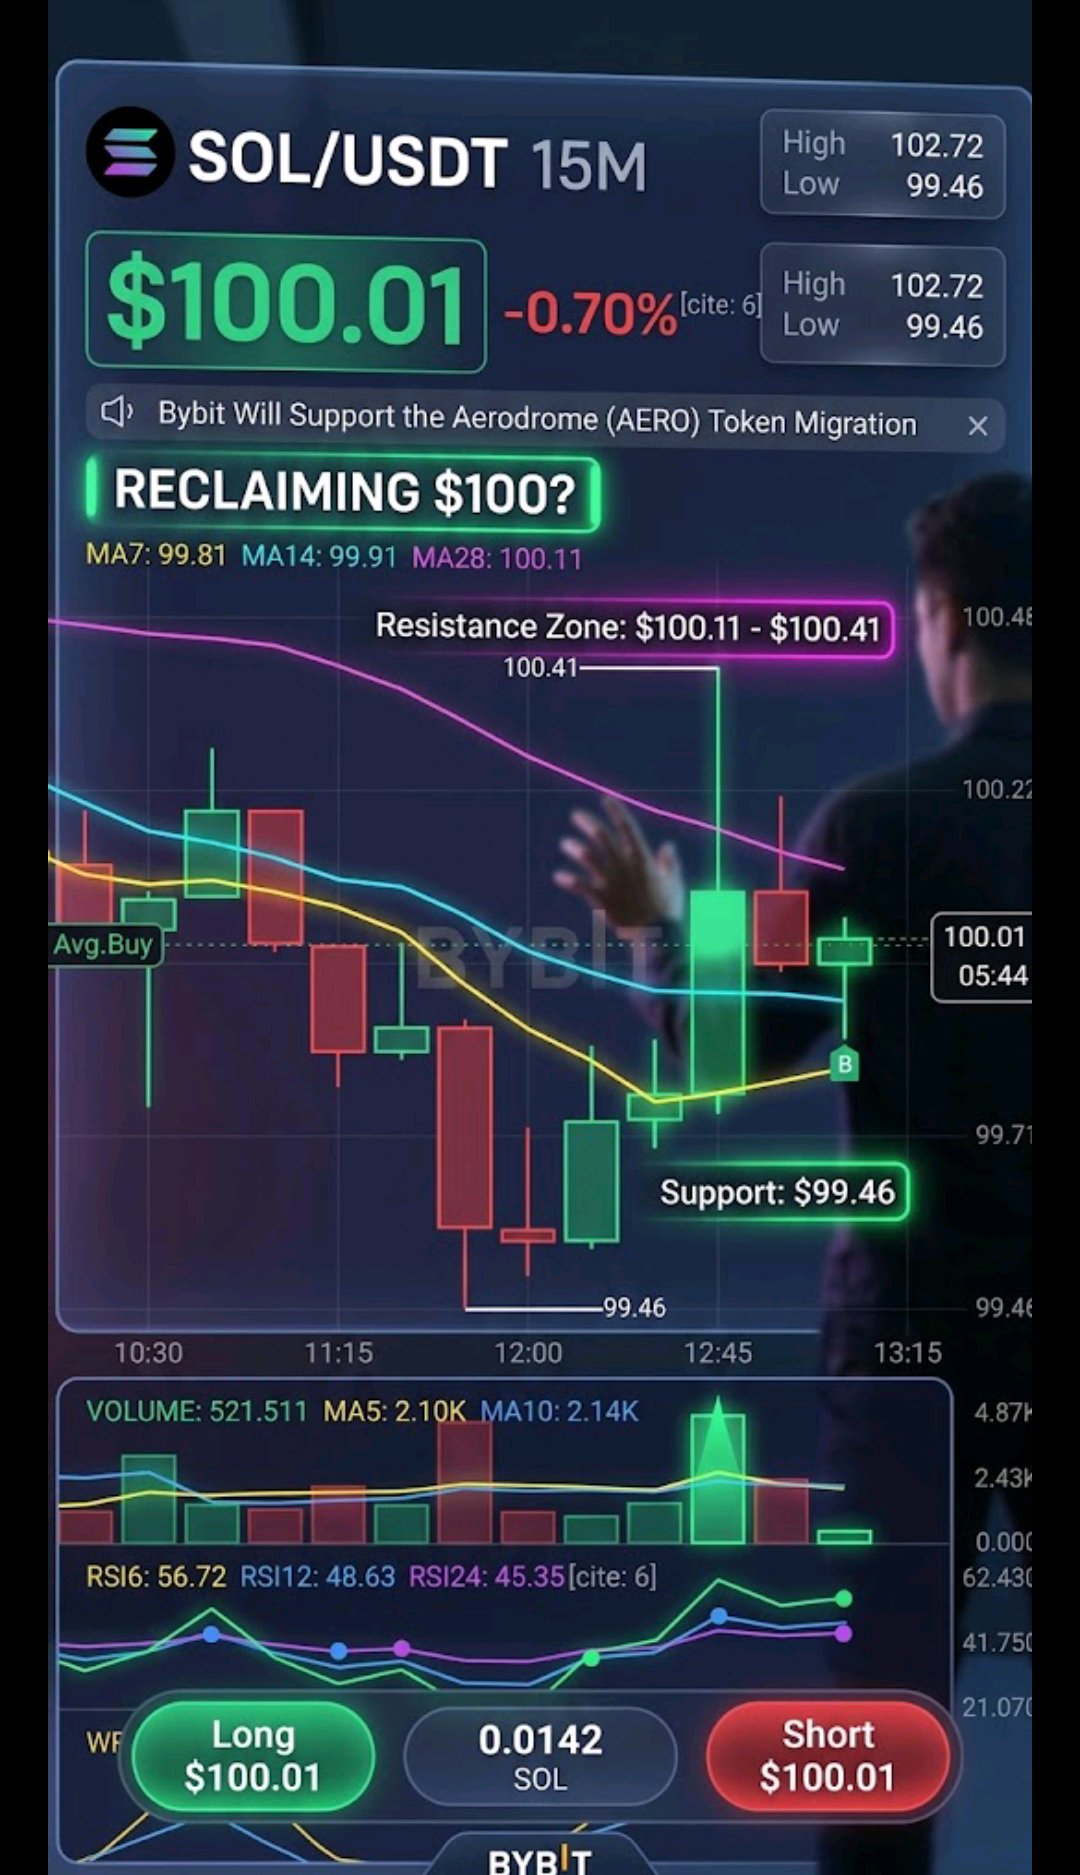
🔥 SOL 15m Bounce! Reclaiming $100? ⚡
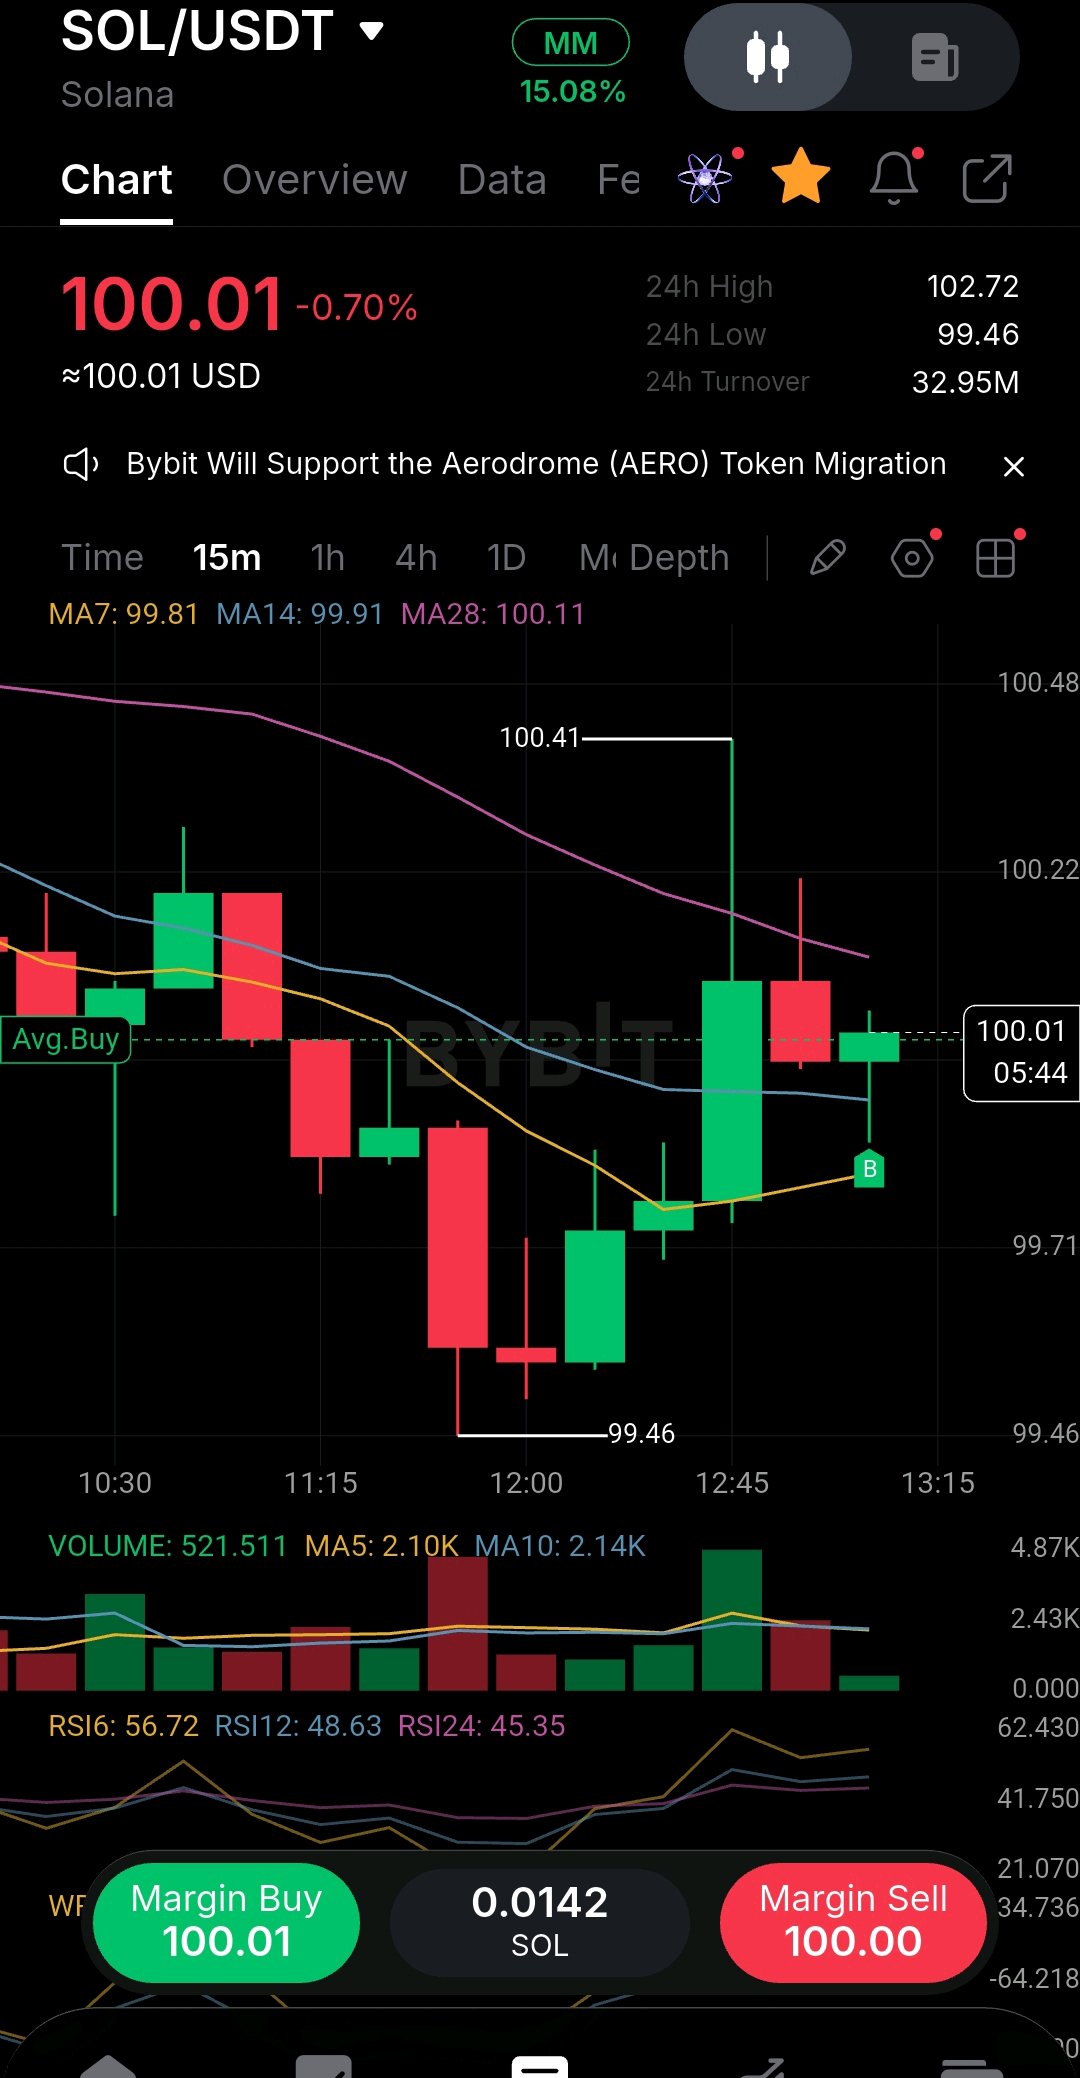
Solana ($SOLUSDT ) is trading at $100.01 (-0.70%), bouncing off the $99.46 low and testing the MA28 ($100.11) on the 15m chart. 📊 Key Levels: Current: $100.01 24h Range: $99.46 - $102.72 Resistance: MA28 ($100.11) & 100.41 Bulls are trying to push back above the psychological $100 mark. Will it hold the ground or drop again? 📉📈 💬 Are you long or short here? Drop your prediction below! 👇 #Solana #SOL #CryptoTrading #WSOT2026 #IMPACTbyTrade #MidtermsMarketWatch #Bybit8thAnniversary

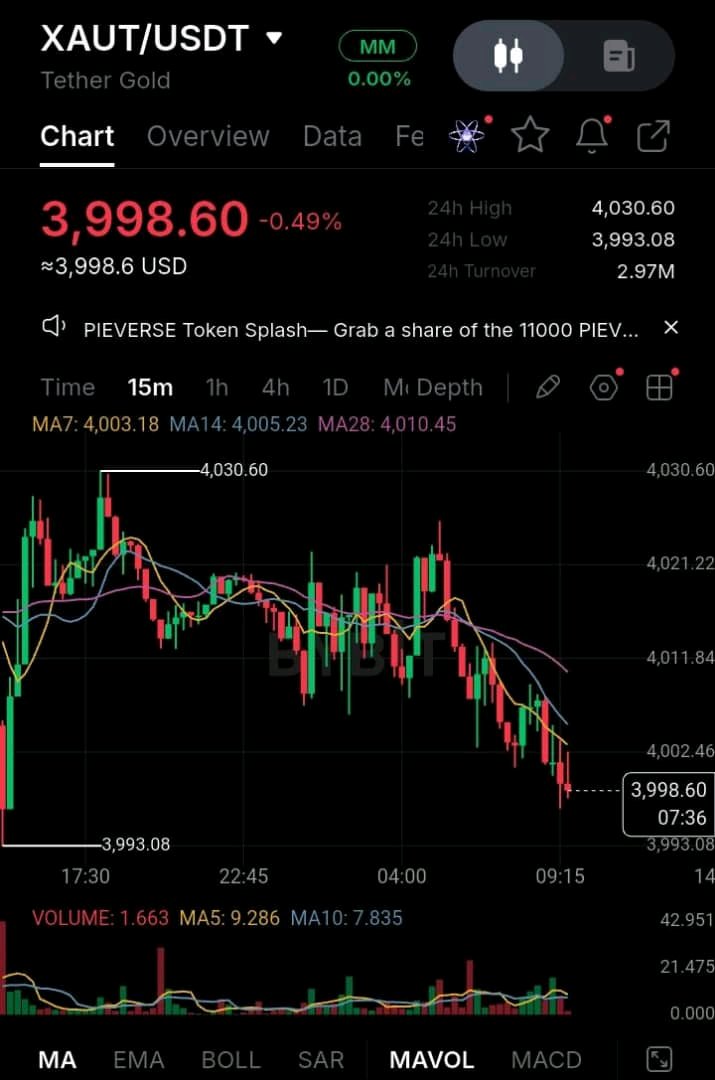
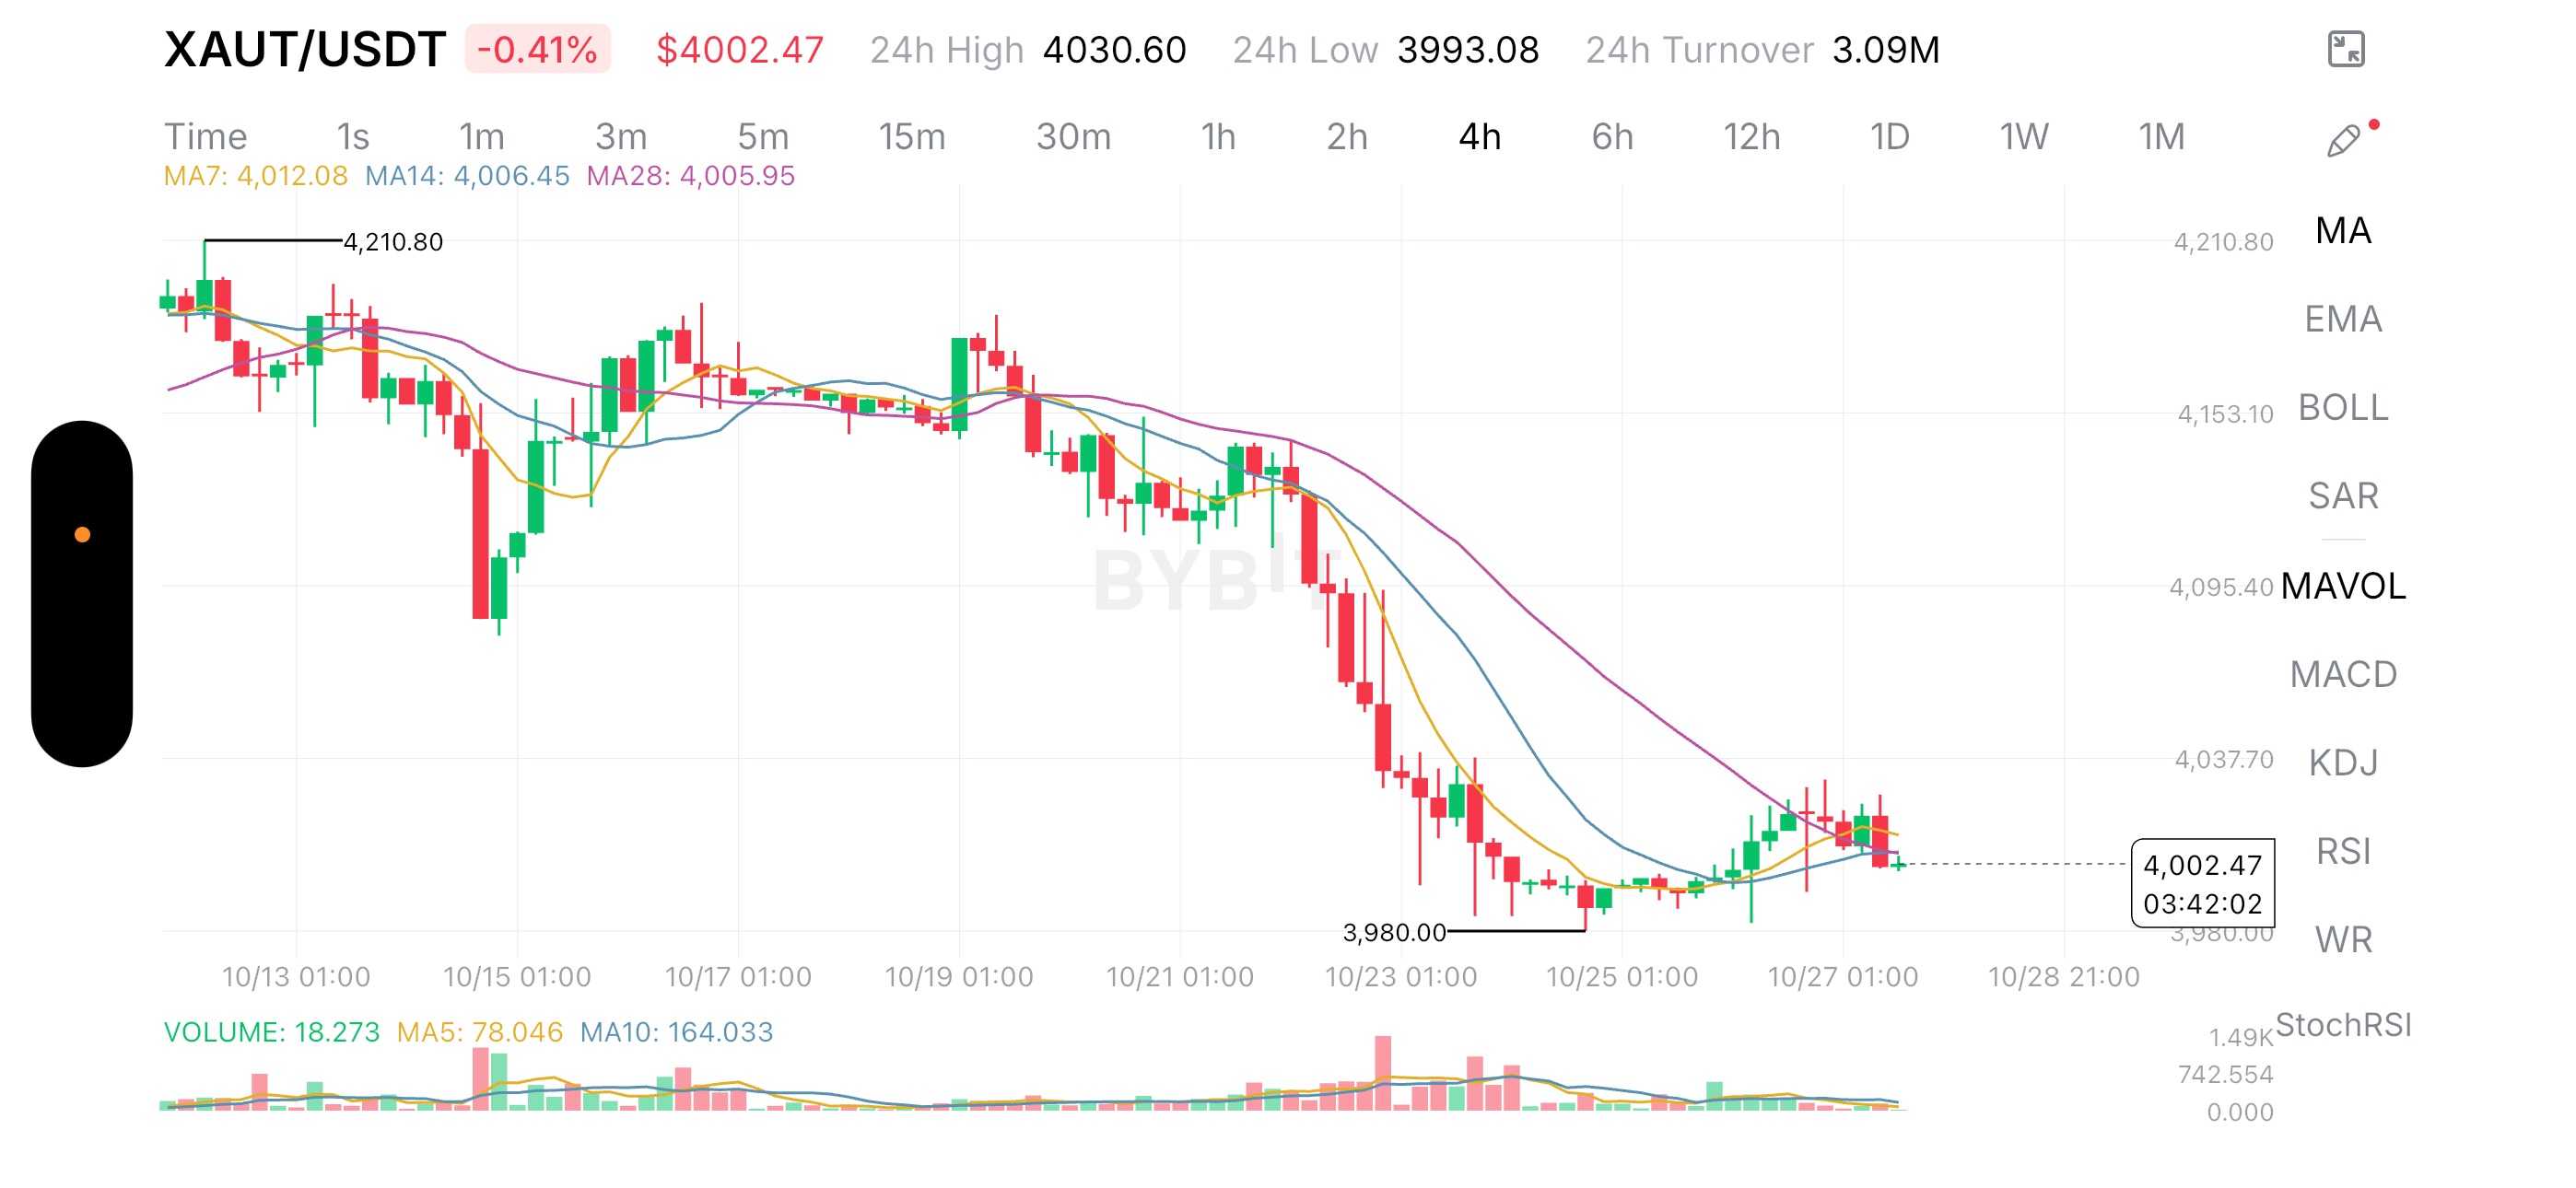
The interesting signal in XAUT is not simply that tokenized gold has fallen to $4,002.47. It is that the market has attempted to stabilize after a sharp sell-off, yet the recovery is already struggling beneath its moving averages. On the 4-hour chart, XAUT declined from a visible high near $4,210.80 to a low around $3,980.00. Buyers subsequently pushed the price higher, but the rebound has not established a convincing bullish reversal. My central question is whether this is genuine demand returning to tokenized gold or merely a temporary pause after aggressive selling. That distinction matters because XAUT represents exposure to gold, while its short-term trading price is also affected by crypto-market liquidity, order flow and the relationship between the token and the underlying metal. The recovery is facing a technical credibility test The displayed moving averages are clustered above the current price: * MA(7): $4,012.08 * MA(14): $4,006.45 * MA(28): $4,005.95 XAUT is trading below all three, although the gap is relatively small. The short-term average has also moved above the other two, suggesting a recent rebound in shorter-term momentum, but that alone does not establish a trend reversal. What I find more important is the broader structure. The chart shows a sequence of lower prices followed by a sharp decline around October 22–24. The recovery from approximately $3,980 has been modest compared with the preceding sell-off. This creates a specific problem for bullish traders: buyers have demonstrated that they can defend the lows, but they have not yet demonstrated that they can sustain a recovery. The first test is whether XAUT can reclaim the $4,006–$4,012 moving-average area and hold above it. A sustained move higher would improve the short-term picture, while repeated rejection would suggest that sellers still control the recovery attempts. The overlooked issue: token price and gold value are not identical I would separate two different questions. First, what is happening to gold itself? Second, how is XAUT trading relative to the value of the gold it represents? Those questions can produce different answers. If the underlying gold market remains resilient while XAUT weakens, the difference could reflect temporary crypto-market selling, liquidity conditions or a deviation from its underlying value. If gold itself is declining, however, the token’s weakness may simply reflect a broader repricing of the asset. The screenshot does not provide the spot-gold benchmark, XAUT’s premium or discount to its underlying value, or current redemption-market conditions. Therefore, I cannot conclude that the decline represents a mispricing or a buying opportunity. This is the key distinction that a candlestick-only analysis can miss: a technical discount is not necessarily a fundamental discount. Before treating the pullback as an opportunity, I would want to compare XAUT’s market price with the corresponding gold value. The levels that matter next The visible low near $3,980 is the immediate structural reference. If price breaks below that area and fails to recover it, the recent stabilization would be undermined, opening the possibility of further downside. The screenshot does not provide enough historical detail to justify a precise lower target. On the upside, the $4,030–$4,037 area is a reasonable near-term zone to watch because it aligns with the recent rebound highs and a visible price-axis region. A sustained break above it would offer stronger evidence of recovering demand than a simple moving-average crossover. Beyond that, the chart’s earlier breakdown area near $4,095 becomes a more distant reference. Reaching it would require a substantial improvement in momentum. My trading decision: wait for confirmation Bullish scenario: XAUT reclaims $4,012, holds that area on a retest, and breaks above the recent rebound zone around $4,030–$4,037. That would improve the case for a recovery, provided the underlying gold market supports the move. Bearish scenario: Price loses $3,980 and fails to reclaim it. That would weaken the stabilization thesis and make further downside more plausible. I would avoid assigning exact entries, stops and risk-to-reward ratios without a clearer execution timeframe and additional price data. The fundamental question also remains unresolved until XAUT is compared with the underlying gold benchmark. My conclusion is that XAUT is approaching a decision point, not presenting a confirmed reversal. The next move matters, but the relationship between token price and underlying gold value matters even more. If both recover together, the bullish case becomes more credible. If XAUT rebounds while its underlying benchmark weakens, or trades at an unexplained premium, the move deserves greater caution. $XAUTUSDT #IMPACTbyTrade #ByXIMPACT

🚨 $XAUUSDT: BEARS ARE TAKING CONTROL
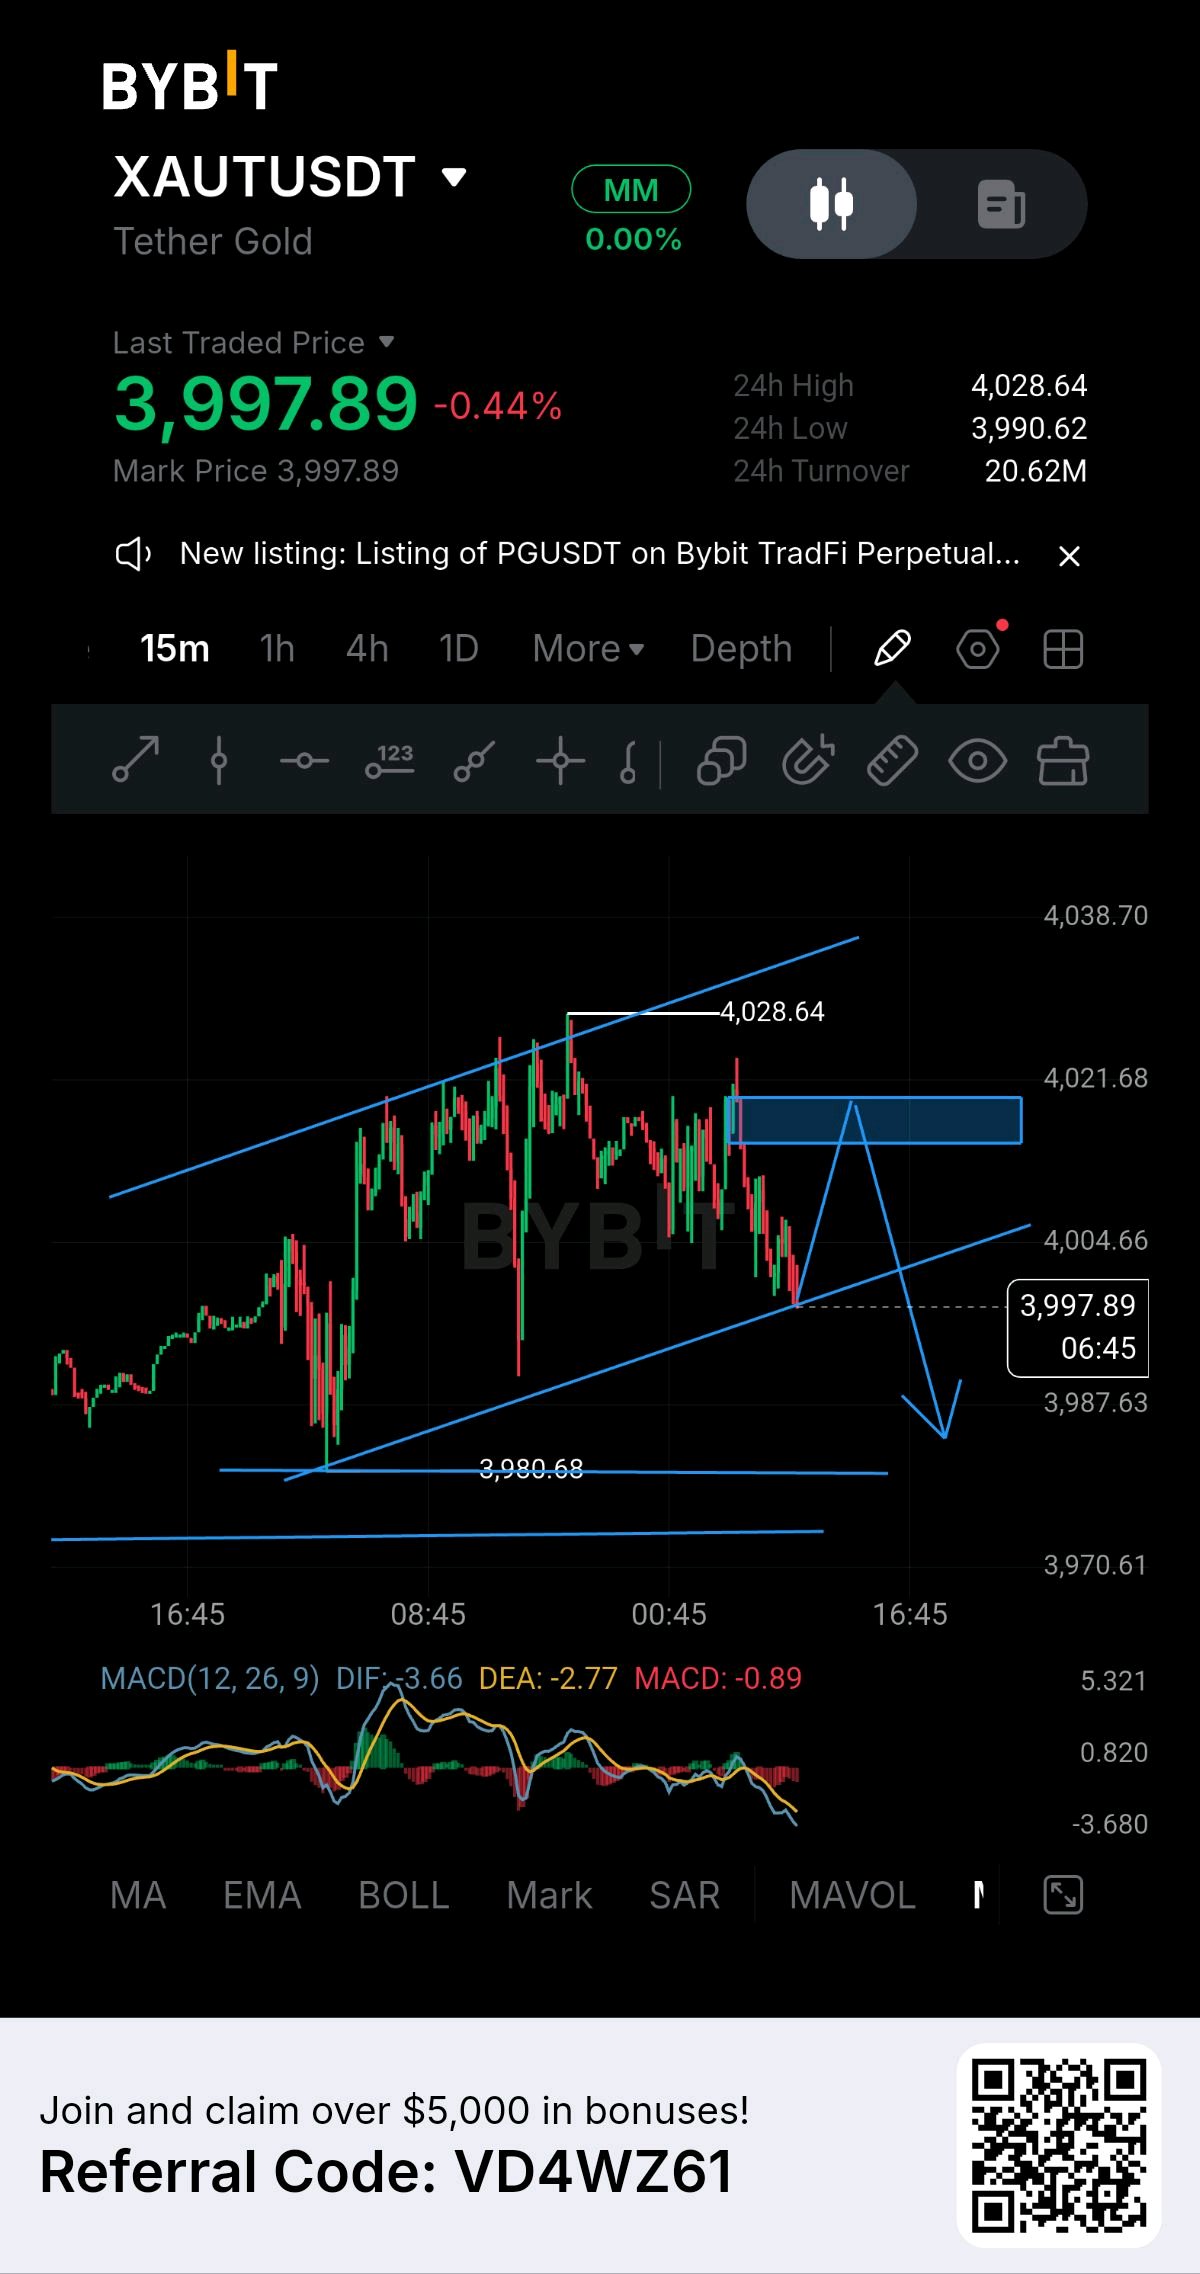
$XAUTUSDT has broken below its parallel channel on the lower timeframe, suggesting bearish momentum could continue. I'm watching for a corrective bounce into the key selling zone before considering a short setup. 🎯 SELL ZONE: 4014.88–4013.99 Potential downside targets: → 3997.21 → 3985.66 → 3968.12 The higher-timeframe structure still favors sellers, so I'm looking for a retracement into resistance rather than chasing price after the breakdown. ⚠️ INVALIDATION: A sustained close above 4034 would weaken the bearish setup and call for a reassessment. The plan is simple: wait for the correction, watch the reaction at the sell zone, and let price confirm the entry. No chasing. No guessing. Just structure and execution. #ByXIMPACT

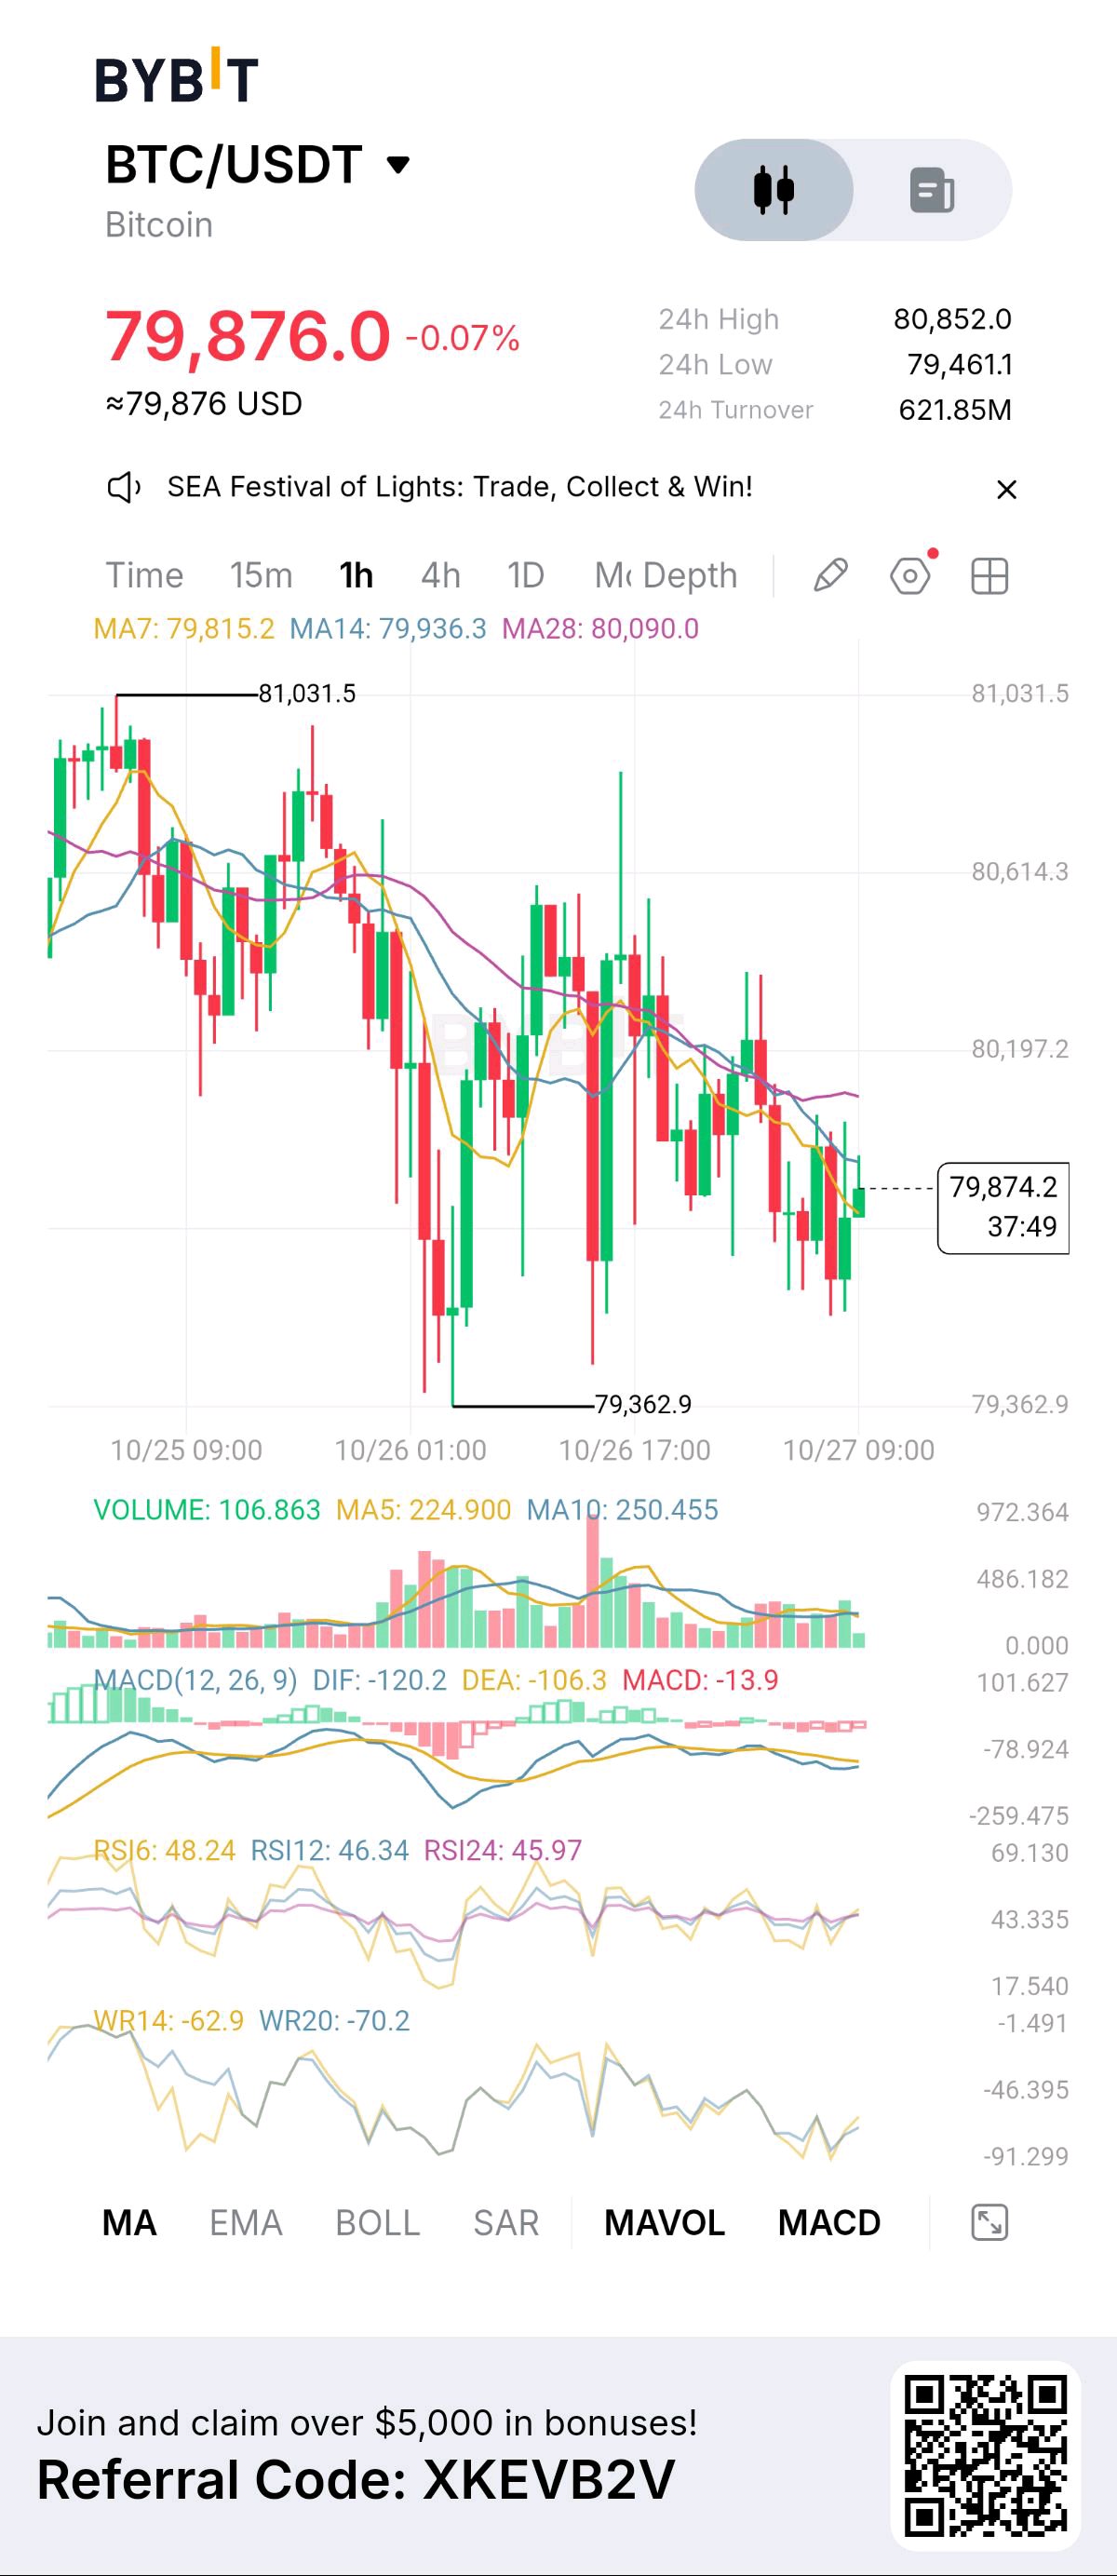
🚨 BITCOIN PRICE ALERT: BTC AT $79,876 — WILL THE BULLS RECLAIM $80,000? 🔥📈 $BTCUSDT is approaching a crucial turning point! BTC is trading around $79,876 after pulling back from its recent high near $81,031. Buyers are attempting to stabilize the price, but bearish momentum remains a concern. 💰 BITCOIN MARKET UPDATE 🔹 Current Price: $79,876 🔹 24H High: $80,852 🔹 24H Low: $79,461 📊 KEY LEVELS TO WATCH 🚀 Resistance: $80,000–$80,197 🎯 Higher Targets: $80,614–$80,852 🛡️ Support: $79,461 ⚠️ Lower Support: $79,363 📉 TECHNICAL ANALYSIS The RSI is below 50, suggesting relatively weak momentum. The MACD remains bearish, while BTC trades below its MA14 and MA28. However, the price is slightly above the MA7, indicating a possible short-term recovery attempt. 🔥 WHAT HAPPENS NEXT? 🟢 Bullish Scenario: A strong breakout above $80,197 could open the door toward $80,600 and potentially $80,850. 🔴 Bearish Scenario: If BTC breaks below $79,461, sellers could push the price toward the recent low near $79,363. 🟡 Sideways Scenario: If neither side takes control, Bitcoin may continue consolidating between support and resistance. 💎 FINAL THOUGHTS Bitcoin is at a critical decision point. Bulls need to reclaim resistance to strengthen the recovery, while bears will be watching for a breakdown below support. The next confirmed move could provide a clearer picture of BTC's short-term direction. Watch price action and trading volume before making a decision. 🔥 BITCOIN COMMUNITY, WHAT'S YOUR PREDICTION? 🚀 $80,600 — Bullish breakout 📉 $79,300 — Bearish continuation 👀 $80,000 — Sideways consolidation Drop your prediction in the comments! Technical analysis based on the supplied chart. This is not financial advice; cryptocurrency trading involves significant risk. #ByXIMPACT
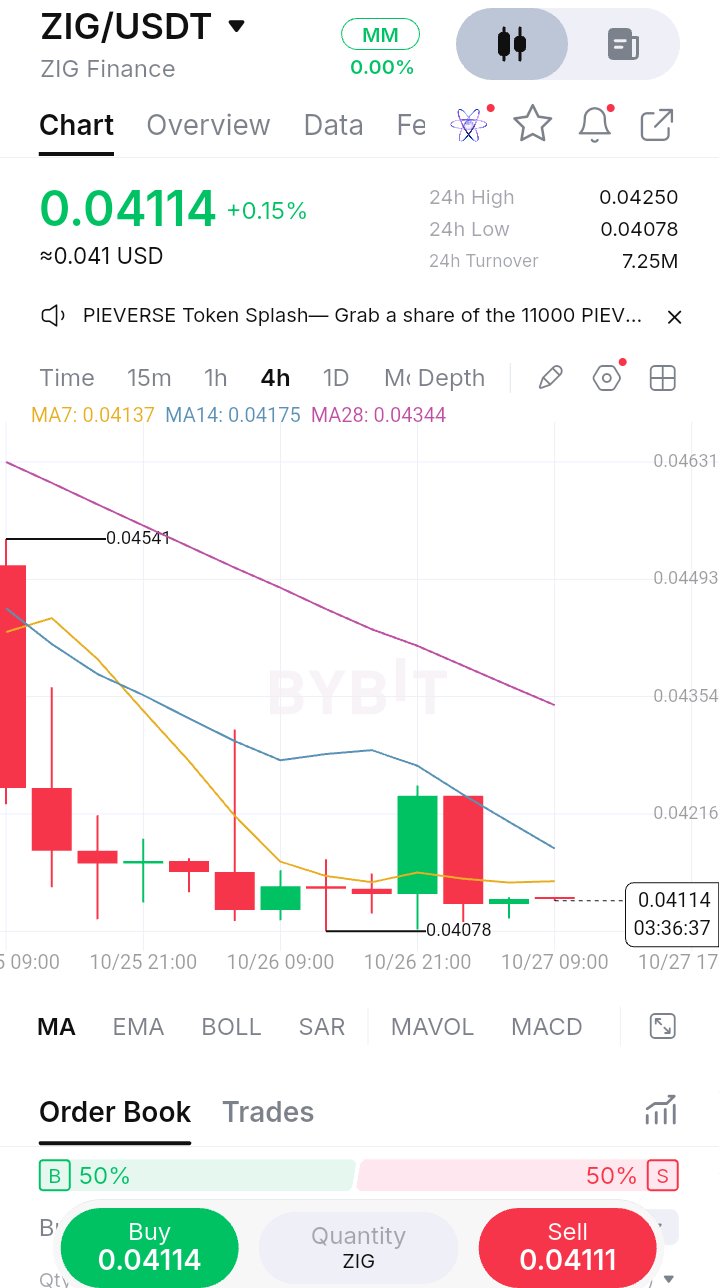
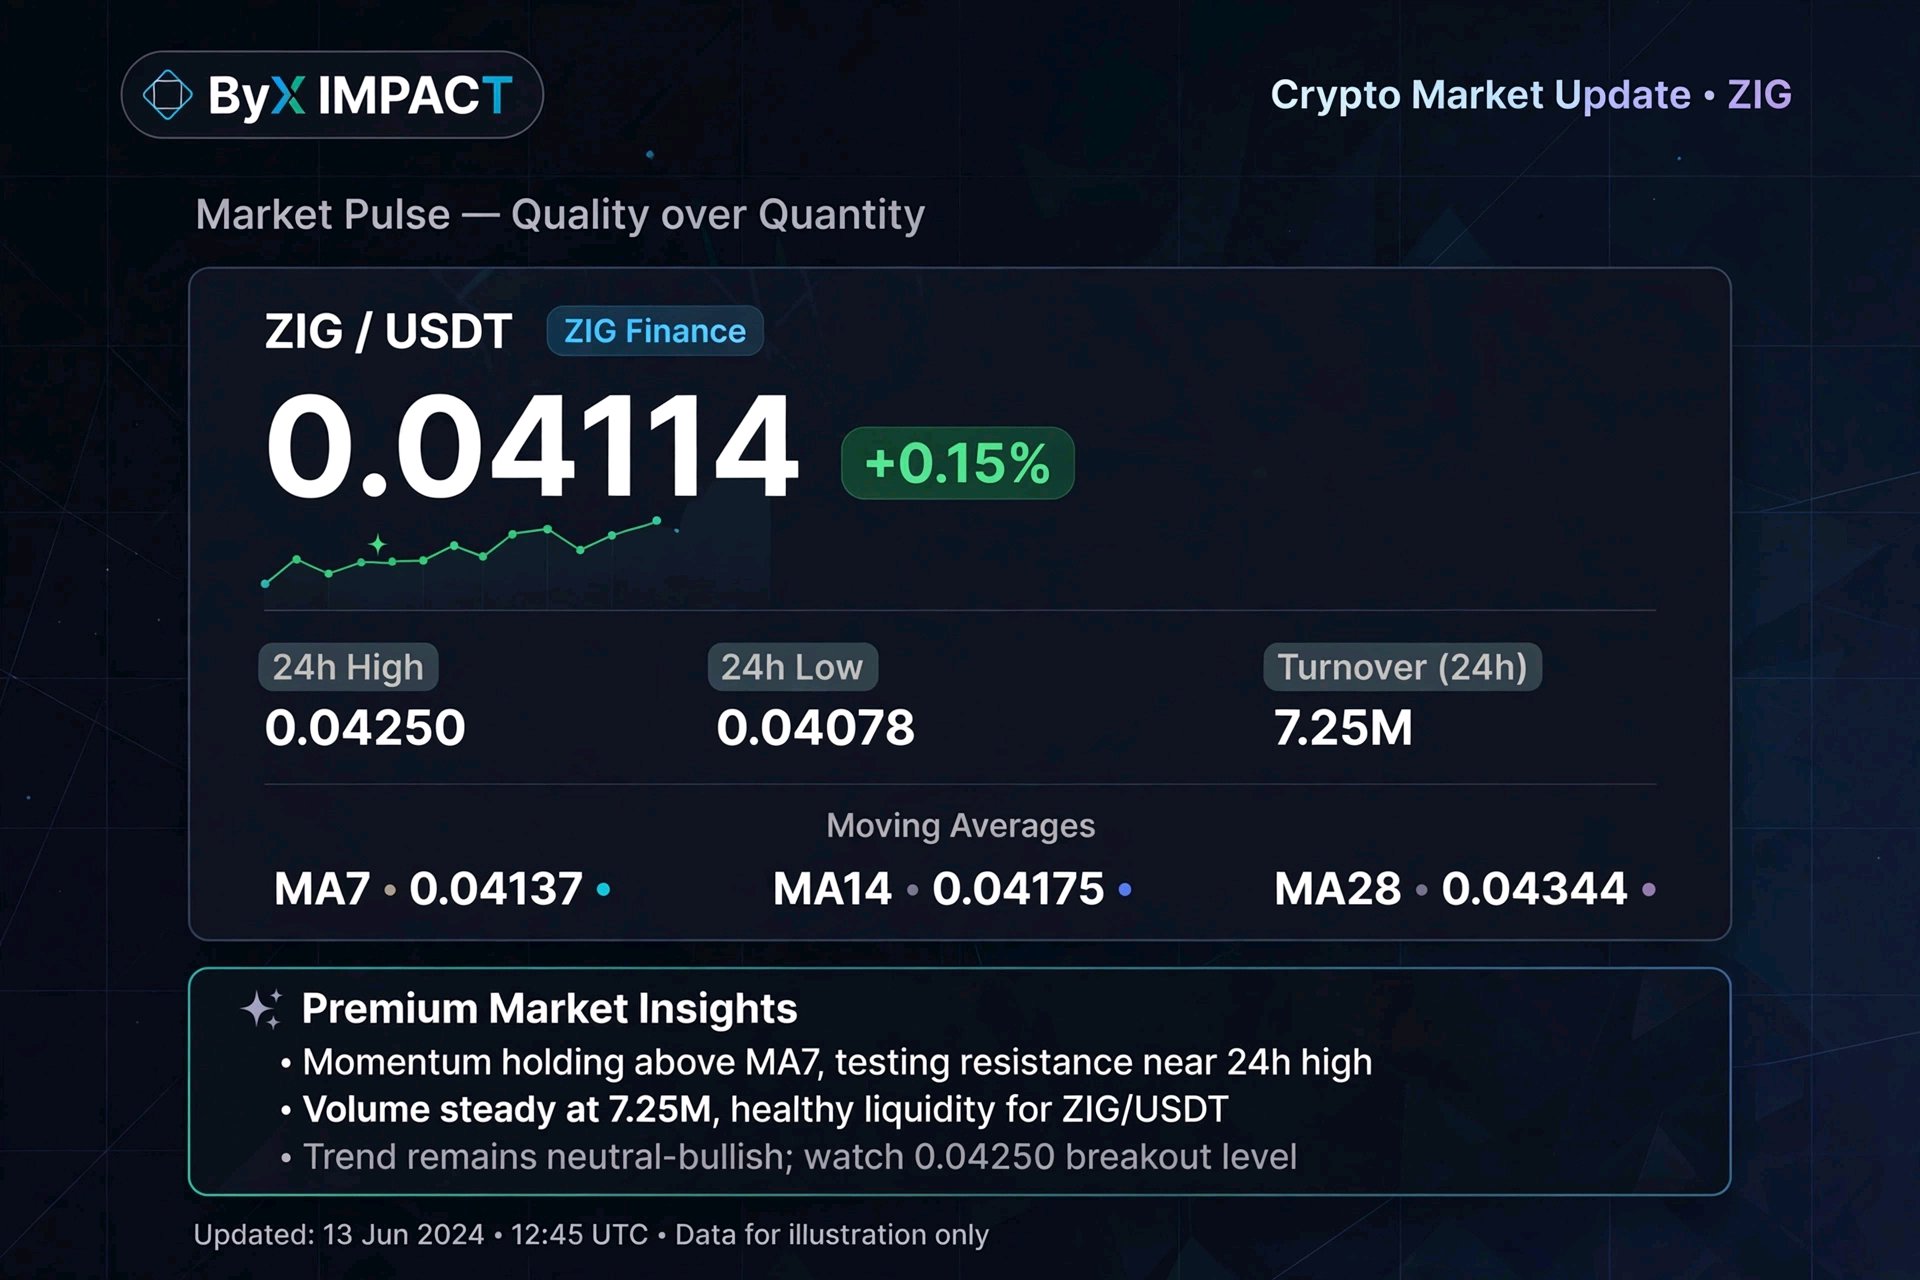
$ZIGUSDT *ZIG/USDT - 0.04114 (+0.15%) | High 0.04250 Low 0.04078 | Turnover 7.25M* *1. Structure:* This is your best recovery setup so far. - Big dump from 0.04541 high on 10/25, then bottom at 0.04078 on 10/26 - Big green spike on 10/26 21:00 with volume - reclaim attempt, but rejected at 0.04216 (MA14 area) - Now price 0.04114 is sitting RIGHT on 24h Low support 0.04078. Two dojis near low = seller exhaustion. *2. MAs:* MA7 0.04137 | MA14 0.04175 | MA28 0.04344 Price is below all but VERY close to MA7 (only 0.00023 difference). That's tighter than DATA or AAVE. If ZIG closes above 0.04137, it's first to reclaim. *3. Order Book:* 50% Buy vs 50% Sell - perfect balance, unlike the 99% fake walls on DATA/AAVE. This is healthy consolidation. *4. Trade Plan > *ZIG - Bottom Fishing or Breakdown?* > After -9% drop from 0.04541 to 0.04078, ZIG is coiling at support. MA7 at 0.04137 is immediate resistance. > > *My lesson:* Before I would FOMO the +0.15% green. Now I wait for confirmation: Need 4H close > 0.04175 (MA14) to confirm reversal. Target 0.04250 high, then 0.04344 MA28. > > *Risk:* SL 0.04070 below 24h low. No long if 0.04078 breaks. #ByXIMPACT #MidtermsMarketWatch #IMPACTbyTrade

SPCX/USDT — Market Recovery in Focus
SPCX is trading near $147.99 after retreating from the $176.31 peak. Price is attempting to stabilize around the $143–$148 region, but buyers still need to overcome nearby resistance. A strong move above $150.55 with increased buying volume could support a recovery toward higher price levels. LONG POSITION — ROUND 1 Entry Zone: $145.00–$148.00 Take-Profit Targets: TP1: $150.55 TP2: $154.89 TP3: $158.00 TP4: $162.00 Stop Loss: $141.80 Support Levels: $144.92 / $142.32 Resistance Levels: $149.14 / $150.55 / $154.89 / $155.76 Breakout Watch: A sustained move above $150.55 with stronger buying activity could improve the bullish outlook. Failure to hold support may weaken the setup. Risk Management: Confirm the price action before entry, control position size, and avoid chasing sudden price spikes. This is a speculative chart-based plan, not a guarantee of profit. #ByXIMPACT #2026FinancialPassport #IMPACTbyTrade #MyByXTake #AnthropicS1Filing $SPCXXUSDT $MNTUSDT


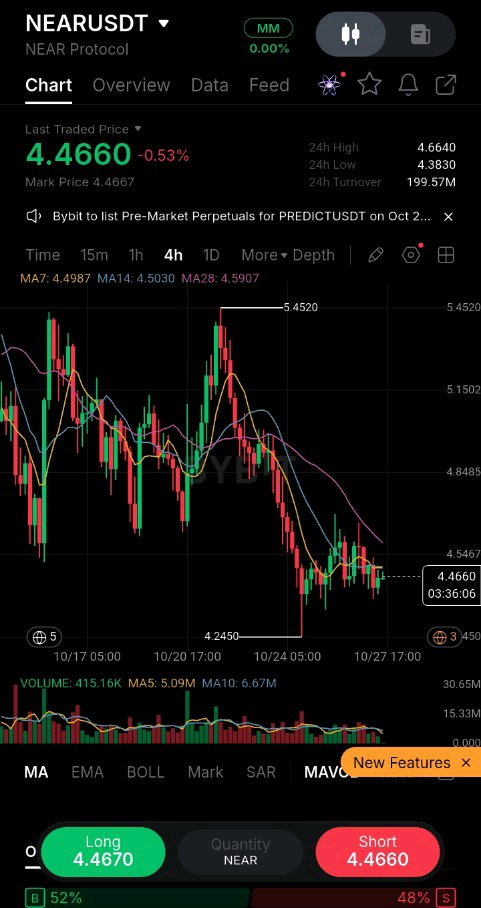
NEARUSDT: The 4.46 Bounce Is Not the Breakout Yet Looking at NEARUSDT on the 4H chart, what caught my attention wasn't the green candle—it was the failure to hold the 5.45 high. Price printed a clear lower high there, then bled down to 4.2450 before finding buyers. That bounce is interesting, but it's not a trend reversal yet. Market Read We're currently at 4.4660, pinned right under the cluster of moving averages: MA7 at 4.4987, MA14 at 4.5030, and MA28 at 4.5907. That's a wall of dynamic resistance directly overhead. The structure is still a series of lower highs since the 5.45 rejection, so the immediate bias remains corrective until proven otherwise. Key Levels · Resistance: 4.50–4.59 (MA cluster) and 5.15 (prior breakdown zone) · Support: 4.2450 (swing low) and the 4.38 area (recent defense) · Trigger: A 4H close above 4.59 My Trade Plan I'm not chasing this bounce at 4.46. The risk/reward is poor with resistance only 4% away. Instead: · Entry: Wait for a 4H close above 4.59, then buy the retest of 4.55–4.59. · Invalidation: A drop below 4.38 weakens the setup; below 4.2450 kills it. · Targets: TP1 5.15, TP2 5.45. · R:R: Roughly 1:2.5 if the retest holds—decent, but only with confirmation. What I'm Watching Next If price rejects at 4.50 and rolls over, the 4.2450 low becomes the magnet. If it reclaims 4.59 with volume, the lower-high structure breaks and I'd look toward 5.15. The lesson here: a bounce is not a breakout. Waiting for the MA reclaim saves you from buying into supply. $NEARUSDT #ByXIMPACT
📈 $UNI 合约多单|回调 27% 后守住 7.0,这波反弹能摸到 7.8 吗? 📍 入场:$6.95 - $7.10 🛑 止损:$6.72 🎯 止盈1:$7.52 🎯 止盈2:$7.95 💡 逻辑: ① 技术结构:现价 7.06 美元,24 小时涨 2.2%(聚合口径 3.3%–3.6%),但 7 日跌 2.2%、30 日跌 27%——这是回调里的反弹。日线 7 日线 7.06 走平、价格正压在上面;25 日线 7.54、50 日线 7.81 在头顶,是两道坎。下方 100 日线 6.07、200 日线 4.64 离得远,50 日线仍在 200 日线上方、金叉未坏。RSI(14) 我算下来 39 附近,第三方口径 45–51,均处中性偏弱区。真正的信心来自 4 小时:价格站回 25 日均线 6.95 上方,RSI 回到 61,从 6.52 下影线起来高低点一路抬高。近 20 日低点 6.52 是这单的生命线。 ② 量能与资金:24 小时成交额约 3.0 亿–3.8 亿美元(聚合口径有出入),成交量为均值的 0.72 倍,缩量。缩量说明抛压衰竭,6.5 那段没出现放量下破,筹码锁住了;但也说明买盘不积极,缩量反弹最容易在均线附近磨掉。衍生品端,UNI 永续持仓量约 4.1 亿美元(约 5800 万枚),24 小时基本持平。资金费率 +0.0075% 为正,多头付钱给空头,盘口偏多,但绝对值很小,情绪远没过热。 ③ 基本面催化:三个硬故事,都已落地或马上落地。第一,10 月 19 日 UNI 期货正式在受监管的合规衍生品市场挂牌,标准合约 1 万枚、微型 1000 枚,现金结算、全天候交易——第一个真正进入主流合规衍生品通道的 DEX 治理代币;消息当天冲了 15%–19% 至 10.9 美元,随后回吐到 7.3–7.5。第二,v4 的 Aggregator Hooks 于 10 月 22–26 日上线,协议费直接销毁 UNI;叠加 UNIfication 激活的 v2/v3 协议费与一次性 1 亿枚国库销毁,代币经济从纯治理转向通缩。第三,关键时点——Unichain 主网迁移至 OP Enterprise 定在 10 月 29 日,就在两天后。硬数据也撑得住:30 日成交量 752 亿美元、TVL 39 亿美元、9 月协议收入 1481 万美元创纪录。 ④ 情绪与风险:情绪是分裂的。一边是链上数据显示 10 月 23 日有 2295 个新地址首次交互 UNI,创 2022 年 11 月以来新高;另一边是一位知名交易机构创始人 10 月 24 日清掉约 32.3 万枚 UNI(约 224 万美元),理由是宏观与地缘不确定性,还说市场得先调整再上涨,短期压制实打实。另两点必须说清:一是期货上市不等于价格地板,从 10.9 回到 7.3 已演示过一遍,合约双向,机构做空一样方便;二是 29 日主网落地是利好兑现节点,资金可能借消息出货,不建议满仓扛过 29 日。还有,10 月中旬券商系公链交易量下滑四成时销毁速率一度降到零,这套通缩逻辑高度依赖真实成交量。 纪律说死:6.95–7.10 分两批进,止损 6.72 无条件执行,跌破说明 4 小时结构走坏、逻辑作废,别摊平。到 7.52 先减一半,剩下看能不能摸 7.95。 你觉得这波能守住 7.0 并摸到 7.8 吗?还是说 29 号迁移之后就该撤了?评论区聊聊你的目标价,仓位控制别上头,严格带止损。$UNIUSDT

BNB is holding near $740, and I’m watching whether buyers can defend the $732–$735 area after the recent pullback. What makes this setup interesting is that BNB has just removed another 1.65 million tokens from supply, but the market still needs to show whether that reduction can translate into stronger demand. BNB is trading around $740.35, with a 24-hour range near $732.49–$742.83 and daily trading volume of approximately $1.22B. Its market capitalization is close to $97.36B, while the price remains roughly 46% below its October 2025 all-time high of $1,370.55. The immediate question is whether BNB can regain momentum or whether resistance continues to cap the recovery. The short-term structure is holding above $732, but $743–$746 is the first resistance zone buyers need to reclaim. A sustained break above that range would improve the immediate outlook, while a loss of $732 would weaken the current structure and expose lower support. The more important development is the 37th quarterly BNB burn, completed on October 19, 2026. Approximately 1,646,196 BNB, worth around $1.20B at the time, were permanently removed from supply. BNB’s Auto-Burn mechanism adjusts quarterly burns using a formula linked to price and BNB Chain block production, while BEP-95 continuously burns a portion of gas fees. That creates a meaningful supply-reduction mechanism, but there is a distinction worth making: a token burn reduces available supply; it does not guarantee that buyers will pay a higher price. Network usage, exchange activity and broader market conditions still determine demand. Key figures: - Price: ~$740.35 - 24H change: ~−0.29% - 24H range: $732.49–$742.83 - Market cap: ~$97.36B - 24H volume: ~$1.22B - Circulating supply: ~131.51M BNB - 37th quarterly burn: ~1.646M BNB - Burn value at the time: ~$1.20B - All-time high: ~$1,370.55 Bullish confirmation: Holding $732–$735 and reclaiming $743–$746 with stronger spot demand would improve the recovery structure. Bearish confirmation: Losing $732 while volume expands on the sell-off would suggest buyers are not yet strong enough to regain control. What I’m watching is whether BNB’s continuing supply reduction is accompanied by sustained demand. The burn is measurable; the market’s response is what will determine whether it matters for price. $BNBUSDT #ByXIMPACT
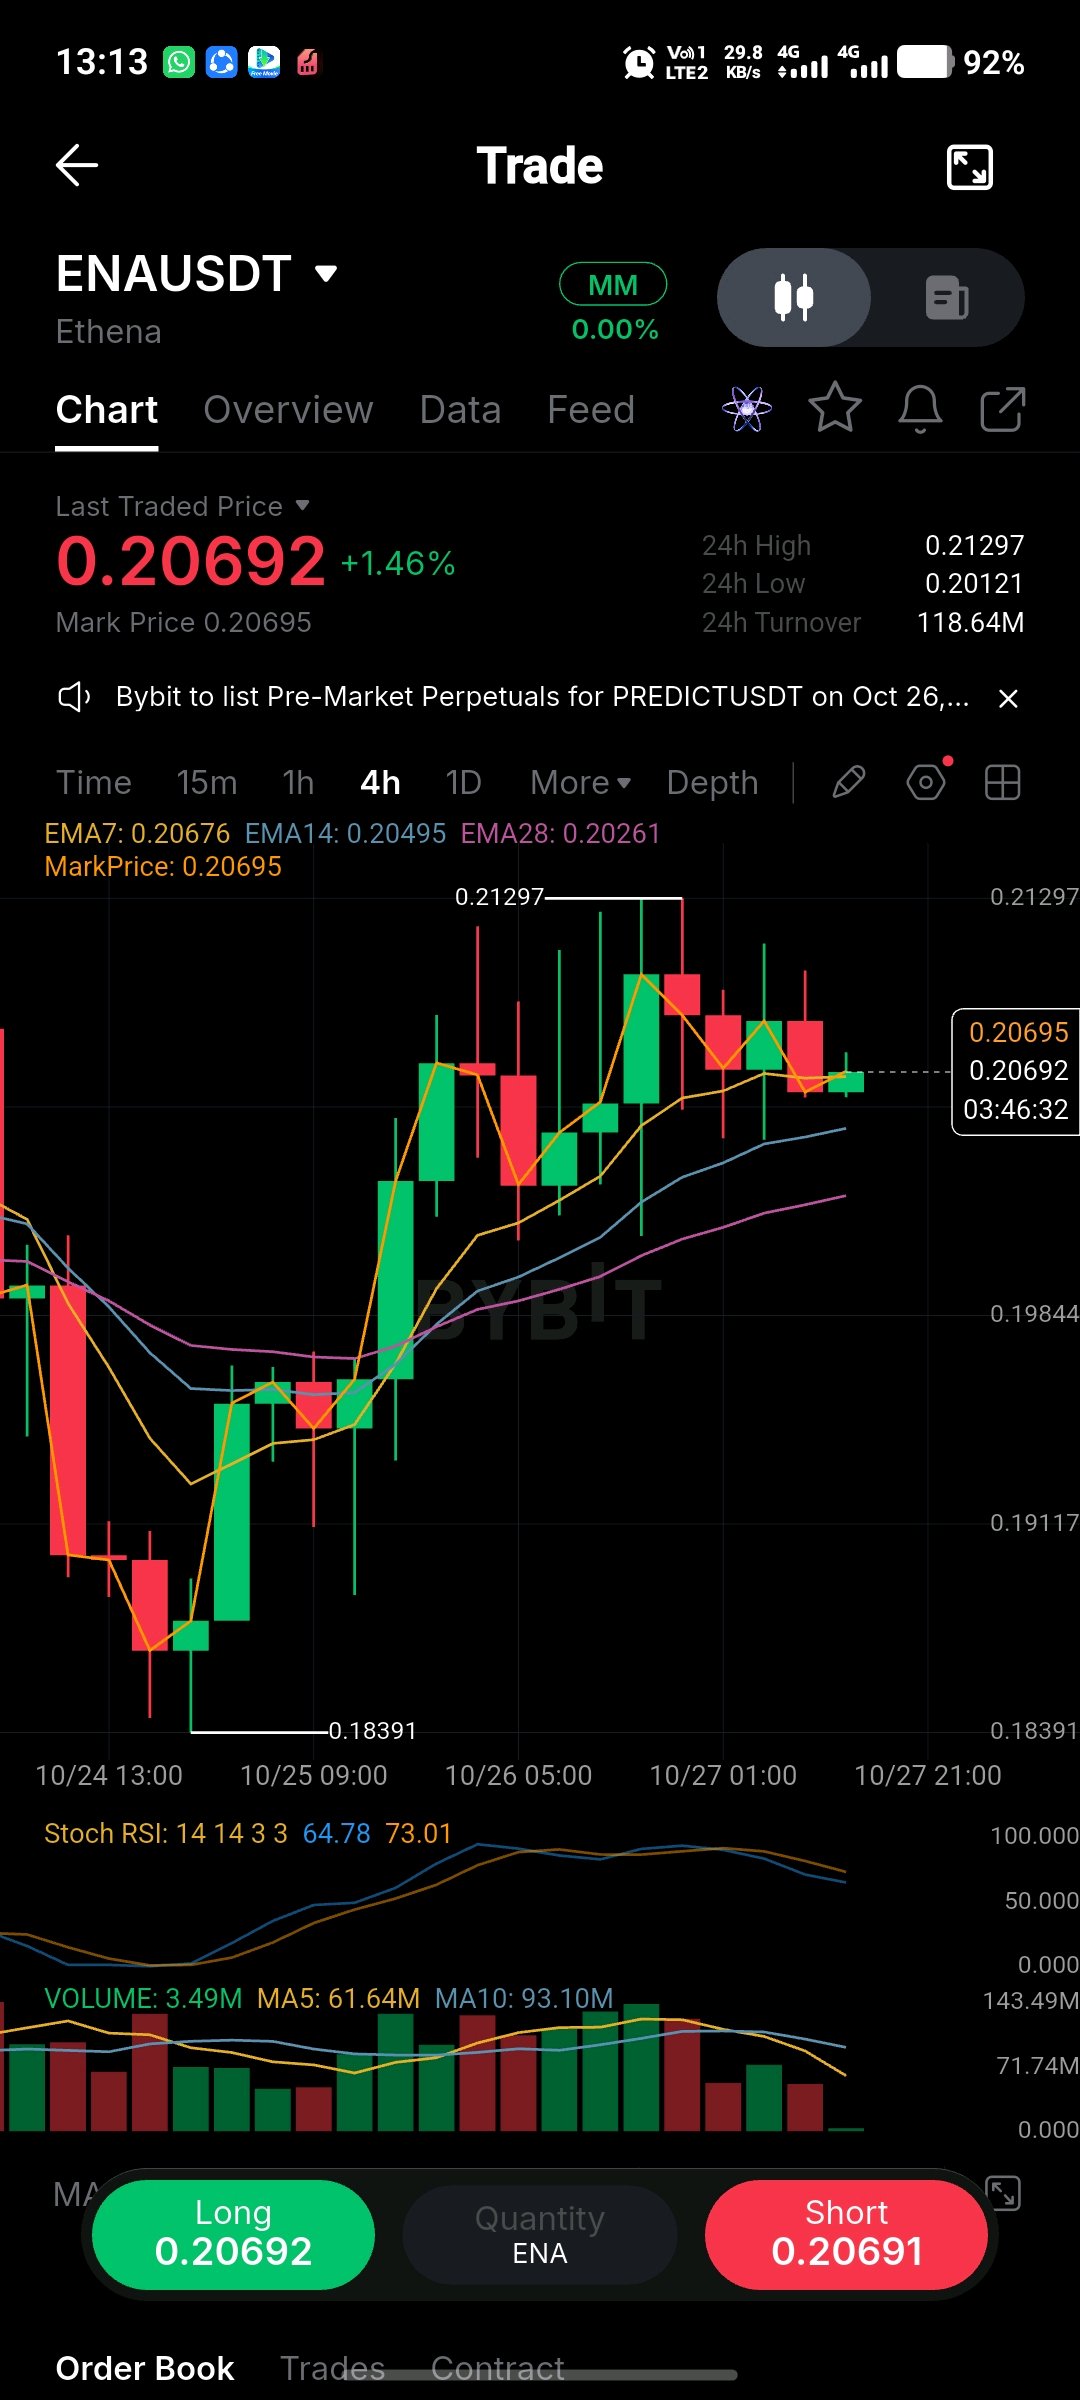
Nice recovery structure after that sweep to 0.18391, now price is digesting gains below 0.21297 top What I'm watching for Ethena is how it reacts around EMA cluster. $ENAUSDT trading at 0.20692 +1.46% , Mark 0.20695, 24h High 0.21297 Low 0.20121, Turnover 118.64M. 📍 Entry Zone: 0.20495 - 0.20676 ~ confluence of EMA14 + EMA7 🛑 SL: 4h close below 0.20261 EMA28 or 0.20121 24h low 🎯 Targets: 0.21297 -> 0.2180 -> 0.2240 📊 Context: ~ Stoch RSI: 64.78 / 73.01 rolling down from highs, still above 50 so momentum not dead ~ Volume: 3.49M vs MA5 61.64M MA10 93.10M - low volume pullback after high volume impulse on 10/25 ~ Trend holds bullish while above EMA28 0.20261 Invalidation if volume spikes bearish below 0.20261, then wait. #ByXIMPACT $ENAUSDT

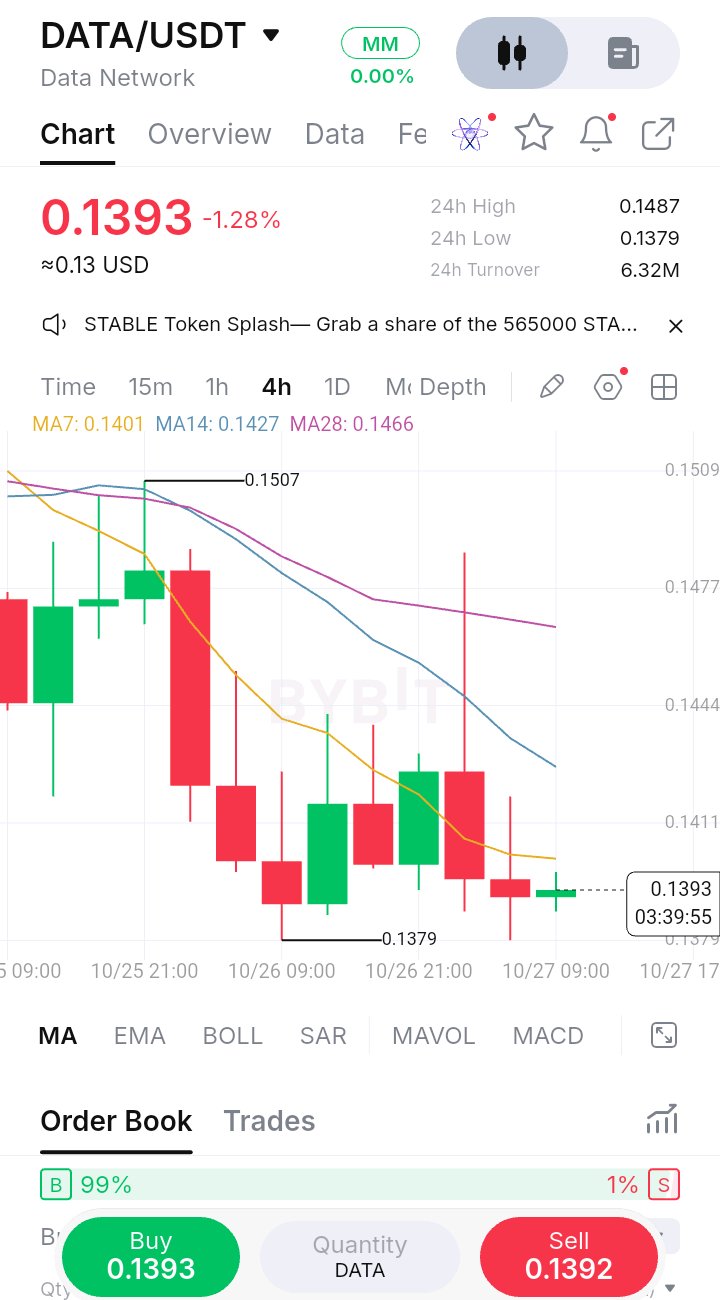
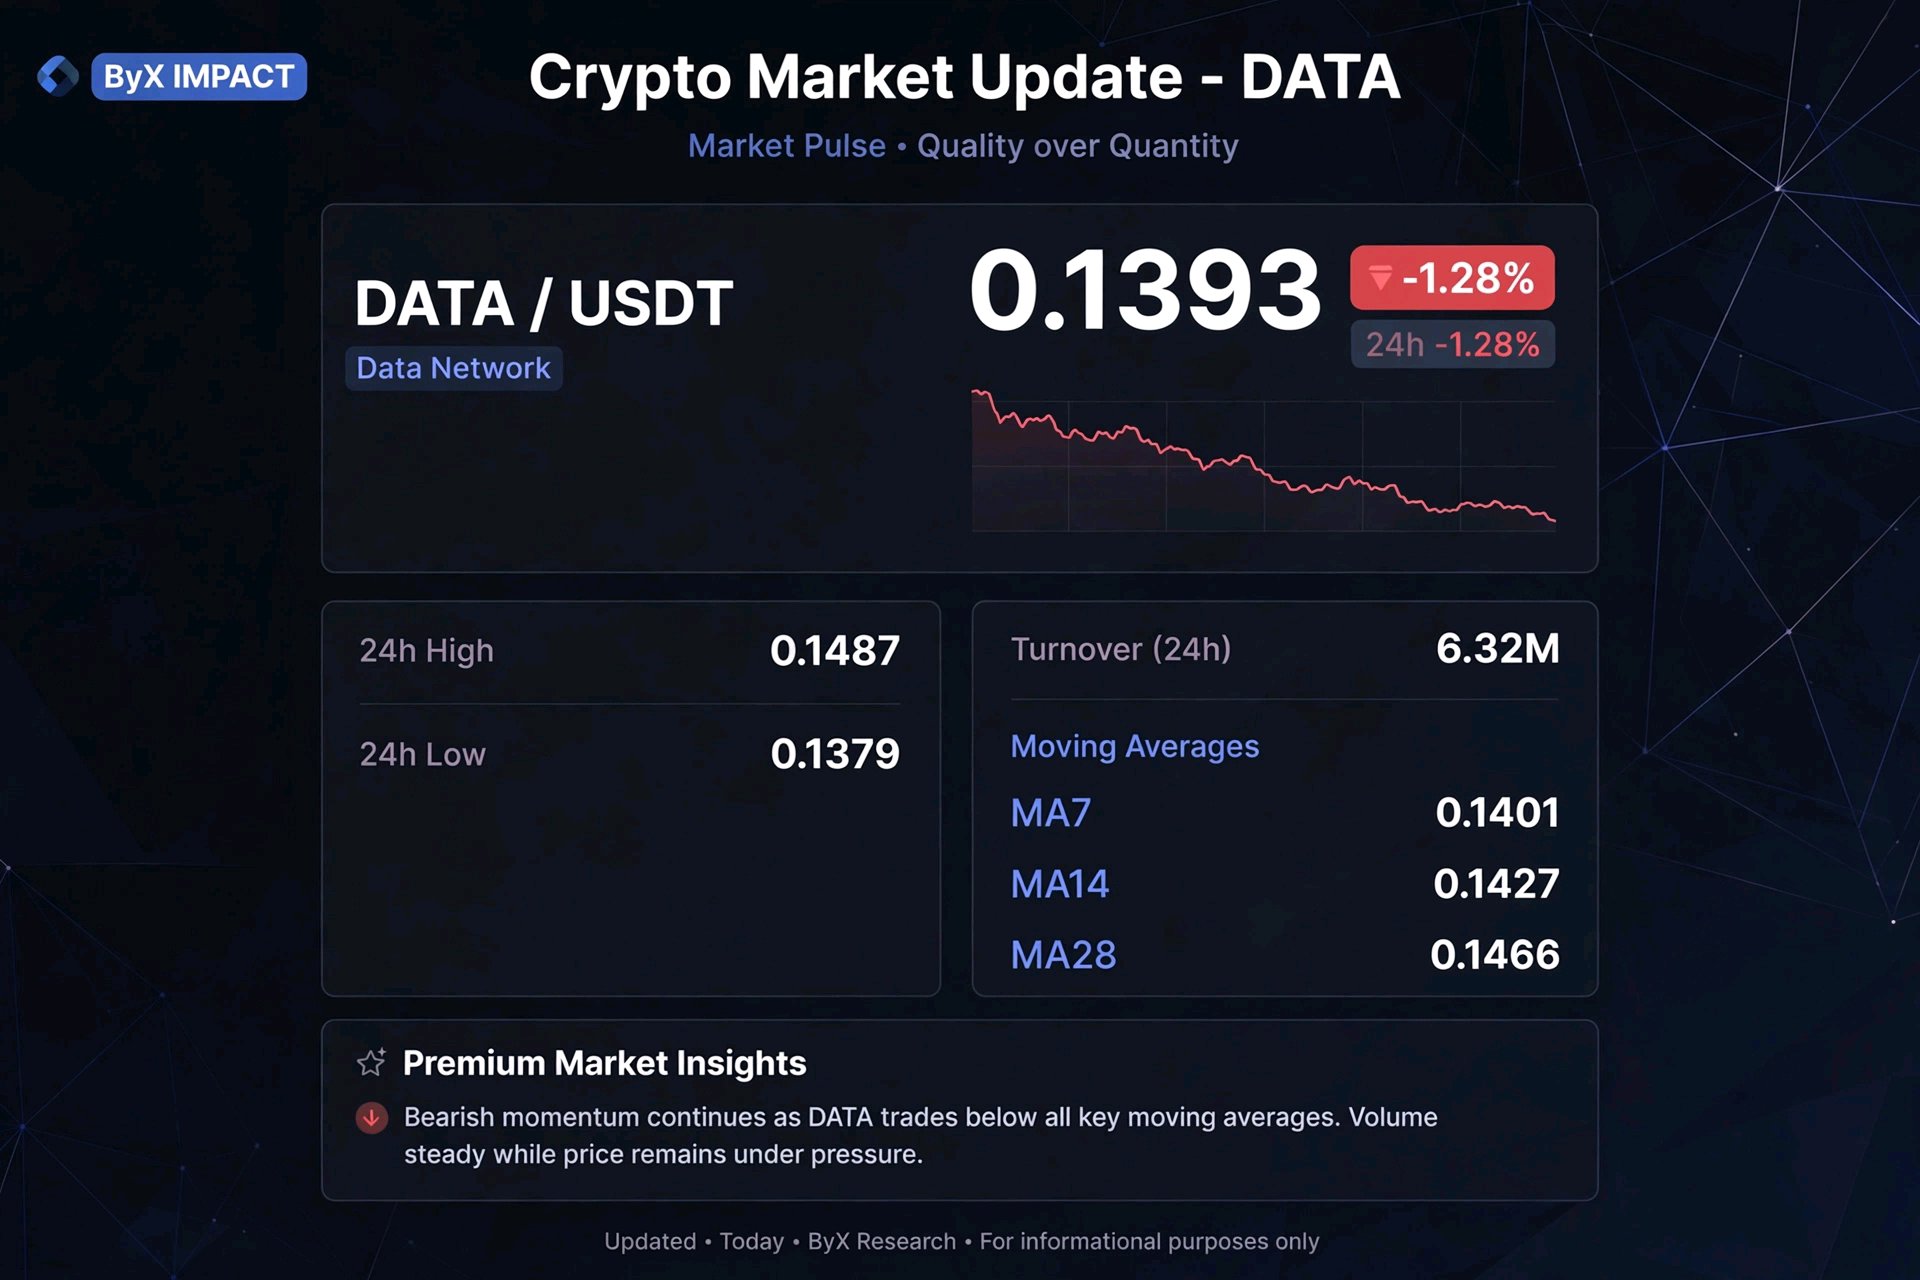
$DATAUSDT *DATA/USDT - 0.1393 (-1.28%) | High 0.1487 Low 0.1379 | Turnover 6.32M* *1. Bearish Structure:* - MA7 0.1401 | MA14 0.1427 | MA28 0.1466 Price 0.1393 below all MAs, same pattern as AAVE. MA28 far above at 0.1466 = major resistance. - Chart shows sharp drop from 0.1507 on 10/25 21:00 with big red candle - breakdown. - Now at 0.1379 low support. Your chart shows doji candles at bottom = indecision but still weak. *2. Volume:* Only 6.32M turnover - lowest among your coins. Means low liquidity, can wick fast. Dangerous for large size. *3. Order Book:* 99% Buy vs 1% Sell - Extreme buy wall like AAVE. But price stuck, not pumping. Fake support risk. If that 99% pulls, could slip below 0.1379. *4. Trade Idea Quality post angle - Compare to your NEAR trade. > *DATA - Capitulation Pattern* > DATA lost 0.1507 high and dumped to 0.1379 (-8%). Now hovering at 0.1393 just above low. No reversal yet, still under MA7 0.1401. > > *Lesson:* I used to long these 1% dips hoping for bounce. Now I learned to wait for MA7 reclaim. For DATA, need close above 0.1401 to consider scalp long, otherwise risk of breakdown to 0.1350. > > *Risk:* No trade zone. 0.1379 must hold, else avoid. #ByXIMPACT

‼️ WHAT IF BTC STALLS & HYPE SURGES?
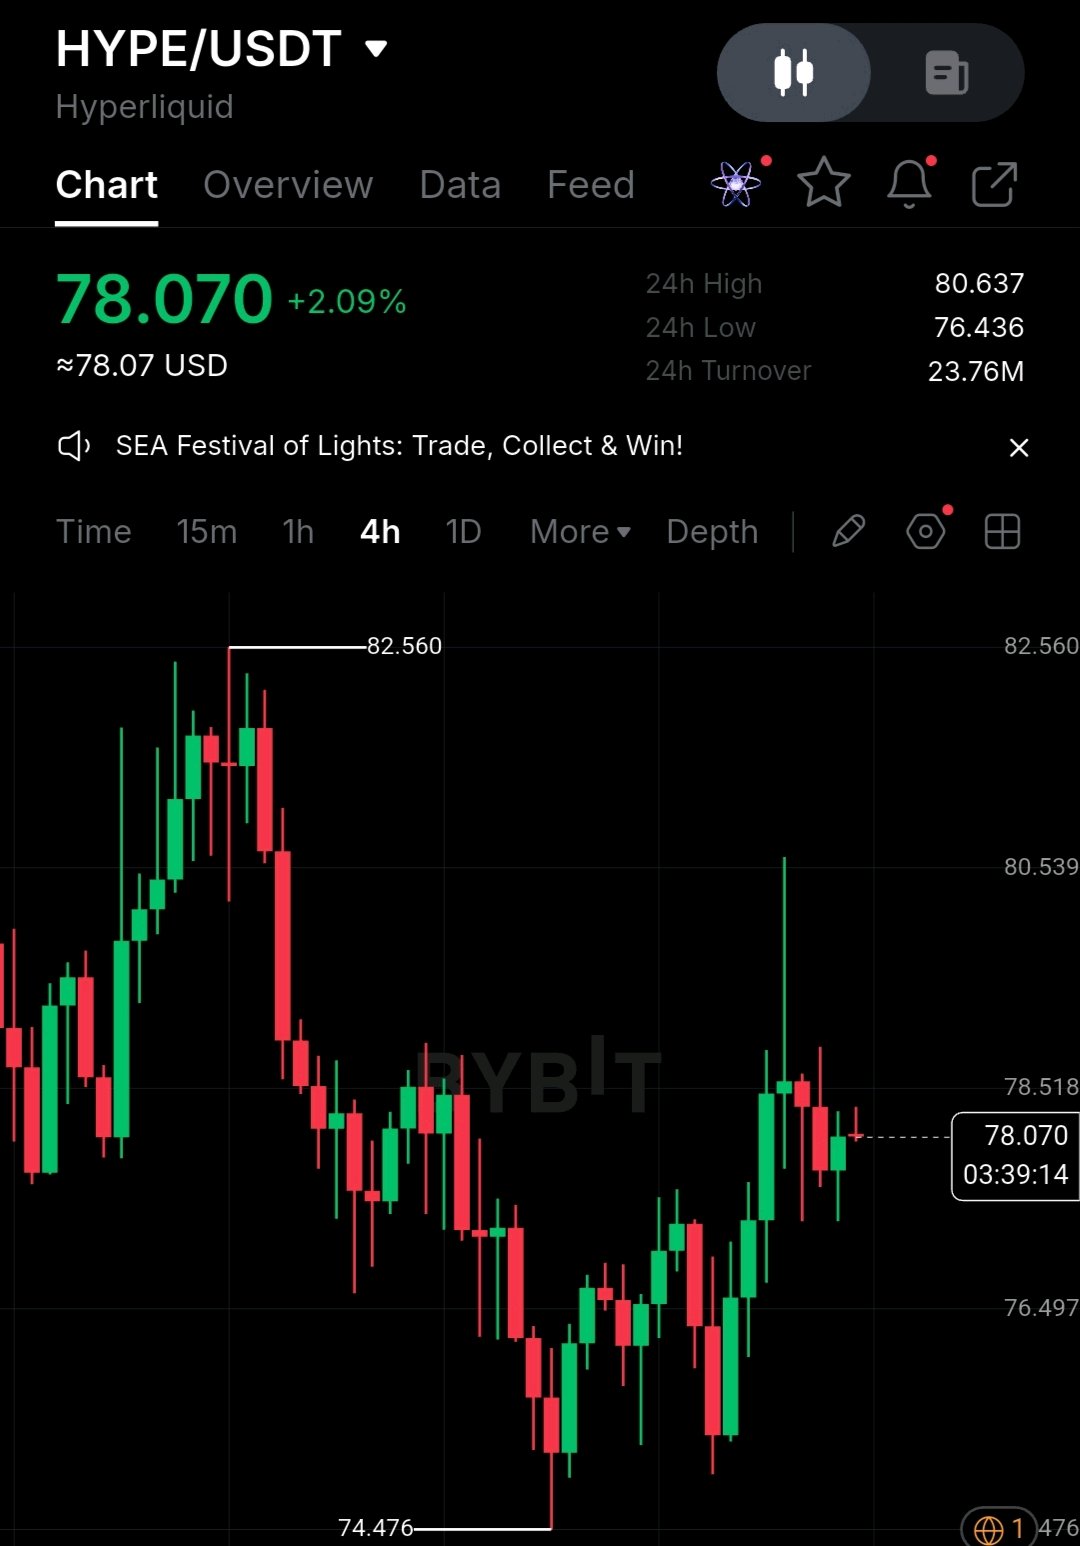
This is where the market gets interesting.... When Bitcoin can't decide where it's going, most traders start sitting on their hands. But sometimes, that's exactly when a few altcoins start showing a different kind of strength $HYPEUSDT has bounced from $74 and is now fighting around $77–$78 And I'm watching closely because if buyers can finally push through $80, this recovery could turn into something bigger I'm taking a small LONG.... not because I'm certain it'll pump, but because I see a setup worth watching Entry: $77.50–$77.85 TP: $80.20 / $81.70 / $83.25 / $85 SL: $74 One thing still bothers me.... the 4H trend hasn't fully confirmed a bullish shift, so I'm keeping the risk controlled Now let's see whether HYPE can surprise the market.... or whether $80 sends buyers back to the drawing board ❓ #WSOT2026 #AnthropicS1Filing #IMPACTbyTrade #MyByXTake #MidtermsMarketWatch

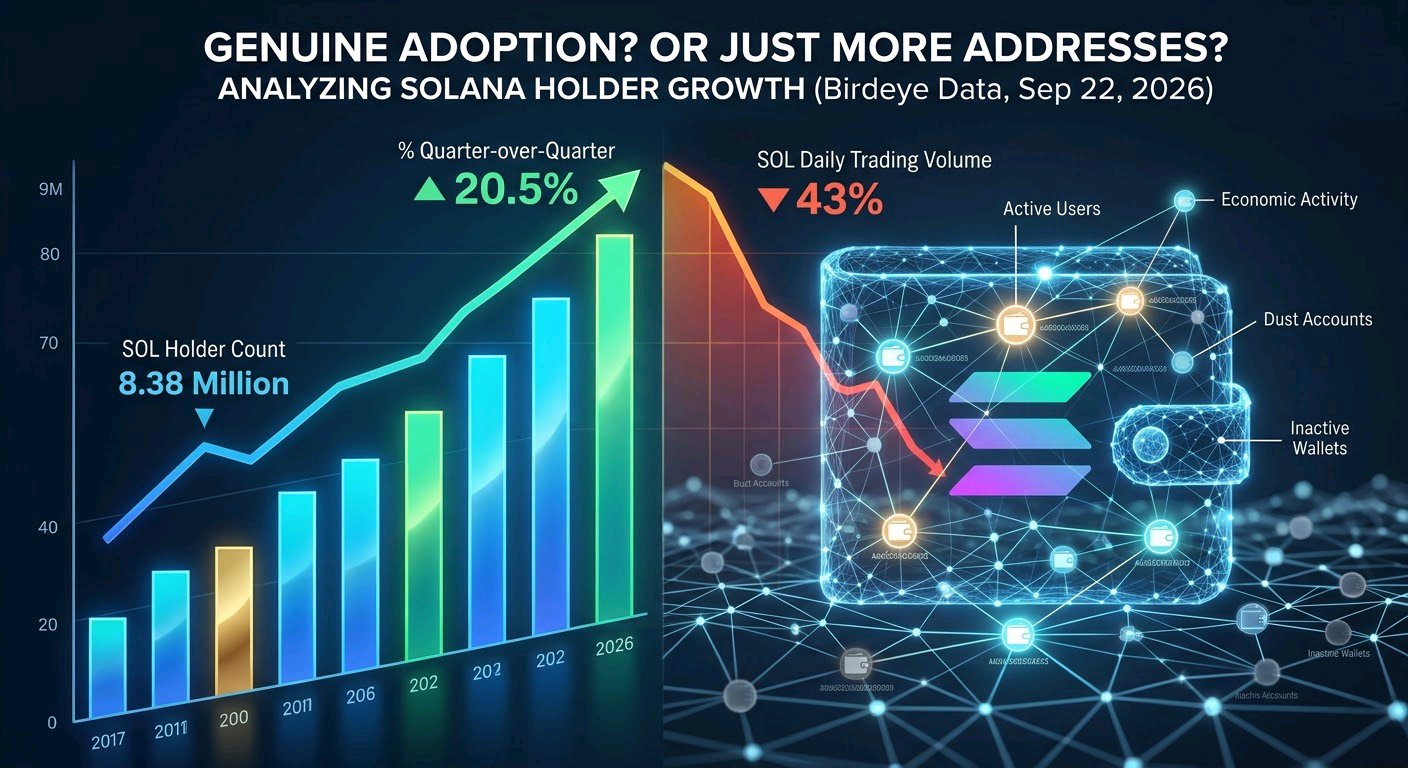
#ByXIMPACT SOL’s holder count climbed 20.5% quarter-over-quarter to 8.38 million wallets by September 22, 2026, according to Birdeye Data’s Q3 Solana report. That’s roughly 1.43 million additional wallets holding SOL, which sounds reassuring for a network whose pitch is scalable, low-cost infrastructure. More holders, however, do not automatically mean more committed users. Here’s the part that matters if you’ve ever looked at a “holder growth” chart and assumed it meant organic demand: a wallet is not a person, and a balance is not proof of meaningful economic activity. Birdeye’s report recorded holder growth even as Solana’s daily trading volume fell 43% from Q2. Those two numbers can coexist because holding and actively using SOL are different behaviors. Small residual balances, wallets created for individual applications, exchange deposit addresses, and custodial accounts can all complicate the interpretation of address-level data. Without a detailed breakdown of the counting methodology and wallet composition, it is difficult to determine how much of that 20.5% increase represents new independent participants rather than additional addresses or operational activity. I can’t confirm the cause of the increase from aggregate holder data alone. The more useful question is whether that expanding address base translates into sustained network activity, fee generation, and economically meaningful demand for SOL. Active addresses, transaction activity, fee revenue, staking participation, and supply distribution provide different pieces of that picture; none should be treated as a substitute for the others. Birdeye’s figures establish that its measured holder count increased, not that 1.43 million new people independently adopted SOL. If holder counts can rise while trading activity declines, are we measuring genuine adoption—or simply counting more addresses?$SOLUSDT